Jul 3, 2016 - liberalizationâ and 2) the TTF-SEE program to reduce costs of trade ... The Zagreb Summit sought to (1) encourage implementation of CEFTA agreements and (2) âto ..... As an emerging economy with relatively cheap labor compared to ...... Presidency of Bosnia and Herzegovina and to get seats to House of ...
REGIONAL TRADE REPORT ON FREE TRADE AGREEMENTS REGIONAL ECONOMIC GROWTH PROJECT
JULY 2016 This publication was produced for review by the United States Agency for International Development. It was prepared by KC2 Ltd. as subcontractor to SEGURA Consulting LLC, under contract AID-OAA-13-00139 with the United States Agency for International Development (USAID).
3
Regional Economic Growth Project
REGIONAL TRADE REPORT ON FREE TRADE AGREEMENTS EPORT Regional Trade Facilitation Throughout the Balkans
DISCLAIMER This publication was produced for review by the United States Agency for International Development. This report was prepared by KC2 Ltd. and SEGURA Consulting LLC. The author’s views expressed in this publication do not necessarily reflect the views of the United States Agency for International Development or the United States Government.
4
TABLE OF CONTENTS ACRONYMS ................................................................................................................................ 4 INTRODUCTION....................................................................................................................... 5 Objectives................................................................................................................................. 5 Methodology ............................................................................................................................ 5 Applicable RCA ...................................................................................................................................................... 6 Sources of Data and Information ....................................................................................................................... 7 MEMBERSHIP IN TRADE AND FREE-TRADE ARRANGEMENTS ..................................... 8 Balkan FTA Background ......................................................................................................... 9 Political Initiatives ................................................................................................................................................... 9 Trade Policy Instruments ................................................................................................................................... 11 REGIONAL TRADE FACILITATION IN THE BALKANS (THE 2000’S) .......................... 13 First results of the FTAs ....................................................................................................... 13 Trade Openness ................................................................................................................................................... 13 Macroeconomic Conditions Before Trade Liberalization ........................................................................... 14 Booming Trade with the EU (2005-2015) ...................................................................................................... 14 RCA analysis of WB (excluding Kosovo) ............................................................................. 16 Albania .................................................................................................................................................................... 16 Bosnia and Herzegovina ..................................................................................................................................... 18 Montenegro ........................................................................................................................................................... 24 Serbia ...................................................................................................................................................................... 26 Summary and Conclusions from XRCA Analysis ......................................................................................... 29 REGION AND COUNTRY SPECIFIC FTA-RELATED DEVELOPMENTS ....................... 30 CEFTA .................................................................................................................................... 31 WB Trade Before CEFTA.................................................................................................................................. 31 WB Trade After CEFTA .................................................................................................................................... 31 Albania.................................................................................................................................... 33 1997-2004 .............................................................................................................................................................. 33 Conclusions Regarding FTAs ............................................................................................................................. 36
1
Bosnia and Herzegovina ....................................................................................................... 36 B&H SAA Process ................................................................................................................................................ 36 Trade and Economic Development ................................................................................................................. 37 FTAs with EU and Other Markets ................................................................................................................... 38 Conclusions Regarding FTAs ............................................................................................................................. 40 Kosovo .................................................................................................................................... 40 Historic Summary of Kosovo FTAs and Other International Arrangements......................................... 40 Kosovo FTA and Development ........................................................................................................................ 41 FTA Related Conclusions ................................................................................................................................... 45 Macedonia .............................................................................................................................. 47 Macedonia FTAs ................................................................................................................................................... 47 FTAs and Economic Performance .................................................................................................................... 48 Trends in Macedonian Trade with the EU ..................................................................................................... 49 Macedonia and CEFTA, and Other FTAs ....................................................................................................... 50 Conclusions Regarding FTAs ............................................................................................................................. 52 Montenegro............................................................................................................................ 53 FTAs: Montenegro Merchandized Trade 2006-2009 ................................................................................... 53 FTAs after 2010: Merchandized Exports ........................................................................................................ 54 FTAs and Montenegro Export of Services ..................................................................................................... 56 Conclusions Regarding FTAs ............................................................................................................................. 57 Serbia ...................................................................................................................................... 57 FTAs with Russia and EU and Other Countries ........................................................................................... 57 FTAs and Serbian Economy ............................................................................................................................... 59 FTAs and EU and CEFTA ................................................................................................................................... 60 Conclusion Regarding Serbia FTAs .................................................................................................................. 63 CONCLUSIONS ....................................................................................................................... 64 FTAs and Trade Facilitation ................................................................................................. 64 XRCA and the Trade Within WB ................................................................................................................... 66 Institutional Benefits ............................................................................................................................................ 68 Conclusions regarding WB FTAs and the trade with and Neighborhood countries ....... 69 From Eastern Partnership to EAEU (current situation) .............................................................................. 69
2
DCFTA and the EN partners ............................................................................................................................ 70 Ukraine as a Special Case ................................................................................................................................... 71 General Conclusion of Trading with EN countries and Turkey................................................................ 74 Conclusions on Balkan FTA advantages compared to DCFTA and EAEU ............................................. 75 ANNEX 1: STATISTIC SOURCES AND LITERATURE ...................................................... 76 ANNEX 2: SELECTED COUNTRIES TRADE-RELATED STATISTICS ............................ 81 B&H EU and EFTA Trade Tables and Graphs .................................................................... 81 Kosovo Trade: 2005-2011 ..................................................................................................... 85 Macedonia Trade Statistics (2004-2014-2015) .................................................................... 87
3
ACRONYMS ATP
Autonomous Trade Preferences
B&H
Bosnia and Herzegovina
BSEC
Black Sea Economic Co-operation
BPM
Business Process Management
CEC
Central European countries
CEFTA
Central European Free Trade Agreement
CEI
Central European Initiative
EAEU
Eurasian Economic Union
ECHR
European Court on Human Rights
EIB
European Investment Bank
EN
Eastern Neighborhood (countries) of the EU: Moldova, Ukraine and the Caucasus
EU
European Union
EU DG Trade Directorate General for Trade of the European Commission FTA
Free Trade Agreement
FR
Federal Republic (refers to the official name of successor ex-Yugoslav state of Serbia and Montenegro)
GSP
Generalized System of Preferences
KCB
Kosovo Central Bank
MFN
Most Favorite Nation
RCA
Revealed Comparative Advantage
RCC
Regional Cooperation Council
RF
Russian Federation
SAA
Stabilization and Association Agreements
SAP
Stabilization and Association Process
SECI
Southeast European Cooperative Initiative
SP for SEE
Stability Pact for South Eastern Europe
SEECP
South-East European Cooperation Process
SITC
Standard International Trade Classification
TMC
Trepça Mining Complex
TTF-SEE
Trade and Transport Facilitation in Southeast Europe
WAT
Weighted Average Tariff
WB
Western Balkans
WIIW
Wiener Institut fuer Internationale Wirtschatsvergleiche, or the Vienna Institute for International Economic Studies
XRCA
Export driven RCA
4
INTRODUCTION OBJECTIVES The purpose of this report is to analyze the effects of WB Free Trade Agreements (FTAs) and membership in other international trade arrangements (WTO, custom unions and EU status) on the regional trade facilitation throughout the Balkans. It compares the political arrangements like EU SAA with FTAs, and the FTAs, economic and political processes with the impact of the Eurasian Union (and Russia) and the EU accession process of the Western Balkans. Its focus is on the comparative advantages of the FTAs in the context of trade flows:
Within the Balkans, Between the WB and Turkey, Ukraine, Moldova, the Caucasus Region, Between the Balkans and the EU, Results and impacts of EU integration and accession.
Where possible, it includes results based on the top 5-10 trading partners for each country or group. The general interest in the WB group of countries comes from the fact that they are going through an exceptionally difficult democratic and economic reforms. For example, in the mid-1980s the Former Socialist Federal Republic of Yugoslavia was the most-open and market-friendly country of the former Communist states. Its dissolution involved nation-building, military conflicts, civil unrests, periods of international protectorates, new conflicts, democratic and market oriented reforms. Albania was an exception from this myriad of challenges faced by the Western Balkans, although it was directly influenced by developments neighboring countries. Since the Dayton Accord (1995), the US and international assistance to WB countries left the territory of post-conflict aid and moved towards initiatives that made economic development and cooperation possible, and were presumed to ensure long-term peace and prosperity for the countries and the region. The trade facilitation initiatives were, perhaps, the most important part of this process. Reviews of its impacts may cast light on whether something remains to be done and what next steps of US and international involvement may be beneficial in the region.
METHODOLOGY Besides typical issues related to statistics and comparability of data, the methodology of this report addresses several very specific challenges the WB are associated with; they are the following:
Distinguishing between pure political conditionalities of EU relations and trade arrangements’ impacts (some countries such as, but not limited to, Ukraine were associated with major political upheavals); Identification of comparable time periods due to different paces of economic and trade reforms; Separation of trade-facilitation factors from other factors – like proximity and/or arbitrage opportunities (as a rule associated with price differentials, profit margins due to per capita levels of GDP, etc.) that could be more important factors of trade behavior than FTAs and other political arrangements; Application of reliable analytical methods to groups of countries with changing status in relation to both political and economic-custom unions.
In order to isolate political factors, we first reconstructed the political process that led to the establishment and implementation of the FTAs. The trade dynamics are tracked separately via an
5
adjusted method of Revealed Comparative Advantages (RCA), explained below. Finally, the Report analyzes individual countries’ effects of the trade agreements. The preferred time period covers ten years: 2005-2015, due to the following:
By 2005, WB countries implemented uniform FTAs between themselves and the EU and applied uniform asymmetric tariff liberalization in favor of the WB; The next year, 2006, WB joined CEFTA; Country Stabilization and Association Agreements (SAA) and respectively EU membership negotiations are uniform as well and restate the original FTAs; Periodic confirmation of the EU asymmetric tariff liberalization has been reconfirmed in 2015; A major assumption is that after 2005, the international market conjecture was roughly identical in macroeconomic terms for all countries, and that trade dynamics, especially the trade with the EU, reflects these terms. For this reason, the report takes into account domestic macro-factors like investment and FDIs and their correlations to trends in trade, to exports in particular; Where needed, e.g. in relation to Kosovo and Montenegro, the analysis is magnified to sectoral and fiscal circumstances.
With regard to separation of trade-facilitation from other factors, the analysis takes for granted that there was a common pattern of WB trade: to focus first on utilization of opportunities of the richer and more sophisticated EU market, with large anticipation of economy-of-scale gains, and only then, gradually, to explore non-EU markets. Some countries, e.g. Serbia, followed a specific strategy of negotiation of FTAs with Russia and EAEU, which is specifically studied in the related trade statistics. The statistical analysis is based on uniform approach with assumption that it is not affected by institutional factors (like administrative and custom procedures), because FTAs were implemented in parallel with facilitation of transport and custom cooperation. The report also considers the statistical significance of trade indicators, a 10% change in either direction, e.g. in export and import growth. Applicable RCA RCA is an index used for calculating the relative advantage or disadvantage of a certain country in a certain class of goods or services as evidenced by trade flows. The export index of revealed comparative advantage XRCA is defined as the ratio of the country’s exports in a particular commodity category to its share in total merchandise exports1.
Where X stands for exports, and the subscripts i and j refer to the industry (product category) and country, respectively.2
1
See Balassa, Bela and Noland, Marcus, “Revealed” Comparative Advantage in Japan and the United States, Journal of International Economic Integration 4 (2), Autumn 1989, pp. 8-22. 2
In this paper the net export index is also used. It is defined as
, where M refers to imports.
According to the paper the use of the net import index is superior to the export index of revealed comparative 6
The source of the data used for calculation of export index of RCA is Trade Map: www.trademap.org. Its online database includes information about the merchandise exports at 2-digit level. Data about services exports are at BPM level 1. The period of the analysis is between 2005 and 2014 because the data about services is not available for 2015. RCA methodology has the merit to explicate long periods of economic specialization, the results reflect advantages for the entire 10-year period after 2005. Products could be divided into different categories depending on the required resources for their production. 1. 2. 3. 4. 5.
Unskilled labor intensive goods Human capital intensive products Natural resource intensive products Physical capital intensive goods High technology products
Sources of Data and Information The latest WB data for this report was publish on April 26th and 30th, 2016, some trade data for other countries were updated in the course of writing; updates were closed on June 1st. This allowed an analysis of up-to-date statistics (except for trade-in services). Some policy documents important for trade, like SAA with EU for Kosovo and Ukraine were updated or reinforced in mid-May, while Georgia signed an agreement with FTA on June 5th. Trade Map is used as one of the databases that provides comparable statistics, not only in merchandized trade, but in services as well. World Trade Integrated Solution of the World Bank (or WITS) is one of the few (if not the only) sources that gives such indicators as Weighted Average Tariff and trade to GDP ratios. Trade Map is also useful for data on trade between the WB countries themselves. Since these tables are used heavily in the text, they are compiled as a Special Statistical Annex on Trade within the WB, and it is attached as supplement to this report. EUROSTAT is used for export to GDP ratios. It is a major source of data for the trade between Western Balkans and the EU. The same source is used by the DG Trade of the EU. One of the major sources of economic assessment of WB trade developments is the WIIW Balkan Observatory collection of research and working papers. Statistics portals that allow digging data and compiling of different cross-sectoral indicators for separate counties are not easily found. The portal which allows such compilation in a consistent manner for a vast majority of the countries in the world is TradingEconomics. For country specific profiles of FTAs the WTO database and national statistics agencies were used. There is a rich body of literature and analysis on FTAs and economic developments in ex-Communist countries and regions; the report uses and responds to most relevant of them. A full list of statistical sources and analytical literature is provided in Annex 1 of this report. Whenever needed, assessment of the sources either for completeness and/or reliability is provided in a respective context for the report.
advantage on trade-theoretical grounds. This is because the former indicates the effects of comparative advantage on the relationship between exports and imports rather than on exports alone. However, the net exports index has the practical disadvantage of being affected by the national import protection: in the extreme, the prohibitive protection will give rise to net export index of 100 for a differentiated product, some of which is exported. In the case of intermediate products, net exports are affected by the demand for purposes of further transformation in production for export. These considerations have led the authors to use both indices. 7
MEMBERSHIP IN TRADE AND FREETRADE ARRANGEMENTS The analyses cover seventeen countries. Of them seven currently constitute the WB region (Albania, Bosnia and Herzegovina, Macedonia, Montenegro, Serbia, and Kosovo. During the period we analyze one country, Croatia, was part of the region and subject to the impacts of the same arrangements until its formal entry in the EU (on July 1, 2013). The remaining group of the countries has different or no formal relation to the EU as an economic and trade zone. Two countries are WTO observers, and five are members of the Eurasian Economic Union (EAEU). The arrangements developed step by step, and have had their specific evolution from region to region and country. Even the global framework agreement, WTO membership, was delayed or put on hold for priorities assigned to regional FTAs and custom unions, like it was with the WTO application of Kazakhstan and Belarus. On the other hand, WTO membership of Russia was blocked by an incumbent member, Georgia, for four years, as a retaliatory measure for unilateral trade bans of 2006 and 2008 Russian Federation (RF) war against the Caucasian neighbor. In the WB, the arrangements followed roughly identical periods of application, preparation and implementation as a precondition to further development of the relations with EU. YEAR
Membership (EU/EAEU)
Country
WTO
EU FTA/DCFTA
2010
Candidate
Albania
Sep 2000
2000
2015
EAEU
Armenia
June 2005
N/A
1999
PCA
Azerbaijan
Observer
N/A
2014
EAEU
Belarus
Observer
N/A
2008
SAA
Bosnia and Herzegovina
Observer
2000
2013
EU Member
Croatia
Nov 2000
2000
2014
AA
Georgia
Jun 2000
2014
2014
EAEU
Kazakhstan
Nov 2015
N/A
2000
Special UN Status
Kosovo
N/A
N/A
2015
EAEU
Kyrgyzstan
December 1998
N/A
2005
Candidate
Macedonia
Apr 2003
2000
2014
AA
Moldova
Jun 2005
2014
2005
Candidate
Montenegro
Apr 2012
2000
2014
EAEU
Russia
Aug 2012
N/A
2005
Candidate
Serbia
Observer
2000
2006
Candidate
Turkey
Mar 1995
1995
2015
AA
Ukraine
May 2008
2016
Source: EU, WTO, EAEU
8
*Note: During the period analyzed by this report Kosovo had no SAA with the EU; the process of its negotiation started on May 17, 2016.3
The table above shows the membership in trade arrangements, their center of trade and economic gravity (and membership, in the EU and/or EAEU) and the times they entered into force. It does not mention CEFTA membership of WB countries, which was one of the most synchronized tradearrangements for those countries enforced in 2007.
BALKAN FTA BACKGROUND Political Initiatives The evolution of WB trade facilitation efforts started almost immediately upon signing the Dayton Agreement (Paris, mid-December 1995) that put an end to Ex-Yugoslav wars. In 1996, the Southeast European Cooperative Initiative (SECI) attempted a modern version of a Marshal Plan for the Balkans. The principle intention was to bring into mutual cooperation all countries of the Balkans, not only WB: Albania, Bosnia and Herzegovina, Bulgaria, Macedonia, Greece, Hungary, Moldova, Romania, Turkey, Yugoslavia, Croatia and Slovenia. For different reasons, however, Yugoslavia (then Serbia and Montenegro), Croatia and Slovenia membership was either revoked or delayed for three years. By then the Kosovo War (February 1998 – June 1999) was underway, ended by NATO involvement between March and June 1999. After 2000, the political orientation of WB Countries had passed through a major change. Bulgaria and Romania have become EU members in 2007, Croatia joined the Union in 2013. Montenegro started its EU membership negotiations in June 2012; Macedonia, Montenegro and Serbia are EU candidates; due to opposition to the recognition of Kosovo’s independence (declared in 2008) it has special international status. Trade facilitation framework and FTAs developed in close connection to this process. By 2000, SECI evolved into an upgraded initiative, the Stability Pact (SP) for SEE. The period was not wasted. The first outcome of SECI was the spirit of cooperation: SECI and the SP mobilized many neighboring East European countries and leading democracies to become ST observers: Russia, Belarus and Armenia were not interested in the process, but European (Austria, Belgium, France, Germany, Italy, Spain and UK) and non-European states (Canada, Japan and USA) were; they got involved and had a key role in creating the necessary political climate for the future FTAs. Additionally, other trade related initiatives emerged from SECI and SP: South-East European Cooperation Process, Black Sea Economic Co-operation, Trade and Transport Facilitation in Southeast Europe (TTF-SEE) Program of the World Bank, and Regional Cooperation Council, which linked the Region to CEFTA and the Central European Initiative. An important political aspect of the SP was that it set WB trade facilitation and economic cooperation as a de facto condition for signing Stabilization and Association Agreements (SAA) with the EU. With signing a SAA, a country “commits itself to continue to foster cooperation and good neighborly relations with the other countries of the region, including an appropriate level of mutual concessions concerning
3
See: Johannes Hahn, Commissioner for European Neighborhood Policy & Enlargement Negotiations at the High level conference on EU-Kosovo Stabilization Association Agreement, 17 May 2016 Speech at High Level Conference of EU-Kosovo SAA, at: http://eeas.europa.eu/delegations/kosovo/press_corner/all_news/news/2016/20160517_03_en.htm. 9
the movement of persons, goods, capital and services as well as the development of projects of common interest…” The FTAs matters are part of the SAAs: they enclose seven annexes dealing with EU and WB mutual concessions in industrial and agriculture goods, fishery products, financial services and intellectual, industrial and commercial property rights. Last but not least, SECI and SP set a platform for individuals, think tanks and academia to advocate Balkan and pan-European trade facilitation with the WB, created the vision of how this could be achieved and built personal networks of entrepreneurs, business associations and politicians to move their free trade ideas forward. Without going into details, here are some examples of these networks’ contribution to WB trade facilitation.4 -
-
-
Prof. Patrick Messerlin, currently a Director of the Groupe d’Economie Mondiale at Sciences Po (in Paris), was first invited to SECI and SP by think tank but become Trade Advisor to SP and designed a sample FTA for the member-countries that was applied (with some modifications) by all WB countries. TTF-SEE principles were first proposed by Balkan free-market think tanks and chambers of commerce and then picked up and progressed further by the World Bank, the governments of the participating countries5 and of the US, EU, the Netherlands, France, and Austria. It focused on reducing non-tariff costs of trade and transport, application of EU-compatible customs standards, and strengthening and modernization of customs and border control administrations. The overall approach of the EU in regards to trade with the WB was outlined by three individuals who worked with these networks on behalf of LSE and WIIW (the Vienna Institute for International Economic Studies) in 1999.
In a 1999 paper, widely disseminated and promoted to IFIs, EU institutions and governments, Vladimir Gligorov, Mary Kaldor and Loukas Tsoukalis gave a condensed version of what eventually materialized as the common trade arrangement applicable to all WB countries: “Regional trade liberalization is almost mandated by the Stability Pact. The appropriate arrangement would be some kind of a regional free trade area. A number of countries in the region are already members of CEFTA, which means that the two free trade areas could eventually merge into one. However, the key issue is that of trade liberalization and integration with the EU. Irrespective of the ways in which the process of integration will actually proceed, it should in principle follow the logic of the Europe Agreements extending to cover the so-called sensitive areas too (e.g., agriculture). This means that liberalization of trade between the countries in the Balkans and the EU should be asymmetric in favor of the former; in other words, EU markets should be opened up more quickly to imports from the Balkan countries. The added protection of the economies in the Balkans should as a rule not extend over more than the medium term and should be designed in such a way as to minimize special protection and rent-seeking in general. Given these goals and instruments of trade policy, it is to be understood that the main aims of trade policy are allocational and developmental, not fiscal”.6
4
One of the authors of this Report, Krassen Stanchev, and SEGURA’s Chief of Party for the Regional Economic Growth (REG) Project, Filip Stojanovic, were among the initiators and participants of the networks, in SECI and SP. 5 Albania, Bosnia and Herzegovina, Bulgaria, Croatia, the Macedonia, and Romania; and Moldova and Serbia and Montenegro which joined in 2003. 6 Vladimir Gligorov, Mary Kaldor and Loukas Tsoukalis, Balkan Reconstruction and European Integration, LSE, WIIW, October 1999, at: http://eprints.lse.ac.uk/3319/1/Balkan_Reconstruction_and_European_Integration.pdf 10
The SP retained the core membership of SECI countries. One country, Ukraine, has become an observer, the former observing countries have committed themselves as supporting partners. Canada, Japan and USA were joined by Turkey (as a SECI member), Russia (previously outside the process), Norway, Switzerland, and all EU member states (Greece included). OECD, EBRD, Black Sea Bank, UN and World Bank Group organizations also become supporting partners. In 2008, the SP was replaced by the RCC. Trade Policy Instruments EU Unilateral Liberalization The two ground-breaking developments of the Stability Pact were 1) a Memorandum of Understanding on Trade Liberalization and Facilitation that implemented the above mentioned idea of “asymmetric liberalization” and 2) the TTF-SEE program to reduce costs of trade and boost customs’ cooperation. (As we shall see, the SP experience was later replicated in relations between the EU and other countries and regions.) However, the SP was a coordination mechanism for a great variety of international actors not only for trade facilitation but for the evolving regional cooperation in infrastructure, environment, regional electricity markets, welfare and administrative programs, and other initiatives. In 2000, the MoU granted countries of the WB autonomous trade preferences.7 The preferences themselves were designed and introduced first in 2001, and then subsequently renewed in 2005, 2011 and 2015. (With the negotiation and signing of the SAA, MoU liberalization agreements were reinstated as clauses of the SAAs.) The liberalization was altered to include the originally proposed coverage of 100% of the trade volumes. The MoU provided for: (i) Elimination of tariffs on 95.4% of the volume of trade; (ii) Remaining “sensitive areas” of sugar, wine, baby beef and certain fisheries products were handled with preferential tariff quotas; (iii) Gradual elimination of non-tariff barriers to trade for intra-regional trade and the strengthening of trade in services; (iv) Further facilitation intra-regional trade through the implementation of bilateral Free Trade Agreements (FTAs) among the countries (which happened over-time to almost a 100% of the traded volumes). The political transition from the Stability Pact to a regionally owned cooperation framework had passed through different stages. With regard to trade facilitation means the most important were the so called Thessaloniki Declaration (June 2003) and the Zagreb summit (May 2007) of the South East European Cooperation Process (SEECP).
The contribution of the Thessaloniki Declaration was to (1) ensure that FTA negotiations were completed on time, involving IFIs and the European Investment Bank (EIB) in non-trade development programs, and (2) declare that all cooperation initiatives were guided by the
7
Depending of the context, the terms of “unilateral”, “asymmetric” trade liberalization are of economic nature. Legally, the EU regulates “exceptional trade measures for countries and territories participating in or linked to the European Union’s Stabilization and Association process”. The term “exceptional trade measures” are instrumentalized via asymmetric trade preferences (ATPs), while the reference to EU S&A process puts the trade liberalization into, depending on the status of the country, a political association and/or (hopeful) enlargement context. 11
prospect of EU integration and membership (under the framework Stabilization and Association Process).8 The Zagreb Summit sought to (1) encourage implementation of CEFTA agreements and (2) “to ensure a smooth transfer of activities from the Stability Pact [to SEECP] by early 2008” and the creation of RCC. The summit also reintroduced cooperation initiatives in non-trade but still very important areas of energy, transport, environmental protection, justice, freedom and security and disaster prevention.
The FTAs in the Balkans The idea of one standard FTA signed by all countries was dropped out. So, the FTAs were to be concluded on bi-lateral basis, the deadline was set – by the end of the first half of 2006. The procedure took three years, from 2002 (when most FTAs were negotiated) to 2004 (when most of them were enforced). The original seven countries (Albania, Bosnia Herzegovina, Bulgaria, Croatia, Macedonia, Romania, Serbia & Montenegro) concluded 21 FTAs; some FTAs had already been in place, some (e.g. Kosovo, signed by UNMIK) were concluded by 2006, and by approximately the same year or later some countries (Bulgaria and Romania, and later, in 2013, Croatia) became part of the EU economic space. Altogether, there are 31 FTAs. The core features of the individual FTAs are identical, namely:
They were WTO compatible; All existing FTAs were to be retained; All countries will eventually become members of CEFTA; All quantitative restrictions and measures having equivalent effect must be abolished upon entry into force; Import duties were to be eliminated on 90% of the signatories’ mutual trade with a double criterion to measure it: 90% of the tariff lines of each signatory party and 90% of its trade value; Liberalization should be applied to a large majority of goods upon entry into force of the agreement, with a transitional period for the most sensitive products that should not exceed six years.
CEFTA Agreement with WB In December 2006 the WB countries, acting as group reached an agreement to join CEFTA 2006. By the summer and autumn of the next year all legislatures ratified the agreement, thus WB enlarged CEFTA, which by then was somewhat obsolete since the original members had already joined the EU in 2004 and 2007. For B&H and Serbia (WTO observers) CEFTA applies WTO rules and procedures and EU regulations (as other FTAs and the MoU have done). CEFTA also includes procedures for dispute settlement and help for the EU-Western Balkan countries zone of diagonal accumulation of origin. In a sense, CEFTA provided the opportunity for a specific EU ante-chamber trade agreement applicable only to members – after 2007: WB countries plus Moldova. Taking into account the fact that Moldova trade with CEFTA is about 1% of the total internal trade of the members, CEFTA shall be interpreted basically as a Western Balkan FTA.
8
See point 8 and 9 of the Declaration, at: http://www.consilium.europa.eu/ueDocs/cms_Data/docs/pressdata/en/misc/76291.pdf 12
REGIONAL TRADE FACILITATION IN THE BALKANS (THE 2000’S) FIRST RESULTS OF THE FTAS Trade Openness In order to comprehend the significance of MoU and the FTAs, we should take into account the situation before 2000. Before 2000, Balkan economies were relatively closed if measure as trade shares in GDP. Country
Trade Openness (Import + Export, as % of GDP in 1999)
Albania B&H Bulgaria Croatia FR Yugoslavia Macedonia Romania
32 76 91 60 29 87 56
Source: IMF trade statistics, KC2 calculations
The FR of Yugoslavia (then Serbia and Montenegro) was three times more closed than Bulgaria and two times less open that Romania and Croatia. The trade openness of Bosnia and Herzegovina and Macedonia was a reaction to embargoes (by Greece on Macedonia in 1992-1995) and the Bosnia war. Tariff regimes of Romania, Albania, Bulgaria, FR Yugoslavia and Macedonia in 1999 were relatively restrictive. For comparison, the average nominal import tariff of the Czech Republic, Slovakia and Hungary in 1999 was about 10%, while Croatia seemed closer to Central European pattern, rather than to that of the Balkans. 1999 Country Nominal Average Import Tariff (%) Albania 15.9 B&H 7-8 Bulgaria 15.2 Croatia 12 Macedonia 15 Romania 19.8 FR Yugoslavia 20.4 Source: IMF trade statistics, KC2 calculations
By 2004, when the first review of the Balkan FTAs was compiled by Patrick A. Messerlin and Sébastien Miroudot, the implementation of the MoU seemed to be a success in terms of scope and timing:
15 FTAs out of 23 are above the 90% target or very close to the threshold of liberalization; 9 FTAs are clearly above the 90% target; 6 of them record a full liberalization of both tariff lines and mutual trade of 100% or close to 100%; The lowest coverage observed is 84.9% and typical results tend to be between 87 and 89%; 13
Every country has liberalized more than 98% of its industrial goods; de facto free trade area in industrial products among SEE countries has been established by the early 2004; With an almost complete liberalization in the manufacturing sector, only 35% of the agricultural Harmonized System classification lines needed to be freed in order to reach the 90% MoU target.9
In terms of tariff barriers, the MoU had actually forced the countries to liberalize to or be better than the level of Central European Countries of the 1999 (10-11%), and this was done in a relatively short period of time. Macroeconomic Conditions Before Trade Liberalization On a more general level, trade liberalization and integration has become a factor for economic development and catching up with more advanced transition countries. Economic Development of Selected SEE and CE Countries (GDP per capita 1990-2000) GDP Growth (in %) Albania Bulgaria Croatia Macedonia Romania FR Yugoslavia Czech Republic Hungary Poland Slovak Republic
1990
1991
1992
1993
1994
1995
1996
1997
1998
1999
2000
Index (1989=100%)
-10 -9.1 -7.1 -10.2 -5.6 -7.9
-28 -11.7 -21.1 -3.2 -12.9 -11.6
-7.2 -7.3 -11.1 -6.6 -8.8 -27.4
9.6 -1.5 -8 -7.5 1.5 -29.6
8.3 1.8 5.9 -1.8 3.9 8.5
13.3 2.9 6.8 -1.1 7.1 7.0
9.1 -10.1 5.9 1.2 3.9 7.8
-7 -7 6.8 1.4 -6.1 10.1
8 3.5 2.5 2.9 -5.4 1.9
8 2.4 -0.3 2.7 -3.2 -18.3
6.5 5.8 3.8 5.1 1.6 7
101.9 71.9 81.3 83.1 76.8 51.1
-1.2
-11.6
-1.1
0
2.2
5.9
4.8
-1.0
-2.2
-0.8
2.7
96.6
-3.5 -11.6
-11.9 -7
-3 2.6
-0.6 3.8
2.9 5.2
1.5 7.0
1.3 6
4.6 6.8
4.9 4.8
4.4 4.1
5.5 4
104.8 126.6
-2.5
-14.6
-6
-3.5
4.9
6.7
6.2
6.2
4.1
1.9
2
103.2
Source: WIIW database, KC2 calculations.
In the 1990s, of the WB countries only Albania registered remarkable growth, comparable only to China and India’s economic growth after 1992. At the same time due to the wars, FR Yugoslavia registered an unprecedented in any post-Communist country decline of GDP. The table demonstrates that reforms and macro-developments were successful for early reformers (CEC) and countries not involved in wars, except for Bulgaria. In 1995-1997 it suffered from political setbacks as well as attempts to return the country to the ways of the central planning. As a result of war and internal conflicts, WB economies remained at a GDP 20% less than 1989 GDP per capita for ten years, while CEC countries improved beyond their pre-transition levels of GDP per capita in 1997-1998. Booming Trade with the EU (2005-2015) The unilateral trade liberalization and the reciprocal trade policy measures on behalf of the WB countries set by the MoU and FTAs have boosted the trade with the EU. Overall, the combined exports
9
All findings are from: Patrick A. Messerlin, Sébastien Miroudot, Trade Liberalization in South East Europe: Review of conformity of 23 FTAs with the MoU, Paris, Science Po, Groupe d’economie mondiale, January 2004. 14
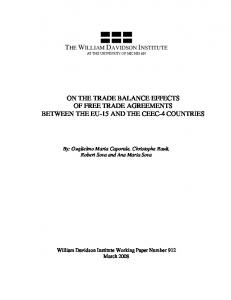
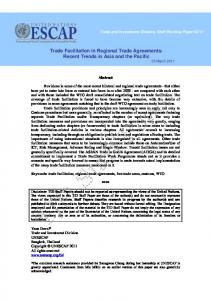
to the EU had grown by a factor of three, and imports from the EU – by about 2.5 times. The business cycle seems to have been normalized, becoming dependent on global, domestic and EU recession periods. Whenever statistics allow for correlations with exports, macroeconomic factors are analyzed in the country profiles. The following tables, compiled with help of WITS, show the EU trade goods dynamics of the WB. Services are analyzed in the RCA section. WB Trade with EU – Volumes of Goods Trade (in EUR mln) and Dynamics (% change) WB Export to EU Growth % WB Import to EU Growth %
2005
2006
2007
2008
2009
2010
2011
2012
2013
2014
2015
4541
7337
7337
9821
7590
9919
11690
11693
13765
15041
16193
N/A
61.4%
27.4%
5.1%
-22.7%
30.7%
17.9%
0%
17.7%
9.3%
7.7%
10031
14080
18345
21423
16617
18198
20755
21911
22065
23372
24549
40.4%
30.3%
16.8%
22.4%
9.5%
14.1%
5.6%
0.9%
5.9%
5%
Source: European Union, Trade in goods with Western Balkans, EU DG Trade: 29 April 2016.
The following two graphs show that both directions of trade have a parallel history, with a steady trend of export improvement. The gap between exports and imports narrowed after 2009 and the dynamics are almost parallel, but still narrowing.
This trend is better visible in the rates of export growth.
15
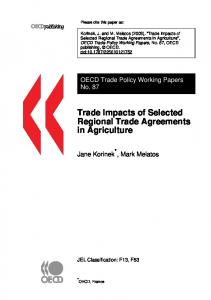
RCA ANALYSIS OF WB (EXCLUDING KOSOVO) Unfortunately, we cannot include Kosovo in the revealed comparative advantages since its status with UN and WTO does not allow for the use of mirrored statistics of TradeMap, which is compensated for with a more detailed analysis of the country’s profile. Albania In 2014 and 2015, Albania’s economy accelerated its growth to 2% and 2.6% respectively, fueled by the public consumption and gross fixed capital formation. In 2014, exports plummeted by 17.5% and remained at the same level in 201510. Measured in US dollars in current prices, the amount of exported goods and services reached USD 5.1 bln. in 2014 which was 38% of GDP (better performance than before liberalization). The development of Albania’s exports in US dollars shows a clear upward trend since 2005. The amount of the exported goods and services increased by more than 2.5 times. The main merchandise that Albania exports are mineral fuels, oils and distillation products (12% of total exports in 2014), apparel (7.6%), footwear (8%), iron and steel (3.9%). In services, the largest portion of revenues are generated by travel (33% of total exports), transport (6.7%), manufacturing services on physical inputs owned by others (6.2%), and information and telecommunication services (3.2%). Overall, export of services has dominated over the export of goods, but the share of the former in total exports decreased from 65.8% in 2005 to 52.6% in 2014. Albania has been a member of the WTO since 2000. Its rank in world exports in 2014 is 129th in terms of merchandise trade and 96th in terms of commercial services.11 The average tariff for all goods in 2014 is 3.8% - one of the lowest in the region, including agricultural goods (7.7%) and nonagricultural goods (3.1%). In 2014, merchandise exports accounted for USD 2.43 bln, while commercial services exports reached USD 2.66 bln. The main importers of Albania’s merchandise are the EU – 28 (77.4%), Serbia (8%), Turkey (3.9%), China (3.4%), and Macedonia (2.1%).
10
See: European Commission, European Economic Forecast Spring 2016, European Economy Institutional Paper 025, May 2016. 11 According to WTO, Trade Profiles 2015, available online at: https://www.wto.org/english/res_e/booksp_e/trade_profiles15_e.pdf 16
Albania’s Export of Goods and Services (USD bln)
Source: www.trademap.org and KC2 Ltd calculations.
Export Related RCA: Albania Albania’s comparative advantage is in unskilled labor-intensive commodities including articles of apparel and accessories and footwear, gaiters and the like. The values of indexes of RCA range between 322 for apparel and 1351 for footwear. These items account for 15.6% of Albania’s exports of goods and services. Among primary metals, Albania exports iron, steel, aluminum, lead and materials thereof and miscellaneous base metals where it has transportation cost advantages, owing to the use of sea routes to import resources. Iron and steel have more a significant share of exports of 3.9% in 2014, while the share of aluminum and lead and articles is about 1% of total exports. The RCA varies between 120 and 227. Other physical capital-intensive goods in which comparative advantage is “revealed” are paper and paperboard, articles of pulp, paper and board which increased their rating during the period 2011-2014 reaching 167 in 2014. Natural resources dependent materials like salt, sulphur, earth, stone, plaster, lime and cement posted continuous growth of exports for the whole period between 2005 and 2014. Its RCA index ranged between 62 in 2005 and 827 in 2014, while its share in overall Albania’s exports increased from 0.1% in 2005 to 1.6% in 2014. Comparative advantages can also be seen in ores, slag and ash (RCA index 244 in 2014 despite the decrease compared to 2013. As it was pointed out, mineral fuels, oils, distillation products are one of Albania’s main export items. In fact, there was a comparative advantage (index of 109) only in 2013, while in the preceding years it was much lower, and in 2014 it was 94. Other natural resource intensive products like edible vegetables and certain roots and tubers, oil seed oleagic fruits, grain, seeds and meat, fish and seafood food preparations also reveal comparative advantages. Its indices range between 150 and 291 in 2014. In terms of services, the RCA is the most clearly pronounced in manufacturing services on physical inputs owned by others with an index of 1899 in 2014. Transport, travel, information/ telecommunication services, personal, cultural and recreational services have indexes exceeding 100. While the manufacturing services rely mainly on unskilled labor, the other products depend on natural resources (travel services), but also on human capital and high technologies.
17
The share of high tech products remains almost unchanged, while the share of travel services decreased by 25 percent between 2005 and 2014. However, the index of travel was 663 in 2014 and the index of transport was 185, while the RCA index of IT products was 202. Albania’s Top 10 of ERCA In 2005-2014, the structure of exports changed towards more merchandise exports on the account of services export. The relative advantage in transport was used to increase the share of more physical capital-intensive goods. The share of tourism decreased but because of its growth rate was lower than the average growth of exports. Overall, the exports of Albania are still dominated by either unskilled labor intensive goods or by natural resource intensive products. The table below exposes the top ten lead export sectors. Sector Manufacturing services on physical inputs owned by others Footwear, gaiters and the like, parts thereof Salt, sulphur, earth, stone, plaster, lime and cement Travel Articles of apparel, accessories, not knit or crochet Miscellaneous articles of base metal Raw hides and skins (other than furskins) and leather Articles of apparel, accessories, knit or crochet Lead and articles thereof Meat, fish and seafood food preparations
ERCA Score 1899 1351 827 663 452 364 337 322 320 291
Source: KC2 Ltd calculations based on www.trademap.org
Bosnia and Herzegovina In 2014 and 2015, Bosnia and Herzegovina’s economy posted a GDP growth rate of 1.4% and 2.9% respectively, led by the growth of value added in agriculture, forestry and fishing and professional, scientific and technical activities.12 After a decline of exports of goods and services in 2012, in 2013 and 2014 it recovered to 2012 levels. Measured in current US dollars the amount of exported products reached USD 7.7 bln in 2014, which was 63.6% of GDP, indicating the openness of the B&H’s economy. Overall, during the period between 2005 and 2014 the export-to-GDP ratio increased from 46.1% to 63.6%. The trade is facilitated by the Currency Board Arrangement and the fixed exchange rate regime (introduced in August 1997), which eliminates exchange rate risks.
12
According to the Institute for B&H Statistics data. 18
Bosnia and Herzegovina’s Exports of Goods and Services (Volumes and % of GDP)
Source: www.trademap.org, B&H Institute for Statistics and KC2 Ltd calculations.
The development of Bosnia and Herzegovina’s exports during the studied period, registered a steady upward trend but with ups and downs evident from the graph above. Still, the amount of exported goods and services rose by more than 2.2 times. The main merchandise products that B&H exported in 2014; furniture, lighting, signs, prefabricated buildings (USD 548 mln), wood and articles of wood (USD 372.8 mln), mineral fuels, oils, distillation products (USD 357.6 mln), footwear, gaiters and the like (USD 353.8 mln), machinery, nuclear reactors, boilers (USD 337.2 mln), aluminum and articles thereof (USD 322 mln), inorganic chemicals, precious metal compound, isotopes (USD 267.9 mln), iron and steel (USD 265.2 mln), electrical, electronic equipment (USD 236.6 million), articles of iron and steel (USD 214.2 mln). In services, the largest portion of revenues generated by travel (USD 707.1 mln), manufacturing services on physical inputs owned by others (USD 541.3 mln), and transport (USD 345.1 mln). Overall, the export of goods has dominated over the export of services and the former has increased its share in total exports by 6 percent between 2005 and 2014 (reaching 76.7% in 2014). Bosnia and Herzegovina has observer status with the WTO. Its rank in world exports in 2014 is 105th in terms of merchandise trade and 108th in commercial services.13 The average tariff for all goods in 2014 is 6.4%, including agricultural goods (9.9%) and non-agricultural goods (5.9%). In 2014, merchandise exports accounted for USD 5.89 bln, while commercial services exports reached USD 1.79 bln. The main importers of B&H merchandise are the EU – 28 (72.1%), Serbia (9.2%), Montenegro (3.4%), Turkey (2.6%), Switzerland (1.7%). B&H Export RCA As an emerging economy with relatively cheap labor compared to the EU average, B&H has a certain comparative advantage in unskilled labor-intensive commodities including articles of apparel, accessories, not knit or crochet (XRCA 215 in 2014), footwear, gaiters etc. (XRCA 980 in 2014), umbrellas, walking sticks, seat-sticks, whips (XRCA 586), furniture, lighting, signs, and
13
According to World Trade Organization, Trade Profiles 2015, available online at: https://www.wto.org/english/res_e/booksp_e/trade_profiles15_e.pdf 19
prefabricated buildings (XRCA 793). These items account for 16.1% of B&H exports of goods and services in 2014. In metals and metal products B&H has a comparative advantage in iron and steel (XRCA 292), articles of iron and steel (XRRCA 246), aluminum and articles thereof (XRCA 689), lead and articles thereof (XRCA 164), zinc and articles thereof (XRCA 254), as well as miscellaneous articles of base metals (XRCA 188). This development is dependent on geographical proximity of B&H to the seaside, despite the fact that the country has a limited outlet to the sea on its own territory. Other physical capital intensive and unskilled labor intensive goods in which with a comparative advantage are inorganic chemicals, precious metal compounds, isotopes (XRCA 684), explosives, pyrotechnics, matches, pyrophoric (XRCA 591), wood and articles of wood XRCA 945), manufactures of plaiting material, basketwork (XRCA 402), paper and paperboard, articles of pulp, paper and board (XRCA 232), arms and ammunition, parts and accessories thereof (XRCA 1440). RCA is demonstrated in salt, sulphur, earth, stone, plaster, lime and cement (XRCA 260), articles of leather, animal gut, harness, travel goods (XRCA 114), stone, plaster, cement, asbestos, and mica (XRCA 142). These products are dependent on natural resources and their relative importance in B&H exports decreased during the period of consideration. Food and related products which revealed comparative advantages are dairy products, eggs, honey (XRCA 136), edible fruit, nuts, peel of citrus fruit, melons (XRCA 126), animal, vegetable fats and oils, cleavage products (XRCA 196), meat, fish and seafood (XRCA 147), sugars and sugar confectionery (XRCA 155), cereal, flour, starch, milk preparations and products (XRCA 172). Positive development has been made in fur skins and artificial fur (XRCA 101), printed books, newspapers, pictures (XRCA 112), manmade staple fibers (XRCA 104), zinc and articled thereof (XRCA 254). On the other hand, ores, slag and ash (XRCA 406 in 2005 and 50 in 2014), fruit, nut etc. food preparations (XRCA 149 in 2005, XRCA 60 in 2014), tools, implements, cutlery of base metal (XRCA 131 in 2005, XRCA 71 in 2014) show a significant drop on the comparative advantage index. In terms of services, the XRCA is the most clearly evident in manufacturing services on physical inputs owned by others with an index of 2149 in 2014. Transport (XRCA 124), travel (XRCA 184), and construction (XRCA 257) have indices exceeding 100. While the manufacturing services rely mainly on unskilled labor, other products depend on natural resources (travel services), but also on human capital. Negative development has occurred in telecommunication, computer and information services where XRCA decreased from 423 in 2005 to 71 in 2014, and in construction where the XRCA is still evident while the index plummeted from 1670 in 2005 to 257 in 2014. Overall, the relative significance of services in B&H’s exports declined and the share of high technology products dropped.
Bosnia and Herzegovina’s Top 10 of ERCA During the period under consideration, the structure of exports changed towards more merchandise exports on account of the export of services. The relative advantage in transport was used to increase the share of more physical capital-intensive goods. Despite the increased revenues from travel and tourism its share decreased because its growth rate was lower than the average growth of exports. Overall, the exports of B&H are still dominated by either unskilled labor intensive goods or by natural resource intensive products.
20
Sectors Manufacturing services on physical inputs owned by others Arms and ammunition, parts and accessories thereof Footwear, gaiters and the like, parts thereof Wood and articles of wood, wood charcoal Furniture, lighting, signs, prefabricated buildings Aluminum and articles thereof Inorganic chemicals, precious metal compound, isotopes Explosives, pyrotechnics, matches, pyrophorics, etc Umbrellas, walking-sticks, seat-sticks, whips, etc Raw hides and skins (other than furskins) and leather
ERCA Score 2149 1440 980 945 793 689 684 591 586 580
Source: KC2 Ltd. calculations based on www.trademap.org
Former Yugoslav Republic of Macedonia In 2014 and 2015 Macedonia’s economy registered a GDP growth rate of 3.5% and 3.7% respectively14, driven by stronger domestic demand. In 2014, the exports of goods and services performed well with growth of 18.2% on annual basis and continued its acceleration since 2011. However, the contribution of the net exports to the economic growth was still negative. The amount of exported products reached USD 6.6 billion in 2014, which was 58.5% of GDP, indicating the relatively high openness of Macedonia’s economy, which, is considerably lower on the openness index compared to the period during the Greek embargo of 1992-1995. During the period between 2005 and 2014 the export-to-GDP ratio increased from 43.6% to 58.5%. External trade was facilitated by the almost unchanged exchange rate between the denar (the national currency) and the euro. The development of Macedonia’s exports during the period under consideration showed an upward trend but remained uneven, which can be seen in Figure 3. The amount of exported goods and services increased by more than 2.4 times. The main merchandise goods that Macedonia exports are miscellaneous chemical products (USD 864.4 million in 2014), machinery, nuclear reactors, boilers (USD 516.8 million), iron and steel (USD 510.4 million), electrical, electronic equipment (USD 450.4 million), articles of apparel, accessories, not knit or crochet (USD 417.1 million). These items represent 44.5% of total exports in 2014. In terms of services, the largest part of revenues is generated by manufacturing services on physical inputs owned by others (USD 443.6 million), travel (USD 294.7 million), transport (USD 386.9 million), and other business services (USD 222.1 million). These items represent 20.3% of total exports in 2014. Overall, export of goods has dominated over export of services, as the former accounts for about ¾ of total export revenues.
14
See: European Commission, European Economic Forecast Spring 2016, European Economy Institutional Paper 025, May 2016. 21
FYR Macedonia’s Exports of Goods and Services (Volumes and % of GDP)
Source: www.trademap.org, Eurostat and KC2 Ltd calculations.
Macedonia has been a member of the WTO since 2003. Its rank in world export in 2014 was 112th in terms of merchandise trade and 110th in terms of commercial services.15 The average tariff for all goods in 2014 was 6.9%, including agricultural goods (13%) and non-agricultural goods (5.9%). In 2014, merchandise exports accounted for USD 4.9 bln, while commercial services exports reached USD 1.69 bln. The main importers of FYROM merchandise are the EU – 28 (76.6%), Serbia (9.9%), Bosnia and Herzegovina (1.9%), China (1.9%), and Albania (1.5%). Macedonia Export RCA Macedonia is the only WB country, which has been analyzed by the RCA and international financial institutions.16 Similarly, to the other economies in this study, Macedonia could be characterized by significantly lower labor costs compared to the EU average which determine it has a comparative advantage in unskilled labor intensive products. These include articles of apparel, accessories, knit or crochet (XRCA 215), articles of apparel, accessories, not knit or crochet (XRCA 807), other textile articles, sets, worn clothing (XRCA 169), footwear, gaiters etc. (XRCA 189), furniture, lighting, signs, prefabricated buildings (XRCA 148). These items account for 13.1% of total export of goods and services in 2014. In terms of metals and metal products FYROM has revealed a comparative advantage in iron and steel (XRCA 572) and articles of iron and steel (XRCA 163). Competitiveness in production of these goods depends on cheap labor and on advantages in transport which are available due to Macedonia’s access to the sea. Other physical capital intensive goods with a comparative advantage are miscellaneous chemical products (XRCA 1628), railway, tramway locomotives, rolling stock, and equipment (XRCA 154).
15
See WTO, Trade Profiles 2015, available online at: https://www.wto.org/english/res_e/booksp_e/trade_profiles15_e.pdf 16 See: IMF: FYROM, Hua Chai, Shan Chen, Marc Gerard, Patrick Gitton, Duncan Last and Jubum Na Selected Issues Paper, August 2015. 22
RCA is visible in salt, sulphur, earth, stone, plaster, lime and cement (XRCA 308), ores, slag and ash (XRCA 277), stone, plaster, cement, asbestos, mica (XRCA 132), ceramic products (XRCA 105). These products are dependent on natural resources and their relative importance in Macedonia’s exports decreased during the period under consideration. Food and related products for which a RCA was detected are edible vegetables and certain roots and tubers (XRCA 490), edible fruit, nuts, peel of citrus fruit, melons (XRCA 212), meat, fish, seafood food preparations (XRCA 159), cereal, flour, starch, milk preparations and products (XRCA 366), vegetable, fruit, nut preparations (XRCA 318), miscellaneous edible preparations (XRCA 125), beverages, spirits and vinegar (XRCA 249), tobacco and manufactured tobacco substitutes (XRCA 1148). These items account for 8.3% of total exports of goods and services in 2014. Positive development (increase of XRCA index) was registered in miscellaneous chemical products (XRCA 24 in 2005, XRCA 1628 in 2014), furniture, lighting, signs, prefabricated buildings (XRCA 46 in 2005, XRCA 148 in 2014). These are products that require investment in physical capital but do not require use of high tech and generate high value added. On the other hand, meat and edible meat offal (XRCA 122 in 2005, XRCA 52 in 2014), live trees, plants, bulbs, roots, cut flowers (XRCA 131 in 2005, XRCA 94 in 2014), sugars and sugar confectionery (XRCA 175 in 2005, XRCA 80 in 2014), cocoa and cocoa preparations (XRCA 139 in 2005, XRCA 85 in 2014), tanning, dyeing, extracts, tannins, pigments (XRCA 108 in 2005, XRCA 60 in 2014), explosives, pyrotechnics, matches, pyrophorics (XRCA 120 in 2005, XRCA 14 in 2014) posted significant declines in the RCA index. In terms of services, the XRCA in 2014 is the most clearly pronounced in manufacturing services on physical inputs owned by others (XRCA 2040) and construction (XRCA 521). Personal, cultural, and recreational services (XRCA 280), transport (XRCA 161) and telecommunication, computer, and information services (XRCA 153) also register revealed comparative advantage. Negative development was observed in other business services (XRCA 108 in 2005, XRCA 81 in 2014), while there has been considerable improvement in personal, cultural, and recreational services (XRCA 197 in 2005, XRCA 280 in 2014). Overall, services keep their share of about ¼ of total exports of Macedonia. Production requires not only the use of natural resources but also of high technologies and skilled labor.
FYR Macedonia’s Top 10 of Export Revealed Comparative Advantage During the period of RCA analysis, the structure of exports remained almost the same in terms of goods and services but the three lead XRCA sectors indicate a move towards higher value added sectors. Despite the relative advantage in transport and availability of natural resources, travel does not reveal a comparative advantage. Overall the exports of Macedonia are still dominated by unskilled labor intensive products, despite the development of high tech products. Similarly, the IMF found in August 2015 that “Overall, the country’s main comparative advantages remain in the production of intermediate and consumer goods.” The IMF analysis covers a longer period – from 2005 to 2014. Its conclusions are: 1. “More recently, RCA has diversified away from traditional product lines to more capital intensive goods.”
23
2. “While remaining highly competitive in the production of textiles, beverages, tobacco, and food products, the country managed to dramatically push its advantage in chemical products.”17 Sectors Manufacturing services on physical inputs owned by others Miscellaneous chemical products Tobacco and manufactured tobacco substitutes Articles of apparel, accessories, not knit or crochet Iron and steel Construction Edible vegetables and certain roots and tubers Cereal, flour, starch, milk preparations and products Vegetable, fruit, nut, etc., food preparations Salt, sulphur, earth, stone, plaster, lime and cement
XRCA Score 2040 1628 1148 807 572 521 490 366 318 308
Source: KC2 Ltd. calculations based on www.trademap.org
Montenegro In 2014 and 2015 Montenegro’s economy registered a GDP growth rate of 1.8% and 3.2% respectively18, fueled by domestic demand. In 2014, exports of goods and services shrank by 0.7% but in 2015 it increased by 10.5%. However, the contribution of the net exports to the economic growth was still negative. The amount of exported products reached USD 1.8 billion in 2014, which was 39.5% of GDP, indicating the level of openness of Montenegro’s economy. Montenegro’s exports during the period between 2007 and 201419 showed stable performance without significant swings. The amount of exports in 2014 increased by only 16% in USD terms compared to 2007. The main merchandise that Montenegro exports in 2014 are aluminum and articles thereof (USD 98.7 mln), mineral fuels, oils, distillation products (USD 64.1 mln), meat and edible meat offal (USD 55 mln). These items represent 12% of total export of goods and services. In terms of services, the largest share of revenues is generated by travel (USD 907.7 mln), transport (USD 234.3 mln), other business services (USD 63.9 mln), and construction (USD 63.7 mln). They account for 70.2% of total export. Overall, export of services has dominated over export of goods, as the former accounts for about ¾ of total export revenues. Montenegro has been a member of the WTO since 2012. Its rank in world export in 2014 is 169th in terms of merchandise trade and 119th in terms of commercial services. 20 The average tariff for all goods in 2014 was 4.1%, including agricultural goods (10.1%) and non-agricultural goods (3.1%).
17
IMF, op. cit. p. 6. See: European Commission, European Economic Forecast Spring 2016, European Economy Institutional Paper 025, May 2016. 19 Because of the lack of data, the period of the study for Montenegro is shorter than for the other countries in this report. 18
24
In 2014, merchandise exports reached USD 446 million, while commercial services exports were USD 1.37 bln. The main importers of Montenegro’s goods are the European Union – 28 (35.8%), Serbia (24%), Belarus (9.9%), Bosnia and Herzegovina (9.6%), and Albania (4.6%). Montenegro’s Exports of Goods and Services (USD billion)
Source: www.trademap.org and KC2 Ltd calculations.
Export RCA of Montenegro In comparison, even within the WB, Montenegro is a small country with population of about 620 thousand persons and limited natural resources. Again, it depends on lower labor cost compared to the EU average. RCA is observed in explosives, pyrotechnics, matches, pyrophorics (XRCA 1312 in 2014), wood and articles of wood, wood charcoal (XRCA 295), arms and ammunition, parts and accessories thereof (XRCA 283), and raw hides and skins (XRCA 239). These items account for 2.6% of total exports of goods and services in 2014. In terms of metals and metal products Montenegro has revealed a comparative advantage only in aluminum and articles thereof (XRCA 742). Food, beverage and related products which revealed comparative advantages are meat and edible meat offal (XRCA 553), edible vegetables and certain roots and tubers (XRCA 111), milling products, malt, starches, inulin, wheat gluten (XRCA 195), meat, fish, seafood food preparations (XRCA 111), cocoa and cocoa preparations (XRCA 131), beverages, spirits and vinegar (XRCA 294), and tobacco and manufactured tobacco substitutes (XRCA 225). These items account for 5.8% of total exports of goods and services. In terms of services, the XRCA in 2014 is evident in travel (XRCA 1002), construction (XRCA 910), personal, cultural, and recreational services (XRCA 894), maintenance and repair services (XRCA 390), transport (XRCA 356), telecommunications, computer, and information services (XRCA 166). These services are human and physical capital intensive products and some of them require use of high technologies and natural resource utilization. Positive development is registered in meat and edible meat offal (XRCA 34 in 2007, XRCA 553 in 2014), milling products, malt, starches, inulin, wheat gluten (XRCA 0 in 2007, XRCA 195 in 2014), cocoa and cocoa preparations (XRCA 4 in 2005, XRCA 131 in 2014), tobacco and manufactured
20
According to WTO, Trade Profiles 2015, available online at: https://www.wto.org/english/res_e/booksp_e/trade_profiles15_e.pdf 25
tobacco substitutes (XRCA 60 in 2007, XRCA 225 in 2014), explosives, pyrotechnics, matches, pyrophorics (XRCA 402 in 2007, XRCA 1312 in 2014), raw hides and skins (XRCA 162 in 2007, XRCA 239 in 2014), wood and articles of wood, wood charcoal (XRCA 234 in 2007, XRCA 295 in 2014), transport (XRCA 180 in 2007, XRCA 356 in 2014), personal, cultural, and recreational services (XRCA 643 in 2007, XRCA 894 in 2014). On the other hand, salt, sulphur, earth, stone, plaster, lime and cement (XRCA 108 in 2007, XRCA 56 in 2014), iron and steel (XRCA 217 in 2007, XRCA 72 in 2014) posted significant declines in the RCA index.
Montenegro’s Top 10 of ERCA One sector drove the XRCA towards services in 2005-2014 Montenegro, thus moving the structure of exports changed towards a domination of services over goods. The share of services in 2007 was 59.8% while in 2014 it was 75.6%. The clear comparative advantage in transport and the fast development of high-tech industries in Montenegro’s economy allowed it to increase its export growth potential based on higher value added services. Sectors Explosives, pyrotechnics, matches, pyrophorics, etc Travel Construction Personal, cultural, and recreational services Aluminum and articles thereof Meat and edible meat offal Maintenance and repair services n.i.e. Transport Wood and articles of wood, wood charcoal Beverages, spirits and vinegar
ERCA Score 1312 1002 910 894 742 553 390 356 295 294
Source: KC2 Ltd. calculations based on www.trademap.org
Serbia After shrinking by 1.8% in 2014 Serbia’s economy registered a GDP growth rate of 0.7% in 2015.21 It was fueled by domestic demand and net exports. Exports of goods and services have been growing for the last four years. In 2014, the amount of exported products reached USD 19.9 billion, which was 45% of the GDP. Overall, during the period between 2007 and 2014 the export-to-GDP ratio increased from 29.7% to 45%. Meanwhile, the dinar depreciated against the euro by 30.6%22, which could also affect the country’s foreign trade.
21
See: European Commission, European Economic Forecast Spring 2016, European Economy Institutional Paper 025, May 2016. 22 KC2 Ltd. calculation based on National Bank of Serbia data. 26
Despite some swings, the development of Serbia’s exports during the period between 2007 and 2014 showed an upward trend, which is evident on country graph below. The amount of exported goods and services increased by almost two-thirds. The main merchandise that Serbia exports are vehicles other than railway, tramway (USD 2,064 mln), electrical, electronic equipment (USD 1 388.8 million), machinery, nuclear reactors, boilers (USD 972.9 mln), plastics and articles thereof (USD 732.3 mln), cereals (USD 485.1 mln), which account for 29% of total exports of goods and services in 2014. In terms of services, the largest share of revenues is generated by transport (USD 1,173.5 mln), travel (USD 1,139.1 mln), other business services (USD 1,118.3 mln), and telecommunication, computer, and information services (USD 644.6 mln). These items represent 20.5% of total exports in 2014. Overall, the export of goods has dominated over the export of services, as the former accounts for about ¾ of total export revenues. Serbia has observer status with the WTO. Its rank in world export in 2014 is 77th in terms of merchandise trade and 75th in terms of commercial services23. The average tariff for all goods in 2014 is 7.4%, including agricultural goods (13.9%) and non-agricultural goods (6.4%). It is three times lower than in 1999, but is still higher than other WB countries. In 2014, merchandise exports reached USD 14.8 billion, while commercial services exports were USD 5 billion. The main importers of Serbia’s products are:
European Union – (64.6%), Bosnia and Herzegovina (8.9%), Russian Federation (6.9%), Montenegro (5.1%), And Macedonia (4.1%).
Serbia’s Exports of Goods and Services (Volume in USD and % of GDP)
Source: www.trademap.org, Statistical Office of the Republic of Serbia, and KC2 Ltd calculations.
Serbia’s Export RCA
23
According to WTO, Trade Profiles 2015, available online at: https://www.wto.org/english/res_e/booksp_e/trade_profiles15_e.pdf 27
Serbia has certain comparative advantages in unskilled labor intensive industries like wood and articles of wood, wood charcoal (XRCA 232), paper and paperboard, articles of pulp, paper and board (XRCA 252), printed books, newspapers, pictures (XRCA 183), wadding, felt, nonwovens, yarns, twine, cordage (XRCA 253), carpets and other textile floor coverings (XRCA 221), articles of apparel, accessories, knit or crochet (XRCA 209), articles of apparel, accessories, not knit or crochet (XRCA 107), footwear, gaiters and the like (XRCA 244), arms and ammunition, parts and accessories thereof (XRCA 586), furniture, lighting, signs, prefabricated buildings (XRCA 167). These items account for 10.6% of total exports in 2014. In terms of metal and metal products, comparative advantages are observed in iron and steel (XRCA 156), articles of iron and steel (XRCA 160), copper and articles thereof (XRCA 308), aluminum and articles thereof (XRCA 280). Apart from the low labor cost, the advantage in transport is also very important for international competitiveness. Chemical and related industries require bigger investment in physical capital as well as more skilled workers. Comparative advantages were revealed in plastics and articles thereof (XRCA 141 in 2014), rubber and articles thereof (XRCA 312), raw hides and skins (other than furskins and leather) (XRCA 269), fertilizers (XRCA 160), tanning, dyeing extracts, tannins, pigments (XRCA 137), soaps, lubricants, waxes, candles, modeling pastes (XRCA 185), explosives, pyrotechnics, matches, pyrophorics (XRCA 479). These items account for 8.1% of total exports of goods and services in 2014. Capital intensive and higher technology intensive goods with revealed comparative advantage are railway, tramway, locomotives, rolling stock, equipment (XRCA 110), and vehicles other than railway, tramway (XRCA 178). Their share in Serbia’s total exports is 10.6%, same as the share of metal products. Natural resource related industries in which RCA is recorded are stone, plaster, cement, asbestos, mica articles (XRCA 107) and ceramic products (XRCA 151). Their relative significance in Serbia’s exports declined during the period under consideration. Food, beverages and related products where comparative advantages are detected include live animals (XRCA 192 in 2014), dairy products, eggs, honey (XRCA 116), edible vegetables and certain roots and tubers (XRCA 160), edible fruit, nuts, peel of citrus fruit, melons (XRCA 624), cereals (XRCA 610), milling products, malt, starches, inulin, wheat gluten (XRCA 450), vegetable plaiting materials, other vegetable products (XRCA 511), animal, vegetable fats and oils, cleavage products (XRCA 198), meat, fish and seafood food preparations (XRCA 149), sugars and sugar confectionery (XRCA 389), cocoa and cocoa preparations (XRCA 148), cereal, flour, starch, milk preparations and products (XRCA 228), vegetable, fruit, nut food preparations (XRCA 202), miscellaneous edible preparations (XRCA 283), beverages, spirits and vinegar (XRCA 238), residues, wastes of food industry, animal fodder (XRCA 198), tobacco and manufactured tobacco substitutes (XRCA 460). These products account for 14.2% of total exports of goods and services in 2014. In terms of services, comparative advantages are evident in manufacturing services on physical inputs owned by others (XRCA 367 in 2014), maintenance and repair services (XRCA 141), transport (XRCA 162), travel (XRCA 114), construction (XRCA 518), telecommunications, computer and information services (XRCA 204), other business services (XRCA 136), personal, cultural, and recreational services (XRCA 394).
28
These items account for 24.7% of total exports in 2014. Its production requires not only the use of natural resources low skilled workers but are also high-technologies and human capital intensive which implies higher value added. Positive development in terms of XRCA is registered in fertilizers (XRCA 90 in 2007, XRCA 160 in 2014), wadding, felt, nonwovens, yarns, twine, cordage (XRCA 73 in 2007, XRCA 253 in 2014), vehicles other than railway, tramway (XRCA 20 in 2007, XRCA 178 in 2014), (contribution of the latter to the increase of Serbia’s exports is almost USD 2 bln between 2007 and 2014), manufacturing services on physical inputs owned by others (XRCA 0 in 2007, XRCA 367 in 2014), maintenance and repair services (XRCA 0 in 2007, XRCA 141 in 2014). At the same time, meat and edible meat offal (XRCA 102 in 2007, XRCA 81 in 2014), salt, Sulphur, earth, stone, plaster, lime and cement (XRCA 150 in 2007, XRCA 59 in 2014), organic chemicals (XRCA 106 in 2007, XRCA 32 in 2014), lead and articles thereof (XRCA 259 in 2007, XRCA 18 in 2014), tin and articles thereof (XRCA 193 in 2007, XRCA 2 in 2014) marked a significant decline in the RCA index.
Serbia’s Top 10 ERCA Concentration of ERCA for Serbia is less concentrated in higher value added sectors in comparison, e.g., to Macedonia. Sectors Edible fruit, nuts, peel of citrus fruit, melons Cereals Arms and ammunition, parts and accessories thereof Construction Vegetable plaiting materials, vegetable products Explosives, pyrotechnics, matches, pyrophorics, etc. Tobacco and manufactured tobacco substitutes Milling products, malt, starches, inulin, wheat gluten Personal, cultural, and recreational services Sugars and sugar confectionery
ERCA Score 624 610 586 518 511 479 460 450 394 389
Source: KC2 Ltd. calculations based on www.trademap.org
During the period under consideration the structure of exports remained almost the same in terms of goods and services, as the share of goods is about ¾ of the total. A transformation of exports towards higher value added products is observed. Therefore, Serbia’s economy relied not only on unskilled labor intensive items, but also on high technologies, human capital and physical capital intensive products. Summary and Conclusions from XRCA Analysis 1. The main importer of items produced by the countries under consideration is the European Union. The trade between these countries is also very important, as Serbia and Albania are the main importers. At the same time, RCAs in WB countries often overlap and often serve as a reason for a preference towards other markets. 2. An exception in recent years seems to be Macedonia. What is specific for Macedonia is not just the FTAs but an appropriate policy mix, which results in FDIs in export related sectors. (This matter, however, will be analyzed further in the section on specific country profiles.) 3. The other important destinations of local goods and services are Russia and Belarus, in part because of specific FTAs with EAEU countries of Serbia.
29
4. Serbia policy of FTAs with Russia and EAEU did not produced advantages in high value sectors. 5. Vis-a-vie the World tariff barriers for the entire WB were reduced more than 2 times, for Serbia about three times. The average export-import ratio to GDP fluctuates, on average, below 35 of GDP, except for Macedonia’s 40%. 6. Albania, Macedonia and Montenegro are members of WTO, while Bosnia and Herzegovina and Serbia have a statute of observers. It seems, however, that FTAs work in, roughly, similar efficacy in all countries. 7. Generally, the Western Balkan countries export relatively low value added products dependent on low labor cost and advantages in transport and availability of natural resource. Exports of Serbia, Bosnia and Herzegovina and Macedonia are dominated by merchandise while these of Montenegro and Albania are dominated by services, while the trend in Albania is towards parity between revenues of goods and services. 8. For the region as a whole, the number one export market is the EU, with 81.2% (including former SP countries like Bulgaria, Croatia and Romania); then Russia with 15 times (5.2%) lesser share in the overall WB exports, USA – two times a lesser share (2.6%), Turkey (2.4%), China – twice smaller share than US (1.4%), Switzerland (1.2%); all other export destinations are less than 1%; 9. EAEU countries are relatively insignificant in terms of exports, irrespective of the FTAs negotiated individually with most of them. 10. During the period under consideration, almost all countries were capable of increasing their exports, as the growth is around 2 times in USD terms except for Montenegro where the amount of exports is almost unchanged. Part of this development could be attributed to the changes in exchange rates between local and worldwide currencies.
REGION AND COUNTRY SPECIFIC FTARELATED DEVELOPMENTS 1990s were a period of war, embargoes and political instability. After 2000, there were positive developments in the countries themselves and in the region as a whole: restoration of old trade and investment links, identification of new markets and partners, radical improvement of economic reforms, performance of the private sectors and FDIs all of which are linked to comprehensive trade liberalization an improvement of cooperation in government and customs administrations. The WB countries membership in CEFTA (from 2003 to the second half of 2007) and the accession of Central European countries, and of Slovenia, Romania and Bulgaria coincided in time. From January 1, 2007 Bulgaria and Romania become members of the EU; by October 2007 all Western Balkan countries ratified the CEFTA agreement. In mid-2013, Croatia also became EU member. In fact, CEFTA is a Balkan FTA.
30
CEFTA WB Trade Before CEFTA Within CEFTA (SEE) trade, and SEE trade with the EU in 1998 EU EU share in share in Country (and sources) Exports Imports
SEE share in Exports
SEE share in Imports
Albania (IMF; BH excluded)
88.8
77.9
3.0
7.2
21.9
29.5
66.6
52.8
51.7
46.5
7.7
3.4
48.7
62.6
25.2
12.2
50.3
46.4
23.4
32.8
64.6
57.9
1.9
1.0
65.5
69.5
15.1
1.9
32.9
38.7
35.1
16.3
B&H (BH Central Bank & IMF) Bulgaria (IMF) Croatia (IMF; Albania and FRY excluded) FYR Macedonia (IMF) Romania (IMF; FRY excluded) Slovenia (IMF; FRY and Croatia excluded) FR Yugoslavia (Yugoslav statistics & IMF) Source: Uvalic (2005).24
In 1998, the year before the Stability Pact and the MoU with the WB were designed, the Balkans were not trading within itself, and they were trading with the EU much less than today. B&H was exporting to the Balkans three times more than to the EU. Serbia and Montenegro exports to the Balkans were more important than to the EU. In 2008-2013, the major achievement of CEFTA was to apply the WB trade related procedures: full liberalization of trade in goods, diagonal cumulation, opening of the public procurement market, TBT (technical barriers to trade) and state aid notification, intellectual property rights reviews, nondiscrimination of investment and data sharing and accessibility. WB Trade After CEFTA As mentioned before, today the WB’s main trading partner is the EU, its share in Balkan trade is more 75% of the region's total trade. In 1998, only Albania’s volume of trade with the EU was more than 70% of its total trade.
24
Milica Uvalic, Trade Liberalization in SEE: Recent Trends and Some Policy Implications, Geneva, UNECE Spring Seminar, February, 2005, p. 6.
31
Comparison from the period before the trade liberalization and facilitation efforts reveals that the countries with relatively high WB regional trade shares in 1998, in fact “lost” some degree of regional exposure. This is true for Croatia (25.2% in 1998, 21.63% in 2012) and especially for B&H (66.6% in 1998, 31.06% - a decline by a half, in 2012); Macedonia’s WB exposure is roughly unchanged. Irrespective of these developments, the intra-CEFTA in 2010-2012 increased from EUR 12.45 bln to 13.85 bln. Due to the immense size of the EU economy, in 2015 the Balkan share in the EU trade is negligible 1.1% in 2014, with WB country shares in EU trade volumes of between 0.5% for Serbia, 0.2% (B&H and Macedonia), 0.1% for Albania and close to zero percent for Kosovo and Montenegro. Western Balkans and Turkey exports to EU (2006-2015) Country
2006
Montenegro
2007
2008
2009
2010
2011
2012
2013
2014
941
1 081
621
625
714
810
784
817
Macedonia
1,578
1,881
2,250
1,886
2,199
2,751
3,057
3,125
3,482
Albania
1,626
1,851
2,423
2,126
2,228
2,523
2,401
2,380
2,406
Serbia
5,695
7,430
7,358
5,493
6,834
7,327
7,905
7,434
7,715
Turkey
47,277 49,997 50,495 40,437 54,026 65,404 68,186 69,742 66,840
B&H Kosovo
478
594
2015
2,398
5,419
4,047
4,247
4,740
4,785
4,656
4,878
4,930
749
814
884
1,011
1,050
1,083
1,081
1,113
EU Commissioner Hahn recently declared that there is a correlation between SAA and trade performance on the EU market: “Within 5 years following the entry into force of SAAs in Albania, Croatia, the former Yugoslav Republic of Macedonia, Montenegro and Serbia, trade volumes increased by an average of almost 36% and trade deficits were reduced by over 4% in the same period.”25 This development is natural: the general trade rationale is that if possible, merchants would prefer trading with richer and larger, more sophisticated markets. It is also interesting that intra-WB trade, as reported by CEFTA26, in 2012-2015 (data from the first half of the year) is dominated by goods categories like “Animal and vegetable oils, fats and waxes” and “Manufactured goods classified chiefly by material”. They cover, roughly, 50% of the volumes traded. In other words, low value-added trade seems to be reserved for the Balkans, while more advanced sectors are traded outside the region. For the post global recession period of 2010-2015 the picture is the following:
Exports with CEFTA and outside CEFTA increased gradually and steadily, with insignificant ups and downs; Exports with neighboring countries remained roughly unchanged: Austria, Bulgaria, Greece, Hungary, Romania and Turkey, as well as with EFTA countries and China; Exports to Russia increased from 12 to 27% by 2013, but then declined to below 10% of total exports;
25
Johannes Hahn, Commissioner for European Neighborhood Policy & Enlargement Negotiations at the High level conference on EU-Kosovo Stabilization Association Agreement, 17 May 2016 Speech at High Level Conference of EUKosovo SAA, at: http://eeas.europa.eu/delegations/kosovo/press_corner/all_news/news/2016/20160517_03_en.htm . 26
See latest trade statistics at: www.CEFTA.itl . 32
Export growth was most significant to markets like Germany and Italy. Volumes traded with these two countries grew at a somewhat slower pace than with CEFTA; The imports held the same pattern (vis-a-vis Germany and Italy) at the beginning of the period had significant growth from Russia and China; imports from Russia reached in 2011 levels of volumes typical for the import from Germany (EUR 4 bln), but then declined to about EUR 1 bln (while Germany grew to EUR 4.5 bln); imports from China grew to EUR 3 bln by 2013, then declined to EUR 1 bln.
There is a common pattern in productivity and capacity utilization of FTAs, identified before CEFTA (2006) and then retained under CEFTA as well. A paper by Slovene economists Damijan and Kostevc analyzing these developments under the SP for WB identified the following ownership and strategy related regularities of productivity improvement and capacity utilization as a result of FTAs:
Foreign ownership firms were prompted to introduce state-of-the-art technologies and to enhance productivity; Local firms focused on EU exports registered significant productivity and capacity utilization gains; Locally owned firms, trading on domestic and/or regional markets increased their productivity at a much slower pace but the trend seemed positive.27
CEFTA unfinished agenda of trade and capital flow liberalization is the following:
Remove 49% foreign ownership limitation in industries and sectors related to arms manufacturing, trading, and production; Abolish or ease bans on foreign ownership of agricultural land (applied by almost all CEFTA members); Do away with restrictions on the purchase of real estate in sensitive areas such as border zones, national parks, and historical areas (common to all members); Reduce and eliminate restrictions on maritime transport services (e.g., Albania, Croatia, Montenegro, and Serbia) air transport (e.g., Bosnia and Herzegovina, Croatia, and Serbia) and fishing (e.g., Albania, Croatia, and Montenegro).
ALBANIA The overall picture of the impact of the FTA for Albania is common for the WB countries. The table below shows the development in volumes for the period after 2004. But the background for Albania is also very interesting. 1997-2004 Before the SP, e.g. in 1997, two years after the end of the UN embargo on ex-Yugoslavia and amidst and domestic recession caused by instability in the aftermath of pyramids schemes collapse in March that
27
See: Damijan, P.J, Č. Kostevc, Learning-by-Exporting: Continuous Productivity Improvements or Capacity Utilization Effects? Evidence from Slovenian Firms, Review of World Economics, 2006, No 142 (3), pp: 599-614. 33
year,28 exports declined by 50% from the end of 1995 to USD 137.7 mln. By 1999, the first year of the SP it went up again to USD 351 mln. And in the period between 2000 and 2004, it was steadily growing from USD 261 mln (in 2000) to USD 602.6 mln (in 2004).29 Albania volumes of trade dynamics for 2004-2014 (in USD bln)
Source: WITS
It is difficult to isolate the causality factors like business environment normalcy after 1997, GDP dynamics and industrial output from SP initiatives, FTAs CEFTA and EU SAA. It is obvious, however, that Albanian exports sustained their upward trend for a period of 18 years. The WITS picture proves that:
The export growth trend continued at a slower pace after 2006 (the year of joining CEFTA); It was interrupted with global recession in 2009 but the drop was relatively insignificant in comparison to the decline in imports; Overall, it looks as if imports to Albania is on average flat after 2008.
It is likely that the FTAs have been one of the key factors, since other related factors seem to have different dynamics. Here is the comparison between exports and FDIs, as contracted by Trading Economics Portal of the basis of Albanian statistics and central bank data. As with every relatively small economy macroeconomic data does not explain much. However, it is obvious that at from the beginning of the period until 2010 FDIs and exports are disconnected – in peaks of FDIs (that are reflected typically as deteriorating of the current account and trade balance) exports change a little. Periods of record high
28
Here is a summary provided by IMF economist Christopher Jarvis: “Some 2,000 people had been killed in the violence that followed the pyramid schemes' collapse. Large parts of the country were no longer within the government's control. Government revenues collapsed as customs posts and tax offices were burned. By the end of June, the lek [the national currency] had depreciated against the dollar by 40 percent; prices increased by 28 percent in the first half of 1997. Many industries temporarily ceased production, and trade was interrupted.” The country balance of payments deteriorated by 9.1% of GDP, economic output – by 7% of GDP. See: Christopher Jarvis, The Rise and Fall of the Pyramid Schemes in Albania, IMF, 1999, Working Paper 99/98. (A summary of the paper is published in IMF Quarterly Magazine, Finance and Development, March 2000, vol. 37, No 1, available at: http://www.imf.org/external/pubs/ft/fandd/2000/03/index.htm . 29 See WITS: http://wits.worldbank.org/CountryProfile/en/Country/ALB/StartYear/2000/EndYear/2004/TradeFlow/Export/Partne r/WLD/Indicator/XPRT-TRD-VL . 34
FDIs, like 2009-2010 – associate with the liberalization and privatization of the country’s power sector, are probable factors of overall economic performance improvement in the years to come, which eventually result in better export performance.
Source: Trading Economics
Between 2010 and 2014 Albania’s to Europe (not only EU) grew by 65.3%. Albania Export to EU 2005 - 2015 (Values and Growth) Value (EUR bln) Growth (%)
2005
2006
2007
2008
2009
2010
2011
2012
2013
2014
2015
0.418
0.498
0.631
0.681
0.651
0.895
0.946
1.118
1.234
1.245
1.165
19.1
26.7
8
-4.50
37.6
5.7
18.2
10.3
0.9
-6.40
Source: DG Trade, 26 April 2016
Albanian exports to the EU grew on average by 10.5% a year (115.6% for the period). Compared to the average rage of GDP growth rate (which had its peaks of 11.5 and 10.5% in 2008 and 2009, and its lows of 2.4% in 2014) of 4%, the export to the EU serves as growth engine for the country economy. The market conjecture, however, is not completely in favor of Albania. The lower oil prices in 20152016 resulted in lower proceeds from merchandise exports, in 2015 annual deficits in trade in goods deteriorated 6.7%; there is a surplus in services - 17.5%. In 2015 as a whole, the current account deficit shrank by 10.3% y-o-y. The merchandise trade deficit rose by 3.7% as the sharp fall in the value of goods exports (-17.2%) outweighed the drop in merchandise imports (-2.4%). The services surplus soared (+62.5%) thanks to strong receipts from tourism (+5.4%) and manufacturing processing services (+20.9%), whereas spending by outbound tourists decreased by 6.5%.30 The country’s main ten trading partners are Italy, Greece, Turkey, China, Germany, Serbia, Switzerland, Spain, France, Macedonia and Bulgaria. In terms of export (measured in volumes as provided by CEFTA statistics), Italy seems 4-5 times more important than CEFTA countries, and three times more important than Turkey, Greece or Germany.
30
EU Candidate & Potential Candidate Countries’ Economic Quarterly (CCEQ), 1st Quarter 2016, TECHNICAL PAPER 008 | APRIL 2016, p.9. 35
Conclusions Regarding FTAs Before the SP trade facilitation initiatives, Albania’s exports were driven predominantly by extraordinary international constellations, notably by UN embargo on ex-Yugoslavia and the Greek embargo on Macedonia (1992-1995). The country economy suffered by domestic shock, like the collapse of the spring 1997. The trade facilitation indicatives under SECI and SP, MoU on asymmetric and unilateral EU liberalization of 2001, and the subsequent FTAs and CEFTA Agreement (all becoming an integral part of the country SAA with the EU) has led to: -
A rapid growth of exports for the period to 2004, export opportunities acting as independent factor, which was fueled by integration of the economy into the global market and EU market, FDI’s and efforts to streamline customs and border-crossing procedures; In the first period, to 2004 the export growth was 65%, for the second period of the last 10 years, the export growth to the EU was more than 110% - more than 2 times higher growth rate in comparison to GDP; The ERCA for Albania, analyzed in the previous section, demonstrate a relatively stable constellation of lead export sectors, which changes gradually towards higher value added industries; CEFTA does not seem to have any significant impact neither on volumes traded nor trade partners; if it had an independent influence it should have been on institutional level and on reducing the costs of trade with neighboring countries and, perhaps, outside the Region; however, CEFTA and Albanian trade statistics do not allow for a detailed analysis of this role of the FTAs.
BOSNIA AND HERZEGOVINA B&H SAA Process Bosnia and Herzegovina seem somewhat special case in terms of implementing FTAs. The country FTA seem to act independently from the country’s political integration with the EU. An SAA was negotiated and signed in June 2008, but its entry into force had been frozen, mainly due to the country’s failure to implement a key ruling of the European Court of Human Rights.31 The last EU ratification of the SAA (by France) happened in early 2011, and should have entered into effect, but B & H had not complied with its previous obligations, and it led to a suspension of the SAA.
31
The ECHR requires an amendment to the Constitution to allow members of minorities to be elected to the Presidency of Bosnia and Herzegovina and to get seats to House of Peoples also blocked the SAA. The EU has also required that the country create a single unified body to manage their relations with the EU. The adoption of state laws on the issues above were prevented by the opposition of the government of the Republic of Srpska, which considers such issues a matter of exclusive competence of the two entities of Bosnia and Herzegovina. In March 2014 Croatian Foreign Minister Vesna Pusic at a session of the Council of EU, proposed to other EU countries to grant Bosnia and Herzegovina the status of a Special EU Candidate Country. Minister Pusić pointed out that Croatia does not suggest lowering the membership criteria but rather that member states should take a proactive stance in cooperation with Bosnia and Herzegovina and not just to put high criteria and just wait for something to happen. This proposal eventually materialized: the declaration of cooperation was jointly signed by the tripartite presidency of B & H on 29 January, and approved by parliament on 23 February 2015, and the Council of the EU approved the SAA's entry into force on 16 March 2015, so the SAA entered into force on 1 June 2015. 36
The part of SAA which matters for trade and economic relation is the one dealing with elimination of state aids and statistical information of national censuses. The delay with SAA have caused delays in utilizing other trade agreement – those with CEFTA and EFTA. Trade and Economic Development A recent report by Brooking Institution found that B&H “Exports are worth only 30 percent of GDP, one of the lowest in Europe and a sign of the country’s weak competitiveness.” The underlying factors are “poor business climate, high cost of employment and poor transport connections (rated as among the worst in Europe for all forms of transport by the World Economic Forum)”. “If B&H exported as much as it did during Yugoslav times, its exports would be three times as high.”32 This is a pessimistic assessment. It is difficult to draw an objective picture on B & H trade prior to 2003: the national statistics is controversial, the World Bank’s WITS gives information on volumes after 2003, and sometimes different sources contradict one another on data earlier than 2003. It is clear, however, that B&H export to the world does show as consistent, although not so steep as Albania, growth pattern as other WB countries. Here is the Trading Economics graph comparing FDIs and B & H exports for the last 10 years.
On average the FDI inflow to B&H remained on the same level since it dropped down by 20% from its peak in 2007 (USD 720 mln) but remained disconnected from the export performance (but contributed to the current account deficit and the negative trade) until 2011. After 2011, the export mean growth rate demonstrates a clear up-trend, correlated to inflow of capital. The GDP dynamics, to the contrary, according to the World Bank Development Indicators registers a steady growth rate from USD 347.17 per capita in 1995 to USD 4,661.76 in 2013. Almost the same is Albania’s GDP per capita pattern.
32
See: Ellen Goldstein, Simon Davies and Wolfgang Fengler, Three reasons why the economy of Bosnia and Herzegovina is off balance, Brookings, Future Development, November 5, 2015, at: http://www.brookings.edu/blogs/future-development/posts/2015/11/05-bosnia-economy-goldstein-davies-fengler 37
In comparison to Albania, B&H started from lager volumes of goods exported to the EU. WITS portal helps us recreating the after war restoration of B&H exports (to the world, not only EU) by taking the 2000 level of export as 100 percent. In 1995, the year of the Dayton peace accord, the export value was 14.2% of the level achieved in 2000, in 1996 - 31.4%, in 1997 – 53.7%, in 1998 – 56.5% and in 1999 (the year of the Stability Pact) – 70.25%. The export growth rate between 2000 and 2004 was 167%, and by 2009 – 369.83% of the 2000 level.33 FTAs with EU and Other Markets From Day One, EU is main trading partner for B&H. Nowadays the EU is B&H largest trading partner, accounting for over 82% of total trade of the country with the world (as noted above B&H share in the EU imports is 0.1% of the total). In 2005 the total trade with EU of around EUR 5.5 bln. Same year imports coming from the EU made up 66.7% of total imports by B&H, while exports to the EU accounted for 71.4% of its total exports. In 2007, B&H exports to EU by 6.1% to reach close to EUR 2.4 bln, while imports from grew by 8.3%, reaching over EUR 4.4 bln. In 2015 B&H export to EU is more than EUR 3.5 bln, EU imports - is already EUR 5.08 bln. (Total trade turnover is more than EUR 8.5 bln.34 This graph from EU DG Trade exposes the dynamics.
Source: DG Trade.
It makes sense to have a closer look at the export data, provided by the EU and compare the B&H export to EU with the dynamics of Albania.
33
See: WITS: http://wits.worldbank.org/CountryProfile/en/Country/BIH/StartYear/2005/EndYear/2009/Indicator/TX-VAL-MRCHXD-WD 34 European Union, Trade in goods with Western Balkans, EU DG Trade, 29 April 2016. 38
The EU export dimension was growing steadily, there a sharp drop of exported volumes in 2009 by more than 1/5 but the growth of export resumed next year and fully compensated the negative development. B&H Export to EU 2005 - 2015 (volume and growth)
Volume (EUR bln) Growth (%)
2005
2006
2007
2008
2009
2010
2011
2012
2013
2014
2015
1.697
2.202
2.368
2.493
1.934
2.488
2.951
2.99
3.244
3.33
3.514
29.8
7.5
5.3
-22.50
28.7
18.6
1.3
8.5
2.6
5.50
http://trade.ec.europa.eu/doclib/docs
The overall export to EU growth rate for the period is somewhat lower than Albania – 85.3%, or 7.7% per annum. Similar to Albania this rate is twice higher than the GDP annual growth rate for B&H. The market conjecture in the period was of lesser importance to B&H than to Albania (mostly because of oil and lubricants share in the Albanian export). As indicated above, the top five lead B&H export sectors are: -
Manufacturing with 90% of total exports dominates the entire volume of exports, Then come exports of machinery and transport equipment (17%), Chemical products and inedible raw materials except fuels (with 8%), Mineral fuels, lubricants and similar products (7%) And food and live animals (6%).
Bosnia and Herzegovina’s main export partners are Germany, Italy, Croatia, Slovenia, Serbia, Austria and Turkey. B&H and Herzegovina trade with EU continue to grow in recent years. In 2014 imports from EU are 81.6% of total imports of the country. Russia is No 2 importer to B&H with 6.8% of the total (then is Turkey – 3.9%, China – 3.5% and Macedonia – 1.3% of total imports. No other EU Eastern Neighborhood country imports to B&H are detected by the statistics. Countries like Switzerland, USA, South Korea, Hong Kong and India have each less than 1% share in B&H imports. In terms of 2014 exports for EU are 84.8% from total country exports. Than No 2 is Turkey with 3.3%, Switzerland – 1.9%, USA – 1.6%, and Russia – 1.5% of the total exports. Ukraine – the only Eastern Neighborhood country is on the ninth place of export markets of B&H with (0.6%, or EUR 20 mln). Interestingly enough, Albania share is equal to that of China in B&H exports (0.7%). FTAs with EFTA and CEFTA B&H EFTA (Switzerland, Norway, Iceland and Liechtenstein) FTA entered into force on January 2015. It is a result of the EU SAA, and its goals are liberalization of trade in goods and abolishment of all customs duties on industrial products (the same philosophy as with 2001 MoU with EU). Compared to other WB countries, B&H was late with the signing concluding the EFTA Agreement. It is too early to judge about the effects of the Agreement. CEFTA statistics demonstrates that after 2010 B&H export to Croatia and Slovenia gradually decreases, as is the overall dynamics of B&H export to CEFTA – from 20% of the total export in 2010 to 15% in 2015. Somewhat positive is the export record with Germany and Austria, while the shares of Austria, Bulgaria, China, France, Greece, Hungary and Russia remain relative unchanged. It looks as if CEFTA supported a positive dynamics of the trade with Turkey. Bilateral trade volume between Turkey and B&H used to be USD 596.6 mln in 2008, in 2009 declined to USD 278 mln, but after 2010 restored to USD 363 mln in 2012, and is the only B&H export destination except EU with
39
growing share to present day. Turkish investment in construction and healthcare is also important to B&H. After 2006 (when CEFTA was signed) B&H export to Turkey double in 2007, in 2008 remained unchanged then to 2009 again double, and grew by another 120% to 2015. Conclusions Regarding FTAs Bosnia and Herzegovina case with FTAs highlights that every WB country had a very specific constellations to secure gains from trade. In mid-1990s, after Dayton B&H had no choice but trading with the West, the EU, so both exports and trade with EU developed fast on the aftermath of the Dayton Agreement and from roughly 20% in 199835 quadrupled to above 80% in 2010s. Eventually it created a situation in which EU dominated the entire trade. And this development realized irrespectively obstacles to full cooperation with the region and the Union as envisaged by the Stabilization and Association Process. In a sense, FTAs for B&H served as sufficient background to enhance export and secure access to foreign savings and boosting prosperity. The failure to comply with SAA economic requirements, especially state aid clause, was the key reason for little progress in business sector related reforms. This was a reason to delay privatizations and closure of loss-making state owned enterprises and attempt securing export markets for such enterprises. FDI’s were often channeled to such enterprises. Delayed business and enterprise restructuring is reflected above analysis of XRCA that found that B&H exports are still dominated by either unskilled labor intensive goods or by natural resource intensive products. Most of them are still operated as state owned. At the same time, delayed reforms increased the costs of entry for outsiders and gave the local political establishment reasons and resources to collaborate with local entrenched interest. It could diminish prospects for prosperity of the local population but export and foreign developed relatively independently from this process. At a first glance, B&H FTAs failed to utilize some otherwise obvious opportunities from regional trade. E.g. China’s share in trade and exports with and from B&H is the same as the share of neighboring Albania. A part of the explanation is that in fact some RCA for both countries are the same, but, on the other hand, delayed reforms are part of the picture.
KOSOVO As part of newly emerging sovereign jurisdiction, Kosovo economy is a very interesting case of trade liberalization. Within FR Yugoslavia and Serbia, for political reasons Kosovo could not make significant progress in utilizing opportunities of FTA agreements and facilitation programs and initiative. Historic Summary of Kosovo FTAs and Other International Arrangements Not an official member of Stability Pact for Southeast Europe or prospective SAA country,36 Kosovo signed by the countries of SEE in 2001; Kosovo committed itself to respect the obligations deriving from the Memorandum of Understanding (MoU) on Trade and Transport Facilitation in SEE and later on signed bilateral FTAs with some of the partners from the region. It is not a SAAs country either. It is
35
See above the table from Milica Uvalic, in the section of CEFTA. In fact, Kosovo is about to submit to EU Commission the documentation to formally start the SAA procedure on May 25, 2016 (see for details footnote 1). 36
40
referent to its EU legal status rather than the actual trade and deals as an FTA with EU (CEFTA) is in force since 26 July 2007 signed by UN on behalf of Kosovo (United Nations Interim Administration Mission in Kosovo - UNMIK) – to be considered rather for evaluation of Kosovo’s progress in its EU accession as a process itself) It is no member of WTO, so Kosovo started its efforts of implementing WB-like FTAs in 2003.
Its first such agreement was the FTA with Albania of 2003, which included a bilateral investment agreement; FTA with Macedonia entered into force in 2005, and there were complains that it was not efficiently implemented by the Republic of Macedonia; The FTA Croatia become effective from the beginning of 2006, December 1, the same year was the date of enforcement of the FTA with B&H; FTA with EU and Moldova via CEFTA is in force since the summer of 2007; Turkey – Kosovo FTA is an interesting example of unilateral trade liberalization on behalf of Turkey: it repeats the philosophy of MoU between EU and the Western Balkan – it eliminated all tariffs on Kosovo goods exported to Turkey but introduces 10-year grace period on a list of product (mostly manufactured goods) for a list of good a services that Kosovo government listed as “sensitive”.37
Several Kosovo specific circumstances motivated the country to actively take part in the following international initiatives.
Dependence of neighbors for electricity and energy supplied, required an active membership of Kosovo (then governed by UNMIK) in Athens Process on Energy for the Southeastern Europe Energy Community Treaty (which entered into force in July 2006). The Treaty’s most important role was to set a regulatory framework for energy cross-border trading and gradually integrate Western Balkan into the EU energy market, thus securing property right, predictability of intraregional energy contracts and possibility to finance power sector related projects.38 EU Common Aviation Area membership of Kosovo (since June 2006, under UNMIK) helped Kosovo economic development overcoming the fact that it is a land-locked country.
Kosovo FTA and Development It should be noted that Kosovo trade liberalization has its peculiarity: irrespectively the fact that EU MoU applies to Kosovo, and that its FTAs with neighbors and CEFTA have the same principle structure, the level of liberalization is lower (due to relatively high tariff on imports from “sensitive directions”). Kosovo FTA and Development of Trade (EUR ‘000)
37
See for details: Kosovo International Trade Guide, Trade Agreements, at: http://www.itg-rks.com/en-us/TradeAgreements . 38 See the Treaty at: : https://www.energycommunity.org/portal/page/portal/ENC_HOME/ENERGY_COMMUNITY/Legal/Treaty 41
Source: Kosovo Agency of Statistics 39
For goods, coming from (as indicated by the rules of origin) countries outside CEFTA (e.g. Germany, China), but which are imported directly into Kosovo from the territory of a Party to the CEFTA are not eligible for entry into Kosovo free of customs import duty, under the terms of the CEFTA. The customs import duty on such goods, generally 10% ad valorem, must be paid at the time of importation into Kosovo. The above table demonstrates that irrespectively the 10-percent duty, the trade develops positively with the FTAs, although there is no immediate causality effect. There is a temporary decline of both export and import, somewhat deeper for the latter, in 2009, cause by the global slowdown. (Details are more visible on the graph below.) The motivation behind the said import duty arrangement is the budget revenue prospect for a newly established state. An IMF paper of December 2013 summarizes the situation in the following manner: “The structure of Kosovo’s tax system is heavily tilted towards indirect taxes—as in B&H, Croatia, Montenegro, and Serbia—with more than 80 percent of tax revenue coming from this source. In particular, import duties account for about 2.5 percent of GDP and 11.5 percent of tax revenue. By contrast, the contribution of direct taxes (including income tax and property taxes), is about half the regional average.”40 In comparison to 2.8% share of import duties in the budget revenue of other countries, selected by IMF for the sake of comparison, for Kosovo this share is four times more significant. Trading Economics database is one the few economic data portals that allows for compiling different indicators to analyze Kosovo economic development. This graph compares the country exports with its balance of trade: the gap is (slowly) narrowing. Like with other WB countries Kosovo trend in export (all countries) is positive.
39 40
Further details at provide in the table on Kosovo Export and Import by SITC, in Annex 1. IMF: Republic of Kosovo, Selected Issues Paper, July 2013, p.8. 42
Source: Trading Economics
GDP, Investment and Trade It seems that Kosovo FTAs are associated with positive performance of the economy. Since 2007 (the year before declaration of independence), Kosovo the average GDP annual growth rate has been one of the highest in the region, sometime the peak was almost 11%, currently – it is 5% (almost unthinkable for any European country).
Source: Trading Economics
There is a peculiarity here. The above quoted IMF Selected Issues Paper found that Kosovo economic development is particularly correlated with economic process, trade and investment originated in Germany and Switzerland. IMF authors find the explanation in Kosovo Diaspora in those countries. “This pattern differs markedly from the other Western Balkan countries whose GDP growth is highly correlated not only with Germany, but also with activity in the rest of the euro area.” There are there general factors involved:
43
The presence of an educated Diaspora provides foreign investors with a much needed knowledge of local markets, which helps breaking barriers to long-term inward foreign investments unskilled migrants can also increase FDI by revealing workforce characteristics such as productivity of labor force and decreasing cross-border information costs and FDI-related country risk premium; The migration could also provide unskilled migrants with the necessary human and physical capital to invest in their home countries, an opportunity that would not be possible without migration.
The result is that Germany, Switzerland and UK, which in 2011 accounted for over half of remittance transfers to Kosovo, have over the years contributed to about 40 percent of overall yearly FDI inflows since 2007.41 And Kosovo recorded remittances of about 14% of GDP, the largest in the western Balkans FTAs Associated Benefits and Risks The picture of Kosovo FDIs dynamics is rather typical for the WB.
At first, there is an accumulation of capital (again associated with current account deficits), and only exports pick up. The turning point was 2010: then, according to Central Bank of Kosovo (CBK) balance of payments data, the export of goods jumped by 72%, while imports - by 12% (the trade-in-goods deficit increased, irrespectively to extraordinary growth, by 6%). As it is also typical, the large picture often depends of “micro” developments on sectoral level. The EU has granted ATM to all WB countries, and Kosovo exporters received a duty free access to the EU market, however they had nothing to export but non-ferrous metals. The structure of Kosovo trade was and in many aspects remains as follows:
41
In 2015, the country predominantly exports metals (47%, in 2010 the share of the metal in total exports was 63%) and mineral products (30%);
See: IMF: Kosovo Selected Issues Paper, p. 6. 44
The main imports are fuels, lubricants, mineral products, appliances and electric materials, prepared food, beverages and tobacco; Kosovo’s main trading partners are Macedonia, Germany, Italy, Serbia, China and Turkey; In 2010, Kosovo realized around 75% of total trade with the EU and with CEFTA member countries; Between 2003 and 2014, with up and downs, the export to CEFTA increased 3,6 times (to EUR 127.15 mln); At the beginning of independence Kosovo has reported increasingly large trade deficits (in goods - 57% of GDP in 2007) due to non-existing export base; In 2010, the ratio of imports-to-GDP of about 60%, a trade deficit of roughly 40% of GDP a significant improvement since 2007 but still large; In 2016, the same indicator is likely to go down to 32-33% of GDP.
There are two types of risks associated with the FTAs. The first set of risks should be found in the underlying economic structure for metals dominated exports. It is rooted in one enterprise – Trepça Mining Complex (TMC). With above 70% of exYugoslav mining output, TMC was the main exporter of ex-Yugoslavia. After 1989, embargoes, dissolution of Yugoslavia and subsequent overall uncertainty, Kosovo’s economy declined 50% and then another 20% between 1998 and 1999.42 These factors left TMC with unclear ownership, past environment pollution, chronic lack of access to finance due numerous claims by creditors that took years to resolve (while for the remaining it may take years to negotiate). The past and potential investors seem scared away, irrespectively the fact that TMC has a potential and that in 2015 the Government of Kosovo adopted a law according to which TMC is 100% state owned enterprise, the restructuring is believed to require no less EUR 650 mln (8.8% of the country’s GDP in 2016). The second type of risk has been identified by WIIW and IMF: Kosovo’s reliance on trade taxes may create budgetary pressures in the event of further trade liberalization, especially in relation to CEFTA and other FTAs.43 Before IMF, in 2012 the WIIW economists, Mario Holzner and Florin Peci, found that “that the overall simulated net welfare effect of liberalization is negative for Kosovo (EUR -3.5 million), notably due to strong losses in tariff revenues (EUR -71.2 million) and less so producer surplus which cannot be fully outweighed by a substantial consumer surplus in the wake of falling prices after liberalization”.44 Holzner and Peci had run a Global Simulation Model (GSM) on industry level and found that in the case of full liberalization “a relative drop in Kosovo output could be highest in those industries where consumer prices decrease most after liberalization and/or where the biggest part of local production is being sold domestically.” “Sectors with an estimated drop of more than 3% in output are the tobacco, the electrical machinery, computing machinery, chemicals and machinery industries.” FTA Related Conclusions Since the time of these predictions, the situation changed towards further reduction of the trade deficit, by about 3% of import of goods to GDP, and the GDP itself continued to grow.
42
Ian Lynch, Trepca and Kosovo’s Uncertain Future, University of Vermont Environmental Program, Class of 2012, at: http://www.uvm.edu/~shali/Trepca_Kosovo_Serbia_Mining.pdf . 43 See: IMF: Kosovo Selected Issues Paper, p. 8. 44 Mario Holzner and Florin Peci, Measuring the Effects of Trade Liberalization in Kosovo, WIIW Balkan Observatory, Working Paper 085, June 2012, p. 15. 45
Besides fears and conjecture of price fluctuations on the international non-ferrous metals, the situation remains somewhat beneficial for Kosovo – prices are relatively high, especially if compared the situation of the first years of Kosovo independence. One can see this dynamic in the behavior of the IMF Commodity Metals Price Index. This Index includes Copper, Aluminum, Iron Ore, Tin, Nickel, Zinc, Lead (this is in fact the entire export list of TMC), and Uranium Price Indices. It has picked up from 49.69 in March 1999 to 256.24 in February 2011, and since then went down 116 in March 2015, still twice higher than in the beginning of the century. (The 2009 prices dropped to the level of 105.3.). Here is the table that summarizes the metals market conjecture.
IMF Commodity Metals Price Index (30 year dynamics)
Holzner and Peci predicted that with the fall of metal prices (which actually happened after 2012), and the budget revenue diminished by 2% in 2013, and by 0.6% in 2014. In 2015, however, the trade balance improved and the “revenues collected from border taxes amounted to net EUR 944.9 mln which are for 8.8% higher than in 2014”; VAT revenue grew by net 9.3% and the net revenues from domestic taxes marked an increase of 11.5% indicating a robust economic growth. On overall, the external trade of Kosovo (in terms of partners, custom unions, FTAs and volumes), its economy and fiscal position of the government are very dynamic. For the time being neither IMF nor WIIW Kosovo trade pessimism materialized. Additionally, as
46
indicated by the World Bank, in 2012-2013 the fiscal position deteriorated due to increase of Kosovo government expenditures, that were not justified economically.45 Under CEFTA, there are sectors that still remain to be negotiated and liberalized in 2016 and 2016, especially services and transport, and NTB with some countries (for Kosovo this is Serbia) remain to be eliminated.46 The recent update and reinforcement of SAA with the EU will secure progress of this front. Irrespectively these bureaucratic hurdles, between 2011 and 2014 (latest data available), Kosovo export to CEFTA47 increased from 25.2%, to 36.3 (in 2012), to 35.6 (in 2013), and to 39.2% of total export in 2014. (It should be noted that in the period between 2005 and 2010 CEFTA exports declined from above 51% of the total to 22.6 %.) The increase of CEFTA export share was at the expense of the decreasing EU shares in Kosovo export: from 45.5% in 2010 to 30.2% in 2014. Besides EU as such, 2014 Kosovo main EU export partners are Italy (15.3%), Germany (3.5%), Poland (1.8%) and Bulgaria (1.2%). On the CEFTA direction the situation was as follows: Albania – 13.6%, Macedonia – 11.1%, Serbia – 8.5%, Montenegro – 5%, and B&H – 1.2% of the total Kosovo exports. There is no export to Eastern Neighborhood countries, but the export to Asia increased from 9.5% in 2012 to 21.6% in 2014 (China – 13% and India – 8.5%). In terms of volumes traded, Kosovo main partners in 2014 were, in order of importance: Italy, Albania, China, Macedonia, India, Serbia, Montenegro and Germany; the trade balance is positive with Montenegro and India.
MACEDONIA Macedonia FTAs The country has signed five FTAs that secure a place in Europe for its products and provide significant opportunities for expanding exports. Free trade provisions have been incorporated into the SAA between Macedonia and EU since April 2001. The same year it concluded FTA with Ukraine.48 Gradually, the FTAs reduced the weighted average tariff to 2.26%. Opportunities arise from FTA between Turkey and Macedonia, with Ukraine and CEFTA. Along with other WB countries 2006 Macedonia joined the “old” CEFTA and in October same year, again in package with WB, it become a member of the “new” CEFTA. Macedonia also signed FTAs with all EFTA countries (Iceland, Liechtenstein, Norway and Switzerland). In March 2004 Macedonia applied for EU membership and was granted EU candidate status in December 2005. In 2009, EU Commission recommended opening accession but in 2015 the Commission made the negotiations conditional to resolving long-standing name-dispute with Greece and to more recent issues related to symbolic history claims to Bulgaria.
45
The government deficit went up due to “i) increase public sector wages and pensions by 25 percent; (ii) introduce new social benefits for political prisoners and war veterans; and (iii) sign the contract for a budgetfinanced motorway construction project (with only limited economic viability)”. 46 Zef Dedaj, Merita Fetahu, Daniel Linotte, NTBs in the CEFTA context: The Case of Serbia against Kosovo, Republic of Kosovo: Ministry of Trade and Industry, May 2015, at: http://www.mtiks.org/repository/docs/Policy_Paper_on_NTBs_333760.pdf 47 All data below is from Kosovo Agency of Statistic, for more detail of the period before 2011, see Annex 1, Kosovo section. 48 See the list of Macedonia FTAs at: Republic of Macedonia, Customs Administration: FTAs, at: http://www.customs.gov.mk/en/DesktopDefault.aspx?tabindex=0&tabid=119 47
Macedonia’s SAA with the EU is now in its second phase, with most EU tariffs being phased out by the end of 2010. In many ways this was advantageous period for Macedonia – it improved market access to the EU, used the limited protection options under the MoU appropriately to attract FDIs in export sectors, reduce taxes and enhance human capital. “Attracting FDI, concludes a recent IMF paper on Macedonia, and building up export capacities have been the linchpin of the authorities’ economic policy over the last decade”.49 FTAs and Economic Performance In August 2015, IMF found that “export performance in FYR Macedonia has been strong over the last decade, critically contributing to overall growth. Exports have been re-oriented towards new products with higher technological content, allowing for the build-up of revealed comparative advantages in these products.”50 The result was somewhat untypical for WB countries: “higher exports and trade openness have been associated with better resource allocation and the development of a resilient tradable goods sectors (…), ultimately being conducive to higher standards of living. This positive correlation between exports and real GDP per capita has held up in Central and Eastern European Countries that are members of the European Union (…) over the last decade. While the correlation appears weaker for some Balkan economies, for FYR Macedonia, real GDP growth has been strongly associated with export growth”.51 It looks as if, that the Macedonia policy mix allowed for appropriate use of FTAs, especially CEFTA, irrespectively delays of membership negotiations with the EU. In the last 10 years, of all WB countries only Serbia export (of all goods and services) ratio to GDP improved from 18% to 36%, but remains significantly below Macedonia’s 42%. It should be mentioned also that Macedonia reach the 40-percent threshold back in 2007, on the aftermath of signing the agreement with CEFTA. Then, in the second half of 2008 and first half of 2009, the exports dropped to 30% of GDP (for rest of the WB the decline was to between 10 and 16% of GDP) but resumed to 40% in 2010. It makes sense to compare Macedonia with the same indicator for the EU in 2014. Imports and Exports in Percentage of GDP by Country, 2014
49
IMF: FYROM, Selected Issues Paper, p. 3. Ibidem, p. 2. 51 IMF: FYROM, Selected Issues Paper, p. 3-4. 50
48
Source: Eurostat
Macedonia indicator is the level of EU average, or of that of Sweden, Romania and Croatia (for which it has picked up after joining the EU). However, it remains considerably below such Balkan countries as Bulgaria (63% of GDP) or ex-Yugoslav Slovenia (78% of GDP). As with other WB countries it highlights a period of accumulation, and then a period of parallel and correlated dynamics. Prior to 1998, FDIs were minimal – the economy was dominated by often loss making state-owned enterprises. The peaked up after 2000, when key companies were sold to EU investors. As the table indicates, in 2007 FDI to Macedonia almost halved on year-on-year basis. What is characteristic for the period until today is that FDI were channeled to the tradable sector thus boosting export. The table below (constructed from Trading Economics) shows the FDI-exports pattern.
What also helped was the objective to become a member of the EU, which motivated policies to ease business environment. Part of the effort was to design FDI incentive since the small size of the economy was presumed as demotivating factor. In terms of doing business Macedonia fares better than WB neighbors and worse than peers like Montenegro, Bulgaria, Slovakia or Czech Republic.52 Incentives for FDIs include also the policy of free economic zones, with such specific measures like: corporate tax holiday; no customs duties and VAT on imported raw materials, equipment and construction materials; 0% personal income tax for 10 years; 0% property tax; 0% excise taxes; fee-free connection to utilities; up to EUR 500 thousand subsidies for construction costs; ‘green’ customs channel at the border for expeditious export to EU countries; long-term land lease for a period of up to 99 years; and grants for training and job creation. Trends in Macedonian Trade with the EU Total goods: EU Trade flows and balance. Annual data 2005 - 2015
52
See for summary: Lindita Muaremi, Rigersa Konomi, Sindise Salihi, Macedonia’s FDI, European Scientific Journal, vol.11, No.4, February 2015, p. 59. 49
Source: Eurostat Comext - Statistical regime 4
Since joining MoU and CEFTA, like with other WB countries, the EU has become the most important trading partner. Macedonian import from EU grows almost 3 times from 2005 to 2015, while export– almost 2.4 times. As already mentioned, the fastest growing Macedonian export products are machinery and transport equipment, chemicals and related products. The table below demonstrates that export potential realized by Macedonia to the world has a similar dynamic as the growth vis-a-vie EU. The annual growth rate was 9.8%, the total growth – almost 100% (still less than the export growth to the EU) Macedonia Export to the World (2005-2014, Volumes in EUR '000 and Growth) 2004
2005
2006
2007
2008
2009
2010
2011
2012
2013
2014
WB Export
2357
2592
2771
3853
4658
3658
4112
4459
4785
4864
5452
Growth (%)
N/A
10%
6.9%
39.1%
20.9%
-21.9%
13.1%
8.5%
7.3%
1.7%
12.1%
Source: EU DG Trade
The Macedonia exports to the EU had a much bumpier pattern: in three of 11 years it declined, the drop was particularly sharp in 2009 but, like in almost all WB countries, was fully restored next year. The annual average growth rate was almost 14%. Macedonia Export to EU (2005-2015, Volumes in EUR '000 and Growth) 2005
2006
2007
2008
2009
2010
2011
2012
2013
2014
2015
WB Export
1134
1447
2019
1949
1321
1852
2281
2110
2386
3012
3354
Growth (%)
N/A
27.6%
39.5%
-3.50%
-32.30%
40.20%
23.2%
-7.50%
13.1%
26.3%
11.7%
Source: EU DG Trade
Macedonia and CEFTA, and Other FTAs The latest CEFTA statistics (first half of 2015) suggest that CEFTA had best helped the development of Macedonia export to Germany. It is the only country, which import from Macedonia grows steadily since 2010 – the improvement is 51%. Macedonia’s largest constantly growing export destination is Germany. CEFTA market withered by more than 80% between 2010 and 2015. 50
A special 2015 commodity trade report by the Macedonian Statistics Office listed most important export partners in the period 2010-2014. It shows the same picture – for four years exports to Germany doubles. The second major partner is Kosovo but the trend is downwards, from about USD 550 to 260 mln. The annual share of third (Serbia), fourth (Bulgaria) and fifth partner remained basically unchanged.53 The share of the Macedonia export to WB countries is presented in the following table. From 2012 to 2013 Macedonia exports to WB Balkans diminished by 28% while it was growing by 13% and 26% per annum of the European, towards first of EU and German markets. Macedonia Export to WB, by Country, as % of its Total Export to Europe to Europe as % Albania B&H Croatia Montenegro Kosovo total
Serbia
Year
2012
2013
2012 2013 2012 2013 2012 2013 2012
2013
2012 2013 2012 2013
Export %
89.51
92.67
2.10 1.97 2.35 2.40 2.74 2.52
0.82
10.92 6.95 8.30 6.81
0.88
If we go back to the RCA analysis, we will find out that 2015 the higher value added goods (as, e.g., machinery and transport equipment and miscellaneous manufactured articles) were exported to Germany (roughly half of the export), while lower value added were sold into CEFTA and intermediate value added (e.g. manufactured goods classified chiefly by material) – to EU countries like Italy, Romania, Bulgaria (plus food and live animals) and China.54 Moldova is not mentioned at all in the Macedonia statistics (according to methodology – less than 0.5% of total), so, for Macedonia, trade within the Balkans should be almost equal to CEFTA. In 2000, Macedonia singed TFAs with EFTA countries. After 2010 the development of the export to EFTA countries developed as shown in the next table. In terms of sectors, it is miscellaneous manufactured articles that dominate Macedonian exports to EFTA. Evolution of Merchandise Trade with EFTA: Macedonia in 2010-2014 (in USD mln.) Exports
2010
2011
2012
2013
2014
EFTA
47.126
60.931
61.032
57.403
51.306
Macedonian share of EFTA's exports to the world
0.01
0.02
0.02
0.01
0.01
Iceland
0.07
0.396
0.152
0.220
0.153
Norway
2.160
2.918
2.262
1.725
2.357
Switzerland
44.958
57.618
58.618
55.458
48.796
Source: EFTA
Since about the same time, Macedonia trades with Turkey with FTA enforced in the autumn of 2000.
53
See: Commodity International Exchange of the Republic of Macedonia, 2013, State Statistical Office, Skopje, June 2015, p. 18. It should note that the Macedonian Statistics Office does not structure the data by FTAs or custom unions, but by geographic areas; e.g. Europe-related trade information is by countries of the continent not by members of the EU, or CEFTA. Similarly, from EAEU one would see countries, not the custom union. (Plus, all data are in US dollars and somewhat differ from the date from other sources, mostly because of the specific recording rule of origin.) 54 See: CEFTA Trade Statistics: 2015. 51
Tariff and non-tariff barriers were almost completely eliminated in trade between the countries. As far as preferential trade in goods is concerned customs duties on imports into Macedonia of industrial products originating in Turkey were eliminated as of January 2008. Customs duties on imports into Turkey of industrial products originating in Macedonia were abolished as well. In the area of agricultural products, Turkey and Macedonia exchanged mutual concessions for certain products in the form of tariff quotas. Turkey is Macedonia's eighth trading partner. The estimated FDI from Turkey is EUR 1 bln. The trade volume between Turkey and Macedonia was realized as USD 427 mln in 2014. In 2014, Macedonia exports to Turkey was USD 79 mln, imports from Turkey - USD 348 mln. Macedonia was one of the WB countries to first negotiate a FTA with Ukraine, removing trade restrictions in industrial and agricultural goods in 2001. Until recently the trade between the two countries was negligible. It reached statistical “significance” in the last three-four years. Here the picture. Trade Macedonia – Ukraine (2013-2015, in USD mln) 2012
2013
2014
2015
Import
86.9
93
106
52
Export
17.8
23
10
7
Balance
69.1
70
96
45
Source: State Statistic Agency
Conclusions Regarding FTAs Since signing the MoU on trade facilitation with EU, the import coverage by exports - one of the key indicators of efficiency of FTAs – has had an uneven dynamics: from 2004 to 2007 it grew from 57.5% to 62.2%; then it went down to reach 53.6% in 2009, to move up again in 2013 to almost 63%. At the same time, if we take the value of exports in 2000 as 100%, by 2010 the growth rate was 253%, and to 2014 – 373%.55 As one of the WB countries with FTAs with Ukraine as Eastern Neighborhood country, Macedonia exports did not perform well in this direction: Ukrainian imports for the period of 2012-2013 was persistently 4 to 5 time higher, although the overall political instability in Ukraine might have contributed to the picture (the overall trade volume has diminished in 2015). It remains to be seen what would be the effect of EU SAA with both countries on their mutual trade. Since joining CEFTA (and the end of the 6-year protection grace-period of the 2001 MoU with the EU), Macedonia trade was substantially liberalized to 2.26% Weighted Average Tariff (WAT), and the volume of trade ratio to GDP reached 113%. The FTAs of Macedonia were combined with persistent policy to attract FDIs in export-potential sectors. The result was that Macedonia is in 2014-2015 was on the level of the average EU export-to-GDP ratio (of roughly 40%). However, it is substantially lower than new Europe levels of Lithuania, Bulgaria, Slovenia, Czech Republic, Latvia, Estonia, Hungary and Slovakia, and close to the level of Croatia.
55
The calculation is made via the WITS portal of the World Bank. 52
The import from EU grows faster (3 times for the period 2005-2015) than Macedonian export–2.4 times for the same period. At the same time, the export growth rate is remarkable – 10% per annum to the world, and 14% - to the EU. The Macedonian export dynamic on other markets is not yet there: for 2012-2013 it WB went down from about 10% 7.5% of the export to the EU. Measured in the same manner it deteriorated on all WB markets. CEFTA market lost its attractiveness for Macedonia, the volumes of trade contracted by 80% between 2010 and 2015. Macedonia export to EFTA (after agreements entered into force) did not demonstrate a visible tendency to grow – some greater volumes were detected in 2011 and 2012, but then went down to the levels of 2010. It looks as if XRCA identified by IMF in 2013 and by us in the previous chapter of the report worked better for the EU than for other markets; in other words, one of the provisional alternatives for trade development is to achieve similar export and trade dynamics to other FTAs directions, not only EU. The main Macedonia export partners are the EU (69.2% of the total export), Kosovo – 10.7%, Serbia – 4.3%, USA – 2.9%, B&H – 2.1%. China, Russia, Albania, and Turkey are roughly on the same level of 1.4-1.6% of the total Macedonian export.
MONTENEGRO Most of the FTAs with EU (the MoU) and WB were negotiated and entered into force for Montenegro before 2006 entered into force when the country was still a part of FR Yugoslavia (often referred to as Serbia and Montenegro). In the years after independence, the main developments were on the front of EU accession: in 2010 Montenegro announced its intention to become a member of the EU and obtained an official candidate status in 2012. With regard to FTAs it signed own agreements with Ukraine and Turkey, they entered into force since 2014 and it still remains to be seen what is their impact on trade. We will attempt explaining the actual impacts of Montenegro FTAs, analyzing two periods of related developments – before the EU accession strategy of 2010 and after. Another peculiarity of Montenegro is the large share of exports in services. There is special section below, which analyzed the exports of services. FTAs: Montenegro Merchandized Trade 2006-2009 The independence necessitated some revisions of the trade statistics and coincided with the country’s entry into CEFTA. Main merchandized external trade partners of Montenegro between 2006 (the year of independence) and 2009 was the European Union, and within the EU, on the import side in order of importance were: Italy, Germany, and Greece; in terms of exports – Italy again, Greece, Hungary and Slovenia. With regard to WB, main importers were from: Serbia, B&H, and Croatia while exports went first of all to the markets Serbia, and Bosnia and Herzegovina. Montenegro is the only WB country with a pronounced negative trend of exports.
53
The size of the economy requires a special attention to micro-issues. Immediately after independence the exports to EU and CEFTA surged. One of the major factors was the privatization and foreign investment in the non-ferrous metallurgy (mostly in the country’s major aluminum factory, KAP).56 The problems of this factory are the key reason for the decline of the exports. Other FDIs did not have direct impact of export; the bulk of them were in the country’s communications monopoly. The details of the export performance (exports of goods to the world) are presented in the following table. Immediately after independence, due to effects of privatization the export grew five times. After 2007, again due to specific problems of one single enterprise, the export deteriorated by approximate 10% of the total. Montenegro Export in Goods (2005-2014, Volumes in EUR mln and Growth) 2005
2006
2007
2008
2009
2010
2011
2012
2013
2014
WB Export
76
441
453
413
275
329
453
366
375
333
[growth (%)]
N/A
482
2.7
-8.80
-33.3
19.7
37.6
-19.20
2.30
-11.30
Source: EU DG Trade
After 2009, the export-in-goods performance of Montenegro remained relatively flat. FTAs after 2010: Merchandized Exports The following graph summarizes the Montenegrin external trade. Total in-goods imports and exports of Montenegro: 2006-2014 (in USD mln)
56
In 2005, Montenegro sold KAP to CAEC, a Cyprus-based company owned by Oleg Deripaska. In 2013, after years of accumulated problems KAP bankrupted, its debts were EUR 360 mln. In June 2014, the Montengrin metal company Uniprom acquired KAP for EUR 28 mln, after about two years negotiations between CAEC and the government of Montenegro on bailing out KAP through commodity credits (first of all subsidized electricity supply). See: Dusica Tomovic, Montenegro Sells Bankrupt Aluminum Plant, Balkan Insight, 11 June 2014. 54
Source: WITS, World Bank
If we take only the export to EU after 2010, we will see that the Montenegro dynamics replicates that of the rest of the WB countries, the export growth is not extraordinary but positive; on annual basis it is: 12.5% for 2011, 12% - for 2012, - 3.3% for 2013, and 4% for 2014. To some extend it is by resumed exports of aluminum: in 2011 and 2012, the largest export commodity was "unwrought aluminum" but from 2011 to 2013 its volume went down 2.5 times. A quarter of the decline was due to the drop in the price,57 another factor, was, perhaps, KAP. (In 2013, the prime export commodity was already “electrical energy”. As mentioned in the chapter on XRCA, other lead commodities in 2013 were: "Mineral fuels, lubricants", "goods classified chiefly by material" (SITC section 6) and "crude materials + animal and vegetable oils with respective 29, 27.3 and 16.6% of exported goods. When we take after crisis years and merchandized exports to EU, the picture is gradually improving in spite the problems with the aluminum factory. Montenegro Exports to EU (All Goods): 2010-2014 Year 2010 2011 Export to EU (EUR mln) 625 714
2012 810
2013 784
2014 817
Source: EUROSTAT, international trade
Another peculiarity of Montenegro FTAs is the relatively important place of CEFTA (in other words – of the Western Balkan countries) in the overall context of FTA. In 2014 MONSTAT reported that the main partners in merchandized exports were: Serbia (EUR 80 mln), Italia (EUR 34.8 mln) and Republic of Croatia (EUR 33.1 mln), while imports - Serbia (EUR 480.7 mln), Greece (EUR 144.5 mln), and China (EUR 132.7 mln). The highest external trade trend was with CEFTA and EU countries. The value of exported goods was EUR 333.2 mln, what is 11.3% less
57
See: 5 Year Aluminum Prices and Price Charts (2011-2015), InvestMine: http://www.infomine.com/investment/metal-prices/aluminum/5-year/ . 55
compared to the same period of previous year, and imports are EUR 1,784.2 mln (0.6% more than in 2013). The coverage of import by export was 18.7% in 2014 lower than in 2013 (21.2%). The following table summarizes the developments in the last two years. Recent Developments of Montenegrin Merchandized Export: 2014-2015 (by Partner) Export 2014
Export 2015
%
Volume (EUR mln)
%
Volume (EUR mln)
WORLD
100.0
333
100.0
317.17
Europe
95.4
317
91.3
289.52
EU-28
35.8
119
35.7
113.18
CEFTA
45.5
151
43.3
137.48
USA
0.2
0.80
0.4
1.28
China
0.8
2.56
2.5
7.90
Russia
1.2
4.02
0.8
2.64
Switzerland
1.1
3.65
1.2
3.66
Japan
0.6
1.83
1.0
3.13
Turkey
1.7
5.69
6.7
21.36
Source: MONSTAT
In the last two years, the merchandized export to Europe remained unchanged, it slightly contracted with CEFTA, and in all other direction, irrespectively small shares of respective markets in the total exports of goods, improved, most markedly for Turkey. At the same time merchandized trade balance remained negative: with regard to Europe as geographic region – slightly deteriorated, with EU – improved by almost EUR 50 mln, seemingly at the expense of deepening of the gap between exports and imports with CEFTA and China. This situation is shown in the next table. TRADE BALANCE (EUR mln) 2014
2015
WORLD
-1 451,05
-1 524,35
Europe
-1 224,35
-1 233,50
EU-28
-697,41
-646,59
CEFTA
-517,83
-560,99
USA
-14,56
-16,19
China
-130,18
-181,69
Russia
0,83
-1,71
Switzerland
-8,89
-8,17
Japan
-16,67
-13,47
Turkey
-30,69
-21,38
Source: MONSTAT
FTAs and Montenegro Export of Services 56
The picture substantially improves, and the balance of trade looks much better when we include the export in services, mostly travel and tourism. Montenegro export of services in 2000-2006 averaged around EUR 250 mln per annum, in 2007 it reaches the level of EUR 1 bln, and then gradually grew by 30%. Montenegro Export of Services in 2008-2015 (in EUR mln) Export service All services
2008
2009
2010
2011
2012
2013
2014
2015
1,099.5 1,033.2 1,041.9 1,274.2 1,264.5 1,401.5 1,368.5 1,346.6
Travel
754.7
744.9
713.14 875.25
809.3
Travel (%)
68.6%
72.1%
68.5%
64%
68.7%
880.5
907.7
902.7
62,83% 66,30% 67,04%
Source: Trade Maps.
The Montenegrin export is dominated by travel and tourism (fluctuating around 67% of all services). The trade balance in services is positive, with average surplus since 2007 between 40 and 50%. It is difficult to construct causality between the FTAs and the export of services: it is obvious that what was in-country travel for Serbia and Montenegro has become an international exchange after independence was announced in mid-2006. The same is true Conclusions Regarding FTAs
The main difference between WB countries and Montenegro is the export of services. Part of it is to be explained by the declaration of independence in 2006. It is concentrated in tourism, construction and financial services do not play such a significant, although they are liberalized from 2006 onwards and Montenegro has the advantage of a country of no domestic monetary policies. At the same time it is only Montenegro from WB countries, for which the statistics on trade in services is significant (and readily available for long periods of time). It seems that Montenegro has the highest ratio of EU trade and exports in particular than any other Balkan country; the same is true for CEFTA. Irrespectively delays and statistical adjustments and corrections due to relatively recent separation from FR Yugoslavia, the economic and trade statistics suggest that the FTAs with European countries have been utilized effectively. The FTAs inherited from Yugoslav times (mid-2000, with Turkey and Ukraine) are yet to be fully implemented but do not seem to have had an impact on Montenegro trade. The merchandized export is used to be dominated by one exporter. Since 2013 this is no longer the case. But the industrial base of Montenegro is such that, first, it is almost impossible to envisage a substitute to aluminum export and the overall merchandized export of the country will depend in the near future on the fate of this exporter.
SERBIA FTAs with Russia and EU and Other Countries Serbia along with Bosnia and Herzegovina and Belarus are the only countries in Europe that have not joined WTO.
57
Serbia FTAs with Balkans has been negotiated and enforced simultaneously with other countries – the MoU with the EU (2001) and CEFTA (2007), in particular. It is the country which deliberately follow a policy of securing FTAs with eastern neighbors of Serbia like Russia and members of the EAEU. These FTAs were long cultivated and much hoped for;58 we pay a special attention to them. We think that Serbia’s observer status with WTO is no impediment to normal functioning of FTAs and the economy in general. The only remain in 2015 stumbling impediment to full WTO membership is adoption of a law that removes the prohibition on GMO trade (GMO cultivation is a matter of national regulation). What matters is the fact that WTO membership is a pre-condition for EU membership. This process is regulated by the Interim Agreement between Serbia and the EU (in force since February 2010). However, agreement with Russia precedes the trade with the Balkans and the EU: while the FTA with Russia was practically in place between FR Yugoslavia and Russian Federation (RF) since 1997, as Protocol of the Rules of Trade, and the agreement was ratified by the countries in 2000, the MoU with EU and WB came into force later that the agreements with RF. The Protocol is part of the agreement as is being revised annually. It looks as if Russia’s initiative to set a custom union, that later has materialized as EAEU, with Belarus and Kazakhstan has delayed the FTAs with these two countries: the one with Belarus was signed in March 2009 and entered into force from 2013; that with Kazakhstan was enforced in 2010. In general, the TFA with RF is a pattern followed by these two agreements but they seem technically more stable, the supporting protocols are not reviewed that often. The three FTAs do not apply to trade in passenger cars, tractors, buses and tires, and automobile parts, sugar, alcohol and cigarettes. The RF FTA stipulates that goods produced in Serbia, i.e. which have at least 51% value added in the country, are considered of Serbian origin and exported to Russian Federation customs free. The only tariff charged is the customs record keeping tariff, amounting to a 1% value. The list of protected products (last updated in March 2012) includes the following goods: poultry and edible waste, some sorts of cheese, sugar, sparkling wine, ethyl-alcohol, tobacco, cotton yarn and fabric, some types of compressors, tractors and new and used passenger cars. For exports to Russian Federation, the FORM CT2 Certificate is required as a proof of goods origin. The FTAs with Turkey since (2003) and EFTA (2010) follow the general rules of free trade with EU. The agreement with Turkey originally freed all Serbian industrial products of customs duties. Like with other WB, the imports presuppose a six-year period for freeing them of tariffs. (2016 is the first year of totally free import from Turkey.) Actual Trade with Russia Serbia is the only country non-ex-Soviet country with a FTA with RF in place. There is little or unreliable information on trade in services between Serbia and EAEU. Here we focus only on trade-ingoods statistics.
58
See a summary of this hope in: Serbia’s free trade agreements with Turkey and Russia creates a golden opportunity, Bilaterals.Org, 8 August 2013, at: http://www.bilaterals.org/?serbia-s-free-trade-agreements&lang=en. The official justification of the policy was the abstract possibility to a vast post-Soviet market: this option is still used to advertise Serbia – see The Entrepreneurs’ Guide to Serbian Customs, on the webpage of the Customs in English (sponsored by the Kingdom of the Netherlands). 58
The Russian share in the Serbia import is 11.3%; the EU’s – 63.5%. In 2015, the RF is the third in importance Serbia export market (on average 3 times more important than for other Balkan countries) – with its share of 7%, while the EU leads with 64.7% and second is B&H – with 8.8%.59 The dynamics in the last five years is parallel and opposite. The exports we increasing until 2013 – by 40.6%, and import from Russia declined by 33%. Then, after 2013 the export decline and this development has nothing to do with embargoes exchanged between EU/USA and Russia: the export of edible fruit, nuts, peel of citrus fruit, melons increased by more than 50% but decline in almost all other categories. The import seem is stable in volumes but subject to conjecture. The import of mineral fuels, oils, distillation products, etc. increased but that of ferrous and non-ferrous metals, chemical and many other commodities decreased. Serbia Export to and Import from Russia (in EUR bln) 2011
2012
2013
2014
2015
Exports
0.569
0.674
0.800
0,774
0.653
Imports
1,905.63
1,614.67
1,433.2
1,760.66
1,575.27
Source: TradeMap.
In relation to Kazakhstan, the situation is the following: the imports of fuels decrease more than six times between 2013 and 2015, trade being insignificant in all other commodities. (The imports from Kazakhstan for the same period declines in value from EUR 668 mln to EUR 101 mln.) The Serbia exports double to about EUR 21 mln for the last three years, but remain insignificant as a trade value is five times smaller than the imports from Kazakhstan. After the FTA with Belarus entered into force, the Serbian export declined by 46%, imports – by 16%. Comparing trade flows between Serbia and these three countries we attempted to identify some correlation with the trade dynamics of these countries within EAEU, since the custom union was signed on 29 May 2014 and entered into force of January 1, 2015. The statistically significant change (we assume it to be a change of 10% plus or minus, in an indicator) is the increase of merchandized export of Kazakhstan to RF. The period of EAEU operation is too short for hard evidence, but it seems that anticipation of the Union might have played a role, or, in 2015, Kazakh exporters found it beneficial to increase the shipment and sales to Russia. 60 FTAs and Serbian Economy Like most Europe emerging market economies, Serbia GDP annual growth rate – a bit more uneven as a positive dynamic in comparison to EU new member states – is diminishing in the last ten years. In 2006, 2007 and 2008 it had its peaks of between 6 and 7 and even a notch above 8% of GRP, then there was a relatively61 sharp, but typical for all Balkan countries – including Bulgaria and Romania contraction of 4.6%. What is not typical is that after 2010 annual growth rates remained unstable – in some periods dropping again to below -2 and even -4% of GDP. For other WB countries the trend was, by and large, of not rapid but steady growth.
59
Source: EU DG Trade and TradeMap. It should be noted that Kazakhstan is a land-locked country: perishable goods (especially not-canned foods and vegetables) are often shipped by air, container and rail transport has two routs – via Southern Caucasus where Kazakh gas giant owns the gas infrastructure in Georgia, via Russia highways, railway and pipelines controlled by RF state-owned companies. 61 In different times of the early 1990s, GDP downturns were -21 and -15%, or -30% in 1996. 60
59
One of the hopeful scenarios behind Serbia FTA policy was to both boost FDIs and exports simultaneously. The following graph demonstrates that FDI inflow, after major privatization waves dispersed in 20062007, seems not correlated to major improvement of exports – FDI inflow remains unchanged in annual rate, while exports trend is steadily upwards.
FTAs and EU and CEFTA Irrespectively the intentions of penetrating the post-Soviet markets, the overall picture of Serbian trade is relatively common for all WB Balkan countries. The export and imports develop in parallel, ups and downs coincide with the years of global economic recession, and the trade balance, impacted by these factors, is relatively stable but with some unstable, although clear gap-narrowing trend. The following graph, borrowed from the Statistical Office of Serbia demonstrates these developments very clearly.
60
For political reasons (UN sanctions were lifted in 2000, then different delays were caused by noncooperation with The Hague Tribunal) Serbia applied the signed the SAA later and it took longer to have all member states ratification. The process was finalized in 2013 with the above mentioned Interim Agreement with EU on Trade and Trade Related Matters (deepening and enforcing the 2001 MoU on Trade Liberalization and Facilitation) did work: both the global and EU increased substantially, the exports – about three time, the imports almost doubled. As explained above, Serbia’s strategy to conclude as many FTAs with countries outside the EU as possible did not improve the trade in that direction. This policy resulted, rather, in attracting FDIs from the RF in major oil refineries, gas distribution networks and gasoline retail chain.62 Although EU trade has a leading share in terms of number of consumers the US. Russian and other smaller markets are not without a perspective and cover around 600 million people. The situation with trade in 2014 was the following:
64% of total trade in 2014 is generated with EU 28; Trade with Russia reaches 9.5%; Far weaker is trade with Turkey (2.3%) and USA (1.7%).
The trade capacity is not yet achieved, perhaps, for relatively late FTAs implementation. On the other hand, Serbia trade with the EU is far below the regions’ average. The above review of the trade with EAEU does not preclude that, in the future, the access to non-EU market of more than 1 billion customers might become a valuable alternative after the capacity and opportunities of trading with EU reach some turning point. However, such alternative is not an immediate prospect: the EAEU trade with Serbia shows no positive signs for the above-said reasons. It looks as if EAEU merchants follow the major business logic and prefer trading with bigger and richer markets of the EU and North America, irrespectively recent sanction on RF after the annexation of Crimea. The table below shows that in relation to EU Serbia trade follows the common WB pattern. The growth of export is very rapid at the beginning of the period, with rates somewhat more advantageous for
62
In the latter markets, Russian companies compete with Austrian and Hungarian retailors. 61
Serbia. The periods of decline of exports to the EU are compensated with higher rates in the next years and by somewhat lower growth rates of imports. Serbia Export and Import to/from EU: 2005-2015 in EUR mln Year
Export (€ mln)
Growth (%)
2005
1195
2006
2869
140.1
5898
120.4
2007
3931
0,37
8644
46.5
2008
4335
10.3
9700
12.2
2009
3436
-20.8
7071
-27.1
2010
4349
26.6
7881
11.5
2011
5147
18.4
9116
15.7
2012
5053
-1.8
9659
6
2013
6588
30.4
9928
2.8
2015
7106
7.9
10357
4.3
2015
7902
11.2
11175
7.9
Import (€ mln)
Growth (%)
2677
Source: EU DG Trade.
If we compare the export values to the list of EAEU “protection” commodities (according to SITC) with Serbia’s XRCA and values of exports, the following items had the greatest share of exports: -
Road vehicles (EUR 1.6 billion, 13.8% of total exports) – protected by RF FTA, Electrical machinery, units and appliances (EUR 873.9 million, 7.8% of total exports), Cereals and cereal products (EUR 594.6 million, 5.3% of total exports) – subject to reviewed protocols of the FTA with Russia, Fruits and vegetables (EUR 564.0 million, 5.0% of total exports) – also subject to same procedure, Articles of apparel and clothing accessories (EUR473.1 million, 4.2% of total exports), Manufactures of metals (EUR466.5 million, 4.2% of total exports), Non-ferrous metals (EUR443.7 million, 4.0% of total exports), Miscellaneous manufactured articles (EUR407.1 million, 3.6% of total exports), Iron and steel (EUR369.6 million, 3.3% of total exports), And rubber products (EUR359.2 million, 3.2% of total exports).
It looks as if lesser openness of Russia markets motivate the three of the top four export categories (approximately 1/5 of the total exports’ value) to seek alternatives on other markets. On CEFTA front, the dynamics is also typical, Serbia, however, trades more with CEFTA (other WB countries) than it is typical. CEFTA statistics tells us that:
Serbia intra-CEFTA share of exports remains relatively stable since 2010, the growth is from the level of EUR 2.1 bln to about 2.4 bln in 2014 and 2015; Exports to Russia, Germany and Italy declines after 2013 (but is about two times larger to Italy and Germany); The exports to countries like Austria, Bulgaria, Croatia, France, Greece, Hungary, Romania, Slovenia, and EFTA and Turkey remained relatively unchanged in the last five years.
62
According to EU DG Trade, the CEFTA countries among top ten Serbia’s export partners, with larger shares than for any other WB trade within WB/CEFTA in 2015 are the following: B&H – 8.8% of the total exports (third place), Montenegro – 5.1% (fourth place), and Macedonia – 4% (fifth place). (USA in 2015 come sixth, with 2.1% of the total export, followed by Turkey – 1.6%, Albania (0.8%), Ukraine and Switzerland with 0.7% each. We have already noticed above that the EU share in Serbia’s export is 64.7%, and RF – 7% in 2015. The picture for individual EU and other countries is available from Michigan State University database for 2014. Serbia Top Ten Export Partners in 2014 Partners
Export Volume (USD bln)
Italy
2,577.2
Germany
1,773.2
B&H
1,319.2
Russia
1,029.1
Romania
0,829.6
Montenegro
0.756.1
Macedonia
0.603.3
Slovenia
0,471.1
Croatia
0.459
France
0,418
Source: GlobalEdge
Conclusion Regarding Serbia FTAs -
Unlike other WB countries, in Serbia FDIs and exports dynamics seem disconnected in the last four years. Only a special and detailed analysis may explain this peculiarity. The following graph from Trading Economics just indicates the phenomenon.
63
Until 2012, FDIs and capital accumulation have a parallel dynamic with the exports; then the picture changes. -
-
The policy to approach ex-Soviet markets did not bring out expected results so far. It remains to be seen until when the internal preferential regimes and general terms and costs of trade within EUEA keep the member states exporters more focused on trading between themselves and with the rest of the world and EU rather than Serbia. Serbia FTA with Turkey has just reached the stage of almost complete liberalization of merchandized trade in industry areas, for the time being this trade was among top ten for exports but it is not yet clear how effective will be the FTA. As with other WB countries the Interim Agreement on trade matters with the EU and CEFTA, these for Serbia too seem to work well in the direction of greater openness and prosperity.
CONCLUSIONS FTAS AND TRADE FACILITATION The indicator of Weight Average Tariff (WAT) allows for understanding how much a given country’s trade in goods or services tariffs contribute to the actual openness of the economy of that country, as WAT is calculated on the all trade flow for a given (past) period of time. The specific country ratio of trade to GDP tells us to what extend the opened penetrates the economy of that country. In 1999, only one Balkan economy (Bulgaria) had a ratio of trade to GDP above 90%, the second was Macedonia, with 87%. Macedonia mirrors the size of neighboring economies of B&H (76%) or Albania (32%); it seems that the Greek embargo of Macedonia and the Bosnian wars (both in the period between 1992 and 1995) were the main reasons for that comparatively high degrees of openness. Serbia and Montenegro (FR Yugoslavia) were three time less open than Bulgaria (91%) and two times less open than Croatia or Romania (60% and 56% respectively). If we exclude the three today’s EU member states (Bulgaria, Croatia and Romania), the openness of the trade of the countries which constitute now the WB, the average openness would have been 32%. Again in 1999, the average import tariff (not weighted) of these seven Balkan countries was 15.1%; the most “protectionist” was FR Yugoslavia, with 20.4% (Romania was very close – 19.8%), the least protected was Croatia – 12% average import tariff. If we excluded the EU member, this indicator in 1999 would have been 14.7% In the three tables below we give these indicators for 2014 (the last year WAT is available for all countries), according to World Bank’s World Integrated Trade Solution. WB countries Trade to GDP Ratio and Weighted Average Tariff (2014) Country
Weighted Average Tariff
Trade/GDP
Albania
1.14
75.5
B&H
2.58
90.8
Croatia*
1.33
90.5
Macedonia
2.26
112.96
Montenegro
3.63
N/A
Serbia
N/A
N/A
Source: WITS, *after July 1, 2013 applies the EU tariffs.
64
In 2014, there is no data on Serbia63 and indicator for Croatia is for the mid-2013. The WAT for WB, including Croatia is 2.18%. If we exclude Croatia it is 1.98%. The progress is obvious: 16.6 times reduction of the weighted average tariff, or protectionism. Simultaneously, the WB countries have become more integrated with the world. Their average ratio of trade to GDP is 82.4%. If we compare WB with EN countries, Russia and Turkey, the Balkans are more trading and more open: the average WAT for those countries is 3.7% (almost two times less open than WB) and the WB are more trading nations than those countries. WAT and Trade to GDP Ratio for Non-EU (EN) Countries (2014) Weighted Average Tariff (%)
Trade (% of GDP)
Armenia
2.39
75.38
Azerbaijan
5.23
69.51
Moldova
2.53
119.65
Russia
6.21
51.32
Ukraine
2.06
102.4
Turkey
…
59.92
Source: WITS, *applies EU tariffs.
We should note, however, that the smaller ratios of trade to GDP for Russia and Turkey are to be explained by the sizes of their economies, which presuppose some priority of the domestic markets. The situation with relatively higher (although tolerant) level of WAT for Azerbaijan is associated with the fact that this is an economy based on natural resources. Armenia, Moldova and Ukraine WATs indicate that they are very close to the level of openness of the Balkan countries. And the ratios of trade to GDP in 2014 for Moldova and Ukraine are higher than for WB countries (except Macedonia). A factor contribution to trade facilitation and openness is the fact that they enforced DCFTAs with the EU – Moldova from June 2013, Ukraine “provisionally applied since November 2014”64. The size of the Armenian economy and its WAT would presuppose higher ratio of trade to GDP. But this is not the case because of diplomatic disputes and closed borders with Turkey and Azerbaijan. EU New Member States Trade/GDP Ratio in 2014 Selected Trade (% of GDP) Countries Bulgaria 131.09 Croatia
90.51
Hungary
171.24
Romania
82.17
Slovak Republic
180.06
Slovenia
145.18
63
It is not clear why data for Serbia is missing from WITS data for 2013. WTO country profiles give information on Serbia’s WAT in 2013 – it is 6.1%, a considerable progress as well. 64 See: EU DG Trade: http://ec.europa.eu/trade/policy/countries-and-regions/countries/ukraine/ 65
Source: WITS
The comparison of the WB countries with their ex-Communist neighbors now EU members is also significant. These countries are comparable to WB as sizes of the economies, similar reform were undertaken in the past, during the years they were core trading partners of the WB, Croatia and Slovenia were part of ex-Yugoslavia, had their wars with Serbia, etc. But the average ratio to GDP of these new member states is 50% higher than the Western Balkans (142.2%). In this group Romania stands out as relatively big market of about 20 million, Croatia is the most recent member. It is reasonable to assume that CEFTA and EU SAA for WB countries will result in further reduction of trade tariffs and increase of ratios of trade to GDP. XRCA and the Trade Within WB The above analysis of CEFTA effects on the trade within the Balkans demonstrated that: -
Irrespectively the original objective FTAs to facilitate trade with the Balkans themselves, the intra-WB trade did not achieve any extraordinary volumes since 2001; The WB countries trade first with the EU and then with one another; If the progress was made, it was at the early stages; after enforcing CEFTA in 2007, the intratrade remained relatively unchanged, especially after 2010; For countries like Serbia and Montenegro WB markets are still very important, and this is partially due to the fact that they were one state until 2006; For the other three countries WB market, as measured through values of merchandized trade, is at least twice less important than for Serbia and Montenegro and the volumes traded often decline or more distant countries remain or become more important.
The above conclusions are supported by the Statistical attachment to this report. The table, based on the RCA analysis, allow a better understanding of the trade arrangement the actual trade constellations of the WB countries.
66
Top four XRCA for WB (excluding Kosovo) Albania Manufacturing services on physical inputs owned by others Footwear, gaiters and the like, parts thereof Salt, sulphur, earth, stone, plaster, lime and cement
Travel
B&H
1899
Manufacturing services on physical inputs owned by others
1351
Arms and ammunition, parts and accessories thereof
827
Footwear, gaiters and the like, parts thereof
663
Wood and articles of wood, wood charcoal
Macedonia
2149
Manufacturing services on physical inputs owned by others
1440
Miscellaneous chemical products
980
Tobacco and manufactured tobacco substitutes
945
Articles of apparel, accessories, not knit or crochet
Montenegro
2040
Explosives, pyrotechnics, matches, pyrophorics, etc.
1628
Travel
Serbia
1312
Edible fruit, nuts, peel of citrus fruit, melons
624
1002
Cereals
610
586
518
1148
Construction
910
Arms and ammunition, parts and accessories thereof
807
Personal, cultural, and recreational services
894
Construction
Source: TradeMap, own calculations
-
-
-
-
The first three comparatively viable export sectors for Albania, B&H and Macedonia coincide in both substance and scores. The more details segmentation of trade data (see the Statistical Attachment) does not change the picture, although specialization is underway, involving FDIs. However, this commonality of XRCA suggest that for the producers and exporters from these countries it makes sense penetrating other markets. Arms and ammunition, etc., as the second XRCA sector for B&H and third for Serbia coincide, perhaps due to the war background of both countries. This constellation also suggest that exports in arms (regulated heavily for understandable reasons) should be directed to other markets outside the Balkans. In services, travel is important for Albania (fourth trading sector) and Montenegro (second sector). It should be noted that the other three countries are landlocked, so these two attract summer travels from neighboring countries, and Albania from Kosovo. At the same time, FTAs of the WB countries, lowering the tariffs tend to increase value added in industrial sectors but it takes time. The fact that countries and markets like Italy and Germany often benefit from FTAs or CEFTA is a part of a restructuring and company specialization process. The FTAs and the trade flows, especially exports are associated with foreign direct investment in general and by the main trading partners in particular. Only Serbia’s last four years of export dynamics suggest some disconnect between investment and exports.
The literature on the Balkan FTAs also suggest that there are other factors that make it difficult to expect quick fixes in value-added changes only because of FTA. Marjan Petreski, Branimir Jovanović and
67
Igor Velickovski, working jointly for the WIIW Balkan Observatory but applying a different methodology (WTO data on simple average tariffs) arrive at similar conclusions.65 Institutional Benefits The MoU and the SAA with the EU required that FTAs level the playground for all companies, improve rules of origin, documentation, reporting, statistics and cooperation between WB countries. At different pace, the countries have achieved best reporting (especially in the area of rules of origin) and statistical standards. At the same time irrespectively of WTO membership status or occasional impediments to full implementation of the SAAs, FTAs for WB (including CEFTA) have secured trade and export development independently of political disputes. Even when some specific FTA policies like those of Serbia fail to achieve stated objectives of improving the trade with other markets, the existing network of FTAs, CEFTA and SAAs are sufficiently effective in compensation for lost markets and in supporting the overall process of trade liberalization and facilitation. Another important contribution of the WB FTAs is that they served as the basis for dealing with other troubled regions, e.g. Ukraine after 2013.
65
See: Marjan Petreski, Branimir Jovanović and Igor Velickovski, Tariff-induced (de)industrialization in transition economies: A comparative analysis, WIIW Balkan Observatory, Working Papers, No 16, October 2015, at: http://wiiw.ac.at/tariff-induced-de-industrialization-in-transition-economies-a-comparative-analysis-dlp-3898.pdf 68
CONCLUSIONS REGARDING WB FTAS AND THE TRADE WITH AND NEIGHBORHOOD COUNTRIES From Eastern Partnership to EAEU (current situation) Background Originally, in 2006, eight post-Soviet countries were offered a cooperation under EU framework program of Eastern Neighborhood Partnership (ENP or EN) - Armenia, Azerbaijan, Belarus, Georgia, Kazakhstan, Moldova, Russia, and Ukraine. Kazakhstan expressed doubts and preferred bi-lateral relations. As part of ENP all the countries were offered FTAs, the idea eventually evolved to Deep and Comprehensive FTAs and by the end of 2009 all were envisaged as DCFTA hopefuls. Gradually, however, similar to Kazakhstan policies were applied by other countries: Belarus, Kazakhstan and Russia - that eventually formed EAEU, in May 2014 and later (in January and December 2015) were joined by Armenia and the Kyrgyz Republic. The EAEU philosophy is to increase experts from the member states and facilitate the trade between them. For the time being neither of this is happening. Actual Current picture of EAEU trade As explained above, in the paragraph on Serbia’s actual trade with Russia, the 2015 trade within the EAEU increased only between Kazakhstan and Russia in petrol and raw materials. The trade statistics for 2015 does not give sufficient information on the prospects of the Union. It is very likely that, for the time being it suffers from political developments and reduces the gains from trade for the smaller and land-locked members in Central Asia and the Caucasus. There are two sets of reasons for the mixed results and prospects – conjectural and pure policy ones, including the design if the trade liberalization and facilitation. With the decline on of the oil prices, values of trade turnovers plummeted. The liberalization of the trade with the Union is not likely to benefit already trading countries Belarus (115.1% trade to GDP in 2014) and especially Kyrgyzstan (134.4% trade to GDP in 2013) – after joining the EAEU it was obliged to stop re-exports from its Eastern neighbor China. In 2015, the total trade turnover between Kyrgyzstan and Kazakhstan contracted by 50%. The recession in Russia and Kazakhstan has a negative impact on other countries. These two countries has devalued their currencies to cope with downturn in oil prices. And the trade with Ukraine and Turkey is likely to suffer because of the Russian conflict with these countries. According to Trading Economics (which uses) data from statistics offices of the member states), the export dynamics since the monthly peaks of 2014 to monthly averages in 2016 is the following: -
In Armenia it increased from USD 120 mln a month to USD 135 mln a month in 2016 (the trend is positive); In Belarus it went down from USD 3.2 bln a month to 1.8 bln a month in 2015 (the trend is negative); In Kazakhstan it went down from USD 8.2 bln a month to USD 2.5 bln a month in 2016 (the trend is negative); In Belarus it went down from USD 250 mln a month to USD 75 mln a month in 2016 (the trend is negative); And in Russia it contracted: from USD 45 bln to USD 25 bln (the trend is negative).
69
From 2014 to 2015, Armenian trade with Russia declined: exports by 36%, imports from the world – by 38%; very similar is the data on Armenian trade with Kazakhstan, with Belarus the decline of export is 40; with Kyrgyzstan the export increased by 11. For the same period, the trade of Belarus behaved as follows: exports to Russia decreased by almost 50%, while imports from the world – by 38%; the exports to Armenia remained unchanged, with Kazakhstan export declined by 40%, and the exports to the Kyrgyz Republic shrank by 36%.. The Kyrgyz and Kazakh story is unclear – there is no data for 2014 and 2015 on international trade data portals. DCFTA and the EN partners The process of negotiating and singing DCFTAs has taken, with some adjustments under the pressure of circumstances, six-seven years, from 2009 to 2016. The time since DCFTAs were enforced is too short to provide and statistical evidence on how they affect real trade between EU and EN countries. Then, the Ukraine case (we summarize key developments in a separate section below) demonstrated and ad hoc evolution on the eve and after the annexation of Crimea by the Russian Federation. Here we list specific expectations originally associated with DCFTAs, compare them with the process of the Balkan FTAs, and formulate the findings of the analysis. DCFTA as a unified, one-size-fits-all approach was first announced in 2006-2007, passed different assessment tests by EU subcontractors and independent experts in 2007 and 2008, and then was to Georgia and other countries. The independent assessments contradicted one another, some experts overestimated potential positive effects,66 and others expressed a reasonable skepticism and tried to justify it.67 Georgia DCFTA was the first to be enforced in June 2014), then Moldova (October 2014) and Ukraine (from January 2016). The examples of Georgia and Ukraine may eventually prove, the DCFTAs may achieve the positive effects, similar to those of the FTAs with the Balkan countries. However, there are several general features that make the DCFTAs process less effective, at least as an original design in comparison to Balkan FTAs. First, the DCFTAs are not based on the policy of autonomous trade preferences, which was applied to WB since 2001. They basically transfer the non-tariff costs of trade to EN countries. In fact, the Commission imposed broad range preconditions for the FTA with EN countries:
Adoption of the EU Acquis in technical barriers to trade; Implementation of sanitary and Phytosanitary measures; Fixing the intellectual property rights in accordance with EU practice, and Adjusting the competition policy with respective amendments of countries legal frameworks.
66
See: ECORYS-CASE, Trade Sustainability Impact Assessment for the FTA between the EU and Ukraine within the Enhanced Agreement, Client: European Commission, DG-Trade, Rotterdam, (Annexes) 13 December 2007 and Final Report 17 December 2007, report at: http://trade.ec.europa.eu/doclib/docs/2008/january/tradoc_137597.pdf , pp. 19-40. 67 Pierre Garello, Jean-Marc, Thierry Sebagh and Eka Avaliani, Feasibility Study: EU-Georgia FTA, Tbilisi, UNDP, 2007. 70
Second, they the Commission asked the EN countries to change other legal frameworks and implement EU internal market regulations, beyond narrowly defined trade matters. In the EU itself the respective frameworks developed over time – from 1970s to 1990s, for the new member state these harmonization with the Acquis in 1998-2004 and 2007 did mean first of all a process of formal integration with and joining the EU. The EN countries had never been offered a membership in the Union. This effort required from EN countries non-trivial costs of compliance,68 with generally unclear benefits69 and dim to non-existing prospects of joining the EU. Some trade experts found that for Georgia for instance, such requirements made “no attempt to identify those which make sound economic sense for Georgia (and indeed for the Eastern neighbors in general)”; that “the burdensome regulatory changes imposed on Georgia are equivalent to taxing Georgian production—endangering her growth, the sustainability of her reforms and of her successful fight against corruption which is so crucial for her long term development”.70 Besides being “a bad development policy”, continue Messerlin, Emerson, Jandieri and Le Vernoy, the EU Commissions’ is also “a bad commercial policy for the EU since it would lead to an expansion of the trade between Georgia and non-EU countries, rather than between Georgia and the EU.” Georgian consumers would be induced to import what Georgian producers could no longer sell because of EU norms; and their low incomes will induce them to turn to imports from non-EU sources that are less expensive than those from the EU.” By 2012, there were hopes that Ukraine would become a role model DCFTA for the EN region. Then its merchandized trade with the EU was between 30% and 50% of total trade but the protectionism of the EU was believed to be an impediment for EN exports to the EU. Ukraine and Georgia trade with the EU was regulated by the Generalized System of Preferences (GSP) and MFN approach, while Moldova was treated similarly to Balkan countries by autonomous trade preferences.71 Since DCFTA had the above mentioned deficiencies, the EN partnership program was redesigned to include broader arrangements, called Association Agreements (AA) – a treaty typically signed with non-members state to enhance cooperation with the Union. At the time of Ukrainian AA was ripe for discussion in 2012 (along with those with Georgia and Moldova), the EU had already more than 20 such agreements and seven were under negotiation. It did not have a major impact on the nature of DCFTA itself. The situation changed in 2013, with the protest in Kiev and in 2014 as a response to Crimean crisis and it affected the overall design of the DCFTA. Ukraine as a Special Case
68
See the only attempt to measure those at an early stage of DCFTA process: Veliko Dimitrov (IME), Cost of Institutional Harmonization in ENP Countries, CASE Network, Studies and Analyses No. 388, May 2009, at: http://www.case-research.eu/upload/publikacja_plik/25386205_sa388.pdf . 69 In response to Dimitrov (whose calculations of compliance costs were made in 2007) his colleagues publish an attempt to measure the costs against benefits, see: Anna Kolesnichenko, Institutional Harmonization and Its Costs and Benefits in the Context of EU Cooperation with Its Neighbors. An overview, CASE Network, Studies and Analyses No. 387, May 2009, pp. 37-39, at: http://www.case-research.eu/en/node/55640. 70 Patrick A. Messerlin, Michael Emerson, Gia Jandieri and Alexadre Le Vernoy, An Appraisal of EU Trade Policy towards Eastern Neighbors: the Case of Georgia, Groupe d’economie mondiale – Paris, CEPS – Brussels, 2011, p. i. Another, very optimistic view about DCFTA process, reviewing the case with Ukraine, was published in 2012: Veronika Movchan, Volodymyr Shportyuk, EU-Ukraine DCFTA: the Model for Eastern Partnership Regional Trade Cooperation, CASE Network, Studies and Analyses No. 445, October 2012, at: http://www.caseresearch.eu/en/node/57857 . 71 See: Veronika Movchan, Volodymyr Shportyuk, EU-Ukraine DCFTA. 71
In 2010 Ukrainian exports of goods and services accounted for 50.2% of GDP in 2010, the merchandized trade turnover had increased by 250% between 1996 and 2010. “Between 1996 and 2007, the share of the EU had increased from 24.4% to 32.9% of total turnover, while the share of Russia, Belarus and Kazakhstan had reduced from 49.3% to 32.4%.”72 The growth rate in exports with the EU for the period between 1996 and 2010 was almost 290%, for 2000-2010 – 170%. The growth of trade with the EU happened not at the expense of the Russia, Belarus of Kazakhstan, to which markets Ukrainian exports grew for the same periods by, respectively, 161% and 333% (starting from a higher level of economic and trade integration). The difference was thanks to the increasing value added of the trade with the EU. More importantly, however, the Ukrainian inflow of FDIs originated in the EU amounting up to 78.8% of total FDIs; the FDI inflow from Russia – 7.6% in the end of 2010.73 Then, as already mentioned, the draft DCFTA for Ukraine required numerous regulatory amendments and, thus, was politically more complicated than acting FTAs and provisional agreements with Belarus, Kazakhstan and RF. According to DG Trade, Ukrainian exports to the EU were subject to GPS, granted by the EU to Ukraine in 1993. In 2010, Ukraine's use of GPS reached a high level of 72.2% of the eligible products, and the country ranked 12th, among the most effective users of GPS with the EU. Ukraine's primary exports to the EU were and still are iron, steel, mining products, agricultural products, and machinery. EU exports to Ukraine were dominated by machinery and transport equipment, chemicals, and manufactured goods. The export to the EU in 2011 increased by 31%. 2010-2013 merchandized trade between Ukraine and EU (EUR bln) Year
EU Imports
EU Exports
Balance
2010
11.5
17.4
5.9
2011
15.1
21.2
6.2
2013
14.6
23.8
9.2
Source: EU DG Trade.
In August 2013, RF announced that if Ukraine signs the AA, it will imply stricter border controls. Ukraine’s employers’ federation, which accounts for 70% of GDP, said stricter Russian customs procedures were paralyzing trade and could cost up to USD 2.5 bln just in the second half of 2013.74 As a result of the dispute with Russia of DCFTA and AA with the EU and the Crimean annexation, 2014 turned to be a particularly bad year for Ukraine: the GDP contracted by 9% by the year end; industrial
72
Veronika Movchan, Ricardo Giucci, Quantitative Assessment of Ukraine’s Regional Integration Options: DCFTA with European Union vs. Customs Union with Russia, Belarus and Kazakhstan, German Advisory Group, Institute for Economic Research and Policy Consulting, Policy Paper Series, May 2011, p. 1, at: http://www.beratergruppeukraine.de/download/Beraterpapiere/2011/PP_05_2011_en.pdf 73 Veronika Movchan, Ricardo Giucci, op.cit., based on State Statistics Service of Ukraine, pp.2-3. 74 Trade ‘suicide’: Russia prepares to tighten borders if Ukraine signs on with EU, RT: Business, 19 August 2013: https://www.rt.com/business/trade-war-ukraine-russia-656/ ; the TV broadcaster also quoted Prof. Alexey Portansky who then predicted, for Forbes Russia, that trade wars with Ukraine will be more serious that previous bans on trade with Georgia and Moldova: “Even the 2006 bans that Russia imposed on Georgian and Moldovan wine, juice and mineral water does not compare to the current Russian-Ukrainian trade war". 72
production went down by 16.5%; fixed capital formation was -20% already in the first quarter of 2014, central bank reserves were depleted by more than 50%, the national currency, the Hrivna depreciation was 50% and the inflation went up to around 20%. In the anticipation of Ukraine’s 75trade war with Russia and economic decline, the EU Commission President José Manuel Barroso announced on 11 March 2014 that “The Commission is moving ahead fast with the implementation of this support package [for Ukraine], and today has adopted the first of the foreseen measures – a set of trade provisions that will represent an economic benefit to Ukraine of around 500 million euros per year.” A week later Crimea was annexed by the RF. This “fast ahead move” was difficult to implement: it could have created wrong export strategies, the amount (EUR 0.5 bln) of “liberalization” envisaged was 23 times small the EU import from Ukraine in 2013, and it was totally unclear what happens when the liberalization window expires for the exports above the threshold. The situation necessitated a fundamental change in the DCFTA design, repeating the pattern of the FTAs and the MoU with the Western Balkan countries: the EU and Ukraine need not any longer apply import duties on most products exported from the EU to Ukraine and imported from Ukraine into the EU (99.1% on the Ukrainian side and 98.1% on the EU side).76 Still the difference between the two approaches is that in WB the EU granted autonomous trade preferences on an asymmetric basis in favor of the countries. DCFTA first results (Moldova and Georgia) The updated Ukraine DCFTA approach was immediately applied to the DCFTA with Georgia and Moldova, and entered into force before the agreement with Ukraine. “Russia concerns” blocked the negotiations with Ukraine and the enforcement was postponed, due to RF “concerns” for the beginning of 2016. The “concerns” focused on three sets of “threats” for RF: technical regulations (Russia insisted that Ukraine keeps the technical standards of GOSSTANDARD – a remnant from the Soviet era), phytosanitary and sanitary (Russia wanted Ukraine to apply RF standards and effectively ban some imports of animal products and plants from the EU and its FTA partners), and customs “issues” (the demand was 100% checks for each and every single merchandized export transaction with Ukraine). In addition there were “concerns” in the area of energy and investment that were even difficult to understand.77
75
See: European Commission proposes temporary tariff cuts for Ukrainian exports to the EU, Press Release, March 11, 2014, at: http://europa.eu/rapid/press-release_IP-14-250_en.htm 76 For the first time this approach was proposed by the CATO Institute Emergency Economic Summit for Ukraine on March 12, 2014. 77 The trilateral talks on DCFTA implementation, EU DG Trade 21 December 2015, at: http://trade.ec.europa.eu/doclib/docs/2015/december/tradoc_154126.pdf; see also: Krzysztof Bobiński, What Threat for Russia in EU-Ukraine DCFTA?, Eastern Partnership: Civil Society Forum, at: http://eap-csf.eu/en/newsevents/news/what-danger-for-russia-in-eu-ukraine-dcfta-by-eap-csf-co-chair-krzysztof-bobi%C5%84ski/; Rilka Dragneva and Kataryna Wolczuk, Postponing the implementation of the trade part of the EU-Ukraine Association agreement: Pragmatism or Surrender, Eurosearch, 30 September 2014, at: https://eurosearch.wordpress.com/2014/09/30/postponing-the-implementation-of-the-trade-part-of-the-eu-ukraineassociation-agreement-pragmatism-or-surrender/ and Denis Cenusa, Michael Emerson, Tamara Kovziridse and Veronika Movchan, Russia’s Punitive Trade Policy Measures towards Ukraine, Moldova and Georgia, CEPS Policy Document No 400, September 2015, at: http://www.3dcftas.eu/sites/default/files/WD%20300%20Punitive%20Trade%20Measures%20by%20Russia_0.pdf . 73
After one year of DCFTA in place78, the overall Moldovan exports decreased by 14.8%, from September 2014 to August 2015), the EU direction remaining almost unchanged – a contraction of just 1.4%, while exports to ex-Soviet markets decreased by 32.1%. The EU share of Moldova export went up from 51 to 58% of the total but there was no change in the EU export partners, first of which are Romania and Italy. There were fears that Moldova’s agrarian and food markets will concurred by EU imports, fueled by Common Agriculture Policy subsidies. The opposite happened: the Moldovan export of these products to EU was up by 10.8%, compensating the fall in exports to other markets (first of all to RT – by 73%). The latter development should be attributed to Russia’s policies and problems, and it is not possible to point at some evidence of causality effect between DCFTA and actual trade development in 2015. Georgia is still a beneficiary of the GSP, they will expire by the end of 2016. This transition period is shorter that the 6-year period for the WB countries under the MoU, but is believed to be sufficient to allow adjustment to the new preferential trade regime under the DCFTA. However, the requirements to amend lows and regulations are still to be complied with. For Georgia statistics of trade with the EU is not very detailed, but the Trade Maps suggests that the country’s total export in 2015 remain basically unchanged – EUR 2.15 bln (2.19 bln in 2014). Exports to Russia (10% of the total) went down from EUR 203 mln to EUR 143.1 mln, similar was the fate of the exports to Armenia (5% of the total), Kazakhstan and Kyrgyzstan. Although insignificant as a volume, the Georgia export to WB increased in 2015. The overall export of Georgia to EU remained unchanged sin 2013 – EUR 700 mln, but the import from declined in 2015 insignificantly – from EUR 1.9 to 1.8 bln. The EU is the main trade partner of Georgia with 26.1% of its trade, followed by Turkey (17.2%) and Azerbaijan (10.3%).79 General Conclusion of Trading with EN countries and Turkey From all Eastern countries, the WB FTA with Turkey seem to produce positive and mutually beneficial gains from trade. Turkey asymmetric trade preferences according to the tradition set by the MoU for WB of 2001. Often periods of protecting WB sensitive areas are extended. Imports and FDIs from Turkey in these countries are increasing, most notably in Kosovo, B&H and Albania. For the time being, however, it rarely takes a place among the top ten trading partners of the WB. We expect in mid-term Turkey to become more important partner. From DCFTA countries only Ukraine is an important partner of the WB countries, and this is true mostly for Serbia and Montenegro. These two countries FTAs with Russia (Montenegro inherited the negotiations from the times of FR Yugoslavia but agreements is yet achieved) imports from RF declined in the last three years due to market conjecture. Russian FDIs were important for the Montenegro aluminum production, but respective operation bankrupted in 2013. Today Russia is an important investor in Montenegro residential real estate. We do not expect any negative impacts on RF trade and investment with Montenegro due the countries accession into NATO. Albania export to Russia in 2014 grew by 60% but the amount is negligible. Moldova and Georgia, Armenia, Kazakhstan and Kyrgyzstan do not appear in the trade statistics of the WB or
78
See detailed assessment in: Ana Popa, DCFTA between Moldova and EU: after one year, Expert Group, Policy Brief, Novenber 2015, at: http://www.expertgrup.org/en/biblioteca/item/download/1464_99f24b481eb06945c5964db228d51159 . 79 Source: EU DG Trade. 74
the amounts of traded values are very low. The trade with Belarus is also low, and the trends are mixed. The trend of the exports to Russia is negative for the last five years. The total volume of WB exports to Russia in 2015 was EUR 750.5 mln, of which the bulk of the export was Serbia (EUR 663 mln); the trend for all countries is negative. Conclusions on Balkan FTA advantages compared to DCFTA and EAEU In the first two years of implementation of EU MoU (of autonomous trade preferences) had resulted in almost complete trade liberalization – 87-88% of the targeted 90% liberalization. The “grace periods” for the less economically advanced Balkan countries were fixed to firm deadlines, and all of them were met by all the countries. DCFTA left no such periods for Georgia, Ukraine and Moldova except in insignificant areas of trade. The WB countries immediately registered double digits in merchandized export growth rates, and the trend, although the rates naturally slowed down over time remained positive. In the first year of implementing the DCFTAs no such export (to EU) growth rates were registered. Within EAEU the development was similar, but less notable only in the exports from Kazakhstan to Russia. In general, traded volumes even decreased, perhaps due to the economic recession in the Russian Federation and Kazakhstan. WB advanced in liberalization of services with the EU and between themselves, thanks to the FTAs and CEFTA. The process in EAEU is similar in construction, transport and travel, although they were “regionalized” to a significant extend before the agreement went into force. There is little liberalization of banking, finance and insurance services within EAEU, which was an important part of the deal with the EU. Since 1999-2000, there is a substantial commitment and involvement of the international community, development banks and other organizations in support to the implementation of WB FTAs and removing administrative barriers to trade. Today OECD is leading the efforts for further removal of administrative and technical barriers to trade within CEFTA. Similar to the Balkans trade and transport facilitation efforts were implemented in Central Asia but the progress is still unclear. With regard to EAEU countries the international community involvement is on bi-lateral basis and since 2006 in unwelcome by the Russian Federation. The EU Stabilization and Association process is applicable (although with a different degree) to all WB and DCFTAs countries. It provides an acceptable general political conformity and orientation of the trade and integration efforts. For the EAEU counties such general orientation does not seem generally accepted.
75
ANNEX 1: STATISTIC SOURCES AND LITERATURE -
-
-
-
Albania Institute of Statistics: http://www.instat.gov.al/en/Home.aspx Albania Trade in Goods: 30 May 2016, at: http://www.instat.gov.al/media/331162/foreign_trade__april_2016.pdf
William Bartlett, Regional integration and free-trade agreements in the Balkans: Opportunities, obstacles and policy issues, LSE Series, Economic Change and Restructuring No 42(1), February 2009, pp. 25-46 Balkan Observatory, Country Reports, at: http://balkanobservatory.net/index.php/publications/country-reports Balkan Observatory, Working Papers, at http://balkanobservatory.net/index.php/publications/working-papers
Bela Balassa and Marcus Noland, “Revealed” Comparative Advantage in Japan and the United States, Journal of International Economic Integration 4 (2), Autumn 1989, pp. 8-22. Dirk Bezemer, Post-Socialist Financial Fragility: The Case of Albania, Cambridge Journal of Economics, February 2001, No 25(1), pp. 1-23. Krzysztof Bobiński, What Threat for Russia in EU-Ukraine DCFTA?, Eastern Partnership: Civil Society Forum, at: http://eap-csf.eu/en/news-events/news/what-danger-for-russia-in-eu-ukraine-dcfta-by-eap-csfco-chair-krzysztof-bobi%C5%84ski/
Harry Broadman (editor), From Disintegration to Reintegration: Eastern Europe and the Former Soviet Union in International Trade, World Bank, 2005 B&H Institute for Statistics, the Federation: http://www.fzs.ba/eng/ Denis Cenusa, Michael Emerson, Tamara Kovziridse and Veronika Movchan, Russia’s Punitive Trade Policy Measures towards Ukraine, Moldova and Georgia, CEPS Policy Document No 400, September 2015, at: http://www.3dcftas.eu/sites/default/files/WD%20300%20Punitive%20Trade%20Measures%20by%20Russia_ 0.pdf .
Commodity International Exchange of the Republic of Macedonia, 2013, State Statistical Office, Skopje, June 2015, at: http://www.stat.gov.mk/Publikacii/7.4.15.01.pdf 2014 and 2015 CEFTA Trade Statistics, at: http://www.cefta.int Customs Administration of the Republic of Serbia, International Agreements (Agreement with EAEU available only in Serbian), at: http://www.upravacarina.rs/lat/Informacije/Stranice/MedjunarodniSporazumi.aspx; other FTAs – in English: http://www.upravacarina.rs/en/Informations/Pages/InternationalAgreements.aspx Damijan, P.J., J. De Sousa, O. Lamotte (2009), Does international openness affect productivity of local firms? Evidence from Southeastern Europe. Economics of Transition, 17 (3): 559–586. Damijan, P.J, Č. Kostevc, Learning-by-Exporting: Continuous Productivity Improvements or Capacity Utilization Effects? Evidence from Slovenian Firms, Review of World Economics, 2006, No 142 (3), pp: 599-614. Zef Dedaj, Merita Fetahu, Daniel Linotte, NTBs in the CEFTA context: The Case of Serbia against Kosovo, Republic of Kosovo: Ministry of Trade and Industry, May 2015, at: http://www.mti-ks.org/repository/docs/Policy_Paper_on_NTBs_333760.pdf
Martin Dimitrov and Krassen Stanchev, Bulgaria Trade Perspectives in Balkan Context, IRIS Quarterly Policy Report, Summer/Autumn 2000, pp. 89-123. Veliko Dimitrov (IME), Cost of Institutional Harmonization in ENP Countries, CASE Network, Studies and Analyses No. 388, May 2009, at: http://www.caseresearch.eu/upload/publikacja_plik/25386205_sa388.pdf
76
-
-
-
-
-
-
-
-
Martin Dimitrov and Krassen Stanchev, SEE Trade and Institutions: A Case Study on Bulgaria and the Region, WIIW Balkan Observatory, Working Paper 023, February 2002, at: http://www.wiiw.ac.at/see-trade-and-institutions-a-case-study-on-bulgaria-and-the-region-dlp-3303.pdf
Rilka Dragneva and Kataryna Wolczuk, Postponing the implementation of the trade part of the EU-Ukraine Association agreement: Pragmatism or Surrender, Eurosearch, 30 September 2014, at: https://eurosearch.wordpress.com/2014/09/30/postponing-the-implementation-of-the-trade-part-ofthe-eu-ukraine-association-agreement-pragmatism-or-surrender/ . EAEU, Official Site, Economic Information: http://www.eaeunion.org/?lang=en#about ECORYS-CASE, Trade Sustainability Impact Assessment for the FTA between the EU and Ukraine within the Enhanced Agreement, Client: European Commission, DG-Trade, Rotterdam, (Annexes) 13 December 2007 and Final Report 17 December 2007, report at: http://trade.ec.europa.eu/doclib/docs/2008/january/tradoc_137597.pdf EUROSTAT, Publications on Western Balkans: http://ec.europa.eu/eurostat/publications/collections/sifdif/sif?p_auth=8IZ3wij9&p_p_id=estatsearchportlet_WAR_estatsearchportlet&p_p_lifecycle=1&p_p_stat e=maximized&p_p_mode=view&_estatsearchportlet_WAR_estatsearchportlet_action=search&text=We stern+Balkans
EUROSTAT, External Trade of Western Balkan Countries: Strong growth in Western Balkan countries’ (WBCs) trade with the European Union, at:
http://ec.europa.eu/eurostat/documents/3433488/5573344/KS-NO-05-001-EN.PDF/0fd7ca18-c67a-470aa740-e371da1f953e?version=1.0 Energy for the Southeastern Europe Energy Community Treaty, at: https://www.energycommunity.org/portal/page/portal/ENC_HOME/ENERGY_COMMUNITY/Legal/Treaty .
Saul Estrin and Milica Uvalic, Foreign direct investment into transition economies: Are the Balkans different?, LSE ‘Europe in Question’ Discussion Paper Series, Paper No. 64/2013, July 2013, at: http://www.lse.ac.uk/europeanInstitute/LEQS%20Discussion%20Paper%20Series/LEQSPaper64.pdf EU Business: Ukraine Subpage: http://www.eubusiness.com/europe/ukraine/dcfta EUROSTAT: Comparative price levels of consumer goods and services (2014), at: http://ec.europa.eu/eurostat/statisticsexplained/index.php/Comparative_price_levels_of_consumer_goods_and_services
EUROSTAT: International trade of EFTA and enlargement countries, at: http://appsso.eurostat.ec.europa.eu/nui/show.do
European Union, Trade in goods with Albania, DG Trade, 14-04-2016, at: http://trade.ec.europa.eu/doclib/docs/2006/september/tradoc_113342.pdf European Union, Trade in goods with Former Yugoslav Republic of Macedonia, DG Trade, 1404-2016, at: http://trade.ec.europa.eu/doclib/docs/2006/september/tradoc_113381.pdf EU reinstates trade preferences for the Western Balkans until 2015, DG Trade, 30 December 2011, at: http://trade.ec.europa.eu/doclib/press/index.cfm?id=772 European Union, Trade in goods with Bosnia-Herzegovina, DG Trade, 26 April 2016, at: http://trade.ec.europa.eu/doclib/docs/2006/september/tradoc_113358.pdf EU SAA with WB countries, EU DG Trade Portal: http://exporthelp.europa.eu/thdapp/display.htm;jsessionid=597445EDDEB2E78FC0E9A972B3360773?page =cd%2fcd_PreferentialArrangements.html&docType=main&languageId=en
EU Trade Commissioner Cecilia Malmström, The trilateral talks on DCFTA implementation (Memo of 21 December 2015), at: http://trade.ec.europa.eu/doclib/docs/2015/december/tradoc_154126.pdf
Vladimir Gligorov, Trade and Investment in the Balkans, Balkan Observatory, Archive, at: http://balkan-observatory.net/archive/gligorov.pdf
Global Assessment of the statistical systems in the Western Balkan countries, Proceedings of the seminar in Dubrovnik, 3 and 4 June 2002, at: http://ec.europa.eu/eurostat/documents/4187653/5752493/KS-44-02-892-EN.PDF/0605e1c4-e7d4-46a0905b-d9a2f0930922?version=1.0
77
-
-
Ellen Goldstein, Simon Davies and Wolfgang Fengler, Three reasons why the economy of Bosnia and Herzegovina is off balance, Brookings, Future Development, November 5, 2015, at: http://www.brookings.edu/blogs/future-development/posts/2015/11/05-bosnia-economy-goldstein-daviesfengler
5 Year Aluminum Prices and Price Charts (2011-2015), InvestMine: http://www.infomine.com/investment/metal-prices/aluminum/5-year/
-
-
-
Joseph Francois, Mega ‐Regionalism and the European Union, a presentation, Vienna, may 2013, at: http://wiiw.ac.at/mega-ftas-and-the-european-union-dlp-2901.pdf Pierre Garello, Jean-Marc, Thierry Sebagh and Eka Avaliani, Feasibility Study: EU-Georgia FTA, Tbilisi, UNDP, July 2007. Mahdi Ghodsi, Distinguishing Between Genuine and Non-Genuine Reasons for Imposing Technical Barriers to Trade: A Proposal Based on Cost-Benefit Analysis, WIIW Working Paper No. 117, July 2015, at: http://wiiw.ac.at/distinguishing-between-genuine-and-non-genuine-reasons-forimposing-technical-barriers-to-trade-a-proposal-based-on-cost-benefit-analysis-dlp-3668.pdf
GTA - Global Trade Atlas, last update on WB-EFTA coutries – February 2016, at: https://www.gtis.com/gta/
Johannes Hahn, Commissioner for European Neighborhood Policy & Enlargement Negotiations at the High level conference on EU-Kosovo Stabilization Association Agreement, 17 May 2016 Speech at High Level Conference of EU-Kosovo SAA, at: http://eeas.europa.eu/delegations/kosovo/press_corner/all_news/news/2016/20160517_03_en.htm
IMF: FYROM, Hua Chai, Shan Chen, Marc Gerard, Patrick Gitton, Duncan Last and Jubum Na, Selected Issues Paper, August 2015. IMF: Republic of Kosovo, Nina Budina, Pamela Madrid Angers, Johannes Wiegand, Ernesto Crivelli, Ghada Fayad and Xingwei Hu, Selected Issues Paper, July 2013. Christopher Jarvis, The Rise and Fall of the Pyramid Schemes in Albania, IMF, 1999, Working Paper 99/98 Edward P Joseph and Srecko Latal, Bosnian Declaration Will Test Europe’s Resolve, Balkan Insight, 23 January 2015, at: http://www.balkaninsight.com/en/article/bosnian-declaration-will-testeurope-s-resolve
Mario Holzner and Florin Peci, Measuring the Effects of Trade Liberalization in Kosovo, WIIW Balkan Observatory, Working Paper 085, June 2012. Mario Holzner and Vladimir Gligorov, Illegal Trade in South East Europe, Balkan Observatory, Working Paper 061, December 2004, at: http://wiiw.ac.at/illegal-trade-in-south-east-europe-dlp3247.pdf. Integrated Tariff of Kosovo/2015, Kosovo Customs office, at: https://dogana.rks-gov.net/tarik/ Anna Kolesnichenko, Institutional Harmonization and Its Costs and Benefits in the Context of EU Cooperation with Its Neighbors. An overview, CASE Network, Studies and Analyses No. 387, May 2009, at: http://www.case-research.eu/en/node/55640 . Kosovo Agency of Statistics, External Trade, at: https://ask.rks-gov.net/en/et. Kosovo Central Bank, Quarterly Assessment of the Economy: Ekonomisë, No. 13, Q IV/2015, at: http://bqk-kos.org/repository/docs/2015/CBK_TM4_2015_English.pdf . Kosovo International Trade Guide, Trade Agreements, at: http://www.itg-rks.com/en-us/TradeAgreements
Ian Lynch, Trepca and Kosovo’s Uncertain Future, University of Vermont Environmental Program, Class of 2012, at: http://www.uvm.edu/~shali/Trepca_Kosovo_Serbia_Mining.pdf . Sandra M. Leitner and Robert Stehrer, Trade Integration, Production Fragmentation and Performance in Europe - Blessing or Curse? A Comparative Analysis of the New Member States and the EU-15, WIIW Research Report No. 397, November 2014 Mapping Russia Influence on Serbia During 2013 and 2014: Collection of Analyses by The Center of Euro-Atlantic Studies, CEAS - Belgrade, 2015, at: https://www.ceas-serbia.org/MappingRussian-influence-in-Serbia.pdf
78
-
-
-
-
OECD: Elimination of Non-Tariff Barriers in CEFTA, OECD, 2012, at: https://www.oecd.org/globalrelations/CEFTA%20Issues%20Paper%204%20Elimination_of_NTBs_in_CEFT A.pdf
OECD: IMPLEMENTING THE CEFTA 2006 AGREEMENT: Reaping the benefits of trade and investment integration in South East Europe, OECD, https://www.oecd.org/globalrelations/Reaping_the_benefits_of_trade_and_investment.pdf
OECD:Trade in Intermediate Goods and International Supply Chains in CEFTA, OECD, 2013, at: https://www.oecd.org/investmentcompact/CEFTA%20IP6_Trade%20in%20Intermediate_Web%20and%20 Print.pdf
OECD:Trade Integration, Industry Concentration and FDI Inflows: The Experience in Central and South Eastern Europe, OECD, https://www.oecd.org/globalrelations/CEFTA%20WP3_TradeFDI_NEW_Nov%202010.pdf
Patrick A. Messerlin, Michael Emerson, Gia Jandieri and Alexadre Le Vernoy, An Appraisal of EU Trade Policy towards Eastern Neighbors: the Case of Georgia, Groupe d’economie mondiale – Paris, CEPS – Brussels, 2011. Patrick A. Messerlin, Sébastien Miroudot, Trade Liberalization in South East Europe: Review of conformity of 23 FTAs with the MoU, Paris, Science Po, Groupe d’economie mondiale, January 2004. Measures to improve fiscal and trade policies in Kosovo agriculture, Ministry of Agriculture, Forestry and Rural Development, Working Paper, February 2004. Michigan State University, Global Edge Business Knowledge Statistics: Serbia trade statistics 2014, at: http://globaledge.msu.edu/countries/serbia/tradestats Ministry of Foreign Affairs of Ukraine: FTAs, at: http://mfa.gov.ua/en/about-ukraine/economiccooperation/trade-agreements
MONSTAT, Statistical Office of Montenegro, External Trade subpage: http://www.monstat.org/eng/page.php?id=171&pageid=171
MONSTAT, Statistical Office of Montenegro, Mirror Analysis of External Trade of Montenegro, Working paper, Podgorica, September 2011. MONSTAT, Revision of Foreign Trade Data for 2005-2009, at: http://www.monstat.org/userfiles/file/spoljna%20trgovina/REVIZIJA%20SPOLJNOTRGOVINSKIH%20POD ATAKA%202005-2010%20GODINA%20engl%20.pdf
Veronika Movchan, Volodymyr Shportyuk, EU-Ukraine DCFTA: the Model for Eastern Partnership Regional Trade Cooperation, CASE Network, Studies and Analyses No. 445, October 2012, at: http://www.case-research.eu/en/node/57857 . Lindita Muaremi, Rigersa Konomi, Sindise Salihi, Macedonia’s FDI, European Scientific Journal, vol.11, No.4, February 2015. Zuzana Murgasova, Nadeem Ilahi, Jacques Miniane, Alasdair Scott, Ivanna Vladkova-Hollar, The Western Balkans: 15 Years of Economic Transition, IMF, March 2015, at: https://www.imf.org/external/pubs/ft/reo/2015/eur/eng/pdf/erei_sr_030915.pdf
Marjan Petreski, Branimir Jovanović and Igor Velickovski, Tariff-induced (de)industrialization in transition economies: A comparative analysis, WIIWBalkan Obeservatory, Working Papers, No 16, October 2015, at: http://wiiw.ac.at/tariff-induced-de-industrialization-in-transition-economies-acomparative-analysis-dlp-3898.pdf
Ana Popa, DCFTA between Moldova and EU: after one year, Expert Group, Policy Brief, Novenber 2015, at: http://www.expertgrup.org/en/biblioteca/item/download/1464_99f24b481eb06945c5964db228d51159 Relations between Turkey and Bosnia and Herzegovina, Republic of Turkey: MFA, at: http://www.mfa.gov.tr/relations-between-turkey-and-bosnia-and-herzegovina.en.mfa
Republic of Macedonia, Customs Administration: FTAs, at:
http://www.customs.gov.mk/en/DesktopDefault.aspx?tabindex=0&tabid=119 Republic of Srpska Institute of Statistics (B&H): http://www.rzs.rs.ba/
79
-
-
Serbian Customs (without a year): http://www.upravacarina.rs/en/Pages/default.aspx Serbia’s free trade agreements with Turkey and Russia creates a golden opportunity, Bilaterals.Org, 8 August 2013, at: http://www.bilaterals.org/?serbia-s-free-trade-agreements&lang=en Mirsad Simnica, Impact Analysis of Trade in Services Liberalization with CEFTA Countries Sectors: Transport and Finance, Republic of Kosovo, Ministry of Trade and Industry, 31st March, 2016, at: http://www.mti-ks.org/repository/docs/Transport_&_Finance__Analytical_document_for_services_Eng_906689.pdf
Robert Stehrer, Does the Home Bias Explain Missing Trade in Factors?, WIIW, Working Paper No. 110, December 2014, at: http://wiiw.ac.at/does-the-home-bias-explain-missing-trade-in-factors-dlp-3543.pdf
Roman Studer, How Important Is an Integrated European Market? Some Insights from History, Perspectives on Europe, Autumn 2015, No 45:2 2014 The International Trade Statistics Yearbook: Volume II, at: http://unstats.un.org/unsd/trade/default.asp
Dusica Tomovic, Montenegro Sells Bankrupt Aluminium Plant, Balkan Insight, 11 June 2014, at: http://www.balkaninsight.com/en/article/montenegro-s-bankrupt-aluminium-plant-sold-to-a-local-company Trading Economics Portal, interactive country statistics: http://www.tradingeconomics.com .
Trade Map: Trade statistics for international business development, Interactive trade statistics portal: http://www.trademap.org/Index.aspx The trilateral talks on DCFTA implementation, EU DG Trade 21 December 2015, at: http://trade.ec.europa.eu/doclib/docs/2015/december/tradoc_154126.pdf
UN Comtrade and UN ServiceTrade (United Nations Commodity and Service Trade Statistics Database): Country Profiles 2013 UNCTAD, trade database: http://unctadstat.unctad.org/wds/ReportFolders/reportFolders.aspx?IF_ActivePath=P,15912
UNCTAD, FDI database:
http://unctadstat.unctad.org/wds/ReportFolders/reportFolders.aspx?IF_ActivePath=P,5
UNCTAD, trade and development and world investment reports, at: http://unctad.org/en/Pages/Publications.aspx
Milica Uvalic, Trade Liberalization in SEE: Recent Trends and Some policy Implications, Geneva, UNECE Spring Seminar, February, 2005 The WIWW Balkan Observatory: http://balkan-observatory.net/ World Integrated Trade Solution, WITS of the World Bank, country statistics: http://wits.worldbank.org
WTO, Trade Policy Reviews for individual countries WTO, Regional Trade Agreements Information System: http://rtais.wto.org/UI/PublicMaintainRTAHome.aspx
Zuzana Murgasova, Nadeem Ilahi, Jacques Miniane, Alasdair Scott, Ivanna Vladkova-Hollar, and an IMF Staff Team, The Western Balkans: 15 years of economic transition. – Washington, D.C., International Monetary Fund, 2015.
80
ANNEX 2: SELECTED COUNTRIES TRADERELATED STATISTICS B&H EU AND EFTA TRADE TABLES AND GRAPHS
EFTA – BOSNIA & Herzegovina Merchandise trade
81
82
Top 5 Traded commodities by EFTA and B&H (2010-2014)
83
Source: All data are sourced from GTI. Global Trade Atlas (last update: February 2015) and EFTA: http://www.efta.int/media/documents/free-trade/trade-statistics/Bosnia-Herzegovina.pdf . Note: Merchandise trade data for Liechtenstein are included in the data for Switzerland.
84
KOSOVO TRADE: 2005-2011
Kosovo Export and Import by SITC (value in EUR ‘000) Code 0 1 2 3 4 5 6 7 8 9
0 1 2 3 4 5 6 7 8 9
0 1 2 3 4 5 6 7 8 9
Export
2006
2007
2008
2009
2010
2011
Food and live animals 5,076 8,526 Beverages and tobacco 2,754 2,785 Crude materials, inedible, except fuels 26,852 42,904 Mineral fuels, lubricants and related materials 1,721 8,540 Animal and vegetable oils, fats and waxes 143 247 Chemicals and related products, n.e.s. 1,327 1,386 Manufactured goods classified chiefly by material 6,678 31,885 Machinery and transport equipment 8,829 8,940 Miscellaneous manufactured articles 2,895 5,561 Commodities and transactions not classified else. in8 the SITC : TOTAL 56,283 110,774 Import Food and live animals 206,183 228,336 Beverages and tobacco 65,679 73,439 Crude materials, inedible, except fuels 23,486 24,528 Mineral fuels, lubricants and related materials182,381 217,116 Animal and vegetable oils, fats and waxes 9,932 13,940 Chemicals and related products, n.e.s. 115,956 138,780 Manufactured goods classified chiefly by material 220,165 264,818 Machinery and transport equipment 234,273 232,228 Miscellaneous manufactured articles 99,438 112,694 Commodities and transactions not classified else. in:the SITC : TOTAL 1,157,492 1,305,879 Balanc Food and live animals -201,107 -219,810 Beverages and tobacco -62,925 -70,655 Crude materials, inedible, except fuels 3,366 18,376 Mineral fuels, lubricants and related materials -180,659 -208,576 Animal and vegetable oils, fats and waxes -9,789 -13,694 Chemicals and related products, n.e.s. -114,630 -137,394 Manufactured goods classified chiefly by material -213,487 -232,932 Machinery and transport equipment -225,445 -223,287 Miscellaneous manufactured articles -96,542 -107,133 Commodities and transactions not classified else. in:the SITC : TOTAL -1,101,209 -1,195,105
2005
14,215 3,887 53,513 12,576 : 1,356 50,689 22,697 6,180 : 165,112
14,684 5,808 45,582 8,313 23 2,389 104,909 10,727 6,027 : 198,463
14,550 5,088 38,341 7,213 76 2,421 84,111 7,847 5,680 : 165,328
18,710 5,368 73,944 10,845 100 2,426 165,993 9,745 8,735 91 295,957
17,552 8,097 81,108 16,229 45 4,174 168,766 16,162 6,902 131 319,165
272,443 91,333 36,421 258,356 15,524 156,484 307,628 294,302 143,656 40 1,576,186
336,901 110,462 40,801 343,537 20,152 183,523 361,977 362,637 168,187 60 1,928,236
323,764 87,284 44,298 282,766 15,994 193,694 372,622 436,205 178,874 39 1,935,541
354,396 102,099 65,897 339,225 17,346 205,055 421,836 439,861 202,580 9,432 2,157,725
413,054 114,472 86,309 452,498 19,292 256,657 488,804 422,316 226,544 12,401 2,492,348
-258,227 -87,447 17,092 -245,780 : -155,128 -256,938 -271,606 -137,477 : -1,411,074
-322,217 -104,654 4,782 -335,224 -20,129 -181,133 -257,068 -351,910 -162,160 : -1,729,774
-309,214 -82,196 -5,957 -275,553 -15,919 -191,274 -288,511 -428,358 -173,194 : -1,770,214
-335,686 -96,730 8,048 -328,380 -17,246 -202,629 -255,843 -430,116 -193,845 -9,341 -1,861,769
-395,503 -106,375 -5,201 -436,270 -19,247 -252,483 -320,038 -406,154 -219,643 -12,270 -2,173,184
Source: Kosovo Agency of Statistics
85
Kosovo Exports (2005-2011), by Country
2005 1,017 19 72 142 515 5,965 5,522 124 92 3 5,668 : 102 1 34 1,231 : 18 : 970 126 21,621 5,784 10,828 743 8,158 1,041 681 3,411 928 4 182 45 : 10 2,847 56,283
2006 1,211 17 62 44 232 3,952 3,914 1,128 18 20 12,654 : 281 356 37 4,515 49 43 : 13,506 69 42,108 12,645 9,734 2,207 20,910 1,668 7,047 5,126 1,123 : 3 : : 5 8,198 110,774
2007 2,005 5,587 154 94 145 16,190 8,400 2,413 112 48 9,672 : 121 159 395 4,290 114 8,155 1,142 10,005 169 69,370 20,799 17,384 2,913 19,280 2,660 12,937 5,287 1,837 50 17 : : 18 12,560 165,112
Eksporti Eksport 2008 2009 2,072 1,978 28,113 5,176 173 249 53 75 247 639 7,205 7,563 10,851 240 1,888 1,506 105 396 10 3 25,485 46,218 : : 102 53 1,127 463 241 391 6,304 2,882 196 51 4,390 322 43 232 2,632 2,709 2737 129 93,974 71,275 21,113 26,182 20,046 17,355 3,770 3,084 9,893 3,504 3,044 6,512 7,380 10,510 5,919 1,206 793 2,151 : : 286 290 : : : 3 31 1,596 32,214 21,660 198,463 165,328
Contries 2010 5,670 11,455 681 44 1,084 15,587 222 1,018 29 6 80,193 : 150 297 920 6,203 49 1,116 272 6,765 50 131,811 30,841 26,308 3,920 3,941 9,357 17,786 1,847 2,744 : 116 : 12 14,779 52,495 295,957
2011 5,711 5,085 1,343 52 1,305 24,144 194 2,923 89 7 83,924 8 650 168 2,405 6,001 57 365 987 936 294 136,648 34,566 30,949 6,988 7,198 7,831 17,611 612 2,794 : 182 43 5 28,268 45,470 319,165
2011/2010 101 44 197 118 120 155 87 287 307 117 105 : 433 57 261 97 116 33 363 14 588 104 112 118 178 183 84 99 33 102 : 157 : 42 191 87 108
Austria Belgium Great Britain Denmark France Germany Greece Netherland Hungary Ireland Italy Luxembourg Poland Czech Republic Slovakia Slovenia Spain Sweden Romania Bulgaria Other of EU 27 EU countries Albania Macedonia Montonegro Serbia Turkey Switzerland Bosnia and Herzegovina Croatia Ukraine USA Brazil Japan China Other TOTAL*
Source: Kosovo Agency of Statistics
86
MACEDONIA TRADE STATISTICS (2004-2014-2015)
87
Macedonia: Merchandise trade with EU (2004-2008, EUR mln) 2004 2005 2006 2007 Export 914 1134 1447 2019 Import 1577 1634 1899 2171 Balance -663 -500 -452 -152 Macedonia: Merchandise trade with EU (2010-2014, EUR mln) 2010 2011 2012 Export 1852 2281 2110 Import 2532 3038 3372 Balance -680 -757 -1262 Macedonia-EU: trade in agricultural goods (2010-2014, EUR mln) 2010 2011 2012 Export 183 185 204 Import 260 323 345 Balance -77 -141
2008 1945 2643 -698
2013 2384 3397 -1013
2014 3024 3820 -796
2013 231 338 -107
2014 259 325 -66
EU – Macedonia trade in non-agricultural goods (2010-2014, EUR mln) 2010 2011 2012 2013 Export 1669 2095 1905 2154 Import 2272 2716 3026 3058 Balance 603 621 1121 904
2014 2765 3495 730
Source: European Union. Trade with For. J. Rep. Macedonia – trade.ec.europa.eu. 20.10.2015
88
89
Evolution of Merchandise Trade: EFTA-Macedonia 2010-2014 (USD mln.) 2010 2011 2012 2013 2014 Total trade EFTA
75.736
122.001
147.540
146.505
144.869
Macedonian share of EFTA's trade with the world
0.01
0.02
0.02
0.02
0.02
Iceland
0.164
0.667
0.438
0.521
0.517
Norway
9.166
10.845
9.604
10.169
12.353
Switzerland
66.406
110.489
137.437
135.814
132.998
Imports
2010
2011
2012
2013
2014
EFTA
28.610
61.070
86.507
89.102
93.563
Macedonian share of EFTA's imports from the world
0.01
0.02
0.03
0.03
0.03
Iceland
157
271
286
301
364
Norway
7.006
7.927
7.342
8.444
9.996
Switzerland
21.448
52.871
78.879
80.357
83.202
After 2000 Macedonia export to EFTA countries developed as shown on the table. Exports 2010 2011 2012 2013 2014 EFTA
47.126
60.931
61.032
57.403
51.306
Macedonian share of EFTA's exports to the world
0.01
0.02
0.02
0.01
0.01
Iceland
0.07
0.396
0.152
0.220
0.153
Norway
2.160
2.918
2.262
1.725
2.357
Switzerland
44.958
57.618
58.618
55.458
48.796
Source: EFTA trade http://www.efta.int/media/documents/free-trade/trade-statistics/Macedonia.pdf
90
SEGURA Consulting LLC 6110 Executive Blvd, Suite 512 Rockville, MD 20852 Phone: (301) 469-4724 Fax: (301) 469-4728
73