of a novel method (RegnANN) for gene network inference based on multilayer ... among genes in a regulatory network starting from their expression signals has ...
RegnANN: network inference using Artificial Neural Networks Marco Grimaldi ∗.1 , Giuseppe Jurman1 , Roberto Visintainer1,2 1 2
Fondazione Bruno Kessler, via Sommarive 18, I-38123 Trento, Italy DISI - University of Trento, via Sommarive 14, I-38123 Trento, Italy {grimaldi, jurman, visintainer}@fbk.eu
Abstract Reconstructing the topology of a gene regulatory network is one of the key tasks in systems biology. Here we present a methodical comparison of the performance of a novel method (RegnANN) for gene network inference based on multilayer perceptrons with other three reference algorithms (ARACNE, CLR, KELLER). In order to account for the variability induced by both the network intrinsic structure (e.g.: its topology) and the available data, our analysis considers Barabasi and Erd¨os-R´enyi synthetic networks together with two different methods for data generation. The extensive evaluation on both synthetic data and a selection of gene modules of Escherichia coli indicates that RegnANN shows MCC scores that compare very favorably with all the other inference methods tested. On the synthetic test-bed, RegnANN outperforms all the other methods in a number of setups. On the other hand, results on biological data are less consistent, indicating that other factors may influence the accuracy scores of the network reconstruction task.
1
Introduction
Since the first examples dating back to early seventies [1], the challenge of reconstructing the links among genes in a regulatory network starting from their expression signals has been tackled by several laboratories worldwide. These initial efforts have originated a number of related publications which has been exponentially growing in the last few years. The inference methods generally employed are of very different nature, ranging from deterministic, e.g.: systems of differential equations [2] and Gr¨obner bases [3], to stochastic approaches, e.g.: Boolean [4] or Bayesian [5] algorithms. Such approaches may also start from different types of gene expression data: time-course or steady states. Furthemore, also the detail and the complexity of the considered network can vary as the links may carry information about the direction of the relation (directed graph) and a weight may be associated to the strenght of each link (weighted directed graph) [6, 7]. Generally, the reconstruction accuracy is far from being optimal in many situations with the presence of several pitfalls, related to both the methods and the available data [8]. In this paper we introduce a novel inference method called Reverse Engineering Gene Networks with Artificial Neural Networks (RegnANN). This approach is based on an ensemble of multilayer perceptrons trained using steady state data. Its perfomance is compared with those of top-scoring methods such as KELLER [9], ARACNE [10] and CLR [11]. To improve the general efficiency of RegnANN we implement the algorithm using GPGPU [12]. ∗
Corresponding author. Lab website: http://mpba.fbk.eu
1
In evaluating the performance of the four different network inference methods, first we settle in a controlled situation with synthetic data and then we focus on a biological setup by analysing transcriptional subnetworks of Escherichia coli. In order to simplify our comparative evaluation, we will only consider the underlying topology, thus neglecting both weight and direction of the links among the genes. In doing so, we confine the analysis of the reconstructed network in terms of the binary existence or not-existence of an edge. The general performance of the network inference task is evaluated in terms of Matthews Correlation Coefficient – MCC [13]. MCC is becoming the measure of choice in many application fields of machine learning and bioinformatics: it is one of the best methods for summarizing into a single value the confusion matrix of a binary classification task. Recently it has also been used for comparing network topologies [14].
2
RegnANN: network inference using ANN
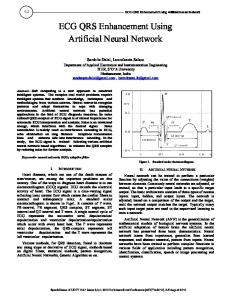
To infer gene regulatory networks we adopt an ensemble of feed-forward multilayer perceptrons [15] trained using the back-propagation algorithm. Each member of the ensemble is essentially a multi-variable regressor (one to many) trained using an input expression matrix to learn the relationships (correlations) among a target gene and all the other genes in the network. We proceed in determining the interactions among genes separately and then we join the information to form the overall network. From each row of the gene expression matrix1 we build a set of input and output patterns used to train a selected multilayer perceptron. Each input pattern corresponds to the expression value for the selected gene of interest. The output pattern is the row-vector of expression values for all the other genes for the given row in the gene expression matrix (Figure 1). By cycling through all the rows in the matrix, each regressor in the ensemble is trained to learn the correlations among one gene and all the others. Repeating the same procedure for all the columns in the expression matrix, the ensemble of multi-variable regressors is trained to learn the correlations among all the genes.
1
gene expression matrix
expression level index
output layer
hidden layer
input layer
multi!variable regressor M
1
gene index
N
Figure 1: The ad hoc procedure proposed to build the training input/output patterns starting from a gene expression matrix. Each input pattern corresponds to the expression value for the selected gene of interest. The corresponding output pattern is the vector of expression values for all the other genes for the given row in the gene expression matrix. The procedure of determining separately the interactions among genes is very similar to the one presented in [9], where the authors propose to estimate the neighborhood of each gene (the correlations 1 In this work we consider gene expression matrices of dimension M × N : N genes whose expression levels are recorded M times.
2
among one gene and all the others) independently and then joining these neighborhoods to form the overall network, thus reducing the problem to a set of identical atomic optimizations (Section 2.1). Here we build N (one for each of the N genes in the network) multilayer perceptrons with one input node, one layer of hidden nodes and one layer of N − 1 output nodes. The input node takes the expression value of the selected gene rescaled in [−1, 1]. The number of hidden nodes √ is set empirically to the square root of the number of inputs by the number of outputs, resulting in N − 1. The activation function is the hyperbolic tangent, which provides output values in the range [−1, 1], thus making the output values interpretable in terms of positive correlation (+1), anti-correlation (−1) and not-correlated (0). The other parameters used to learn each multi-layer perceptron are as follows: learning rate equal to 0.01; momentum equal to 0.1, learning epochs equal to 1000; bias equal to 0. These values are evaluated empirically during preliminary tests on synthetic data. Finally, the topology of gene regulatory networks is obtained by applying a second procedure. The correlation of each gene with all the others is extracted by passing a purposely made test pattern to the regressor: considering separately each multilayer perceptron in the ensemble, a value of 1 is passed to its input neuron, consequently recording its output values. In this way, the correlation between the corresponding gene with all the others is obtained as a vector of values in [−1, 1]. By cycling through all the members of the regression system, we obtain the adjacency matrix of the sought gene network. It is important to note that this procedure does not allow discovering of gene self correlation (regulation) patterns, but only correlation patterns among different genes. Moreover, the algorithm here proposed cannot estimate future values, because it is not a predictor, as in the case of GRNN [16]: instead it models static correlations between genes. As in [9], it is possible to extend the regression system to take into account dynamic rewiring of the topology, but this is beyond the scope of the present work. To improve the general efficiency of the algorithm and thus allow a systematic comparison of its performance with the other gene network reverse engineering methods tested (Subsection 2.1), we implemented the ANN based regression system using the GPGPU programming paradigm [12, 17]. 2.1
Alternative inference methods
As reference methods we select three alternative algorithms widely used in literature: ARACNE, CLR and KELLER. KELLER: it is a kernel-reweighted logistic regression method [9] introduced for reverse engineering the dynamic interactions between genes based on the time series of their expression values. It estimates the neighborhood of each gene separately and then joins the neighborhoods to form the overall network. The approach aims at reducing the network inference problem to a set of identical atomic optimizations. KELLER makes use of the l1 -regularized logistic regression algorithm and operates modeling the distribution of interactions between genes as a binary pair-wise Markov Random Field. Although KELLER has been developed to uncover dynamic rewiring of gene transcription networks (e.g.: dynamic changes in their topology), here we consider constant network topology for a given gene expression matrix. In this work we make use of the reference implementation of the algorithm provided in [9]. ARACNE: it is a general method able to address a wide range of network deconvolution problems – from transcriptional [10] to metabolic networks [18] – that was originally designed to scale up to the complexity of regulatory networks in mammalian cells. The method makes use of an information theoretic approach to eliminate the majority of indirect interactions inferred by co-expression methods. ARACNE removes the vast majority of indirect candidate interactions using a well-known information theoretic property: the data processing inequality [19]. In this work we use the reference implementation of the algorithm provided in [20] with default value for the data processing inequality tolerance parameter. CLR: it is an extension of the relevance networks class of algorithms [11], which predicts regulations between transcription factors and genes making use of the mutual information score. CLR proposes an adaptive background correction step that is added to the estimation of mutual information. For each gene, the statistical likelihood of the mutual information score is computed within its network context. Then, for each transcription factor-target gene pair, the mutual information score 3
is compared to the context likelihood of both the transcription factor and the target gene, and turned into a z-score. We adopt the reference implementation of the algorithm provided in [20]. 2.2
Experimental protocol
We are interested in comparing the performance of the selected reverse engineering methods in inferring the underlying topology of regulatory networks. As proposed in [9], we focus on the estimation of the interaction structures between genes, rather than the strength of these interactions. The inferred adjacency matrix is symmetric and discretized with values in {0, 1} by thresholding. The binarization of the inferred network obtained with RegnANN is achieved using by using a threshold value of 0.5. In the case of KELLER, the reference implementation [9] returns a symmetric and discrete (with values in {0, 1}) adjacency matrix – binarization is obtained by rounding values bigger than 10−3 to 1. Results obtained with ARACNE are discretized as in the case of KELLER. Usually, the cutoff value for the mutual information is estimated for each data-set separately using a significance measure (e.g.: the F-score [21]) or building a Precision-Recall curve and selecting the desired threshold value [10]. Here, the threshold value is kept constant to avoid the introduction of a selection bias in the outcome of the ARACNE algorithm. The same procedure is applied to CLR (threshold value of 10−3 ). Gene expression profiles (synthetic or biological data) are linearly rescaled in [-1,1], before topology inference. The accuracy (in terms of MCC) of each inference methods is firstly evaluated on synthetic data (Section 3) by varying the topology of the network, the amount of data available and the method adopted to synthesize the data. Once the topology of the network is (randomly) generated, the desired amount of data is synthesized, the network inference methods are applied and the MCC score calculated. To account for intrinsic instability of each inference method, data generation and network inference is repeated 10 times for a given network topology. Thus, the MCC score is estimated as the mean of the 10 independent runs. The error of the measurement is expressed as twice the standard deviation. Finally, to generalize away from the generated network topology, the entire procedure is repeated 10 times and the final MCC scores is calculated as the mean accuracy for each run. Similarly the error is estimated as the mean of the error for each run. Finally, the performance of the four network inference algorithms is tested on 7 selected gene network modules of Escherichia coli [22]. While ARACNE, CLR and KELLER are deterministic algorithms2 , RegnANN may produce different results depending on the random initialization of the weights in the ensemble of multi-layer perceptrons. Thus, in order to smooth out possible local minima, we adopted a majority voting schema: for each network module, the RegnANN algorithm is applied 10 times and the inferred adjacency matrices accumulated. The final topology is obtained selecting those links that appeared with a frequency higher than 7 (out of 10). The entire procedure is repeated 10 times and the final prediction is estimated as the mean and the associated error as twice the standard deviation of the 10 independent runs.
3
Data
Synthetic data: we benchmark the reverse engineering algorithms here considered using both synthetic and biological data. Synthetic data are obtained considering two different network topologies: Barabasi-Albert [23] and Erd¨os-R´enyi [24]. Furthermore, we apply two different gene expression synthesis methods: the first one considers only linear correlation among selected genes (SLC), the second one is based on a gene network/expression simulator recently proposed to assess reverse engineering algorithms (GES [25]). Escherichia coli data: the task for the biological experiments is the inference of a few transcriptional subnetworks of the model organism Escherichia coli starting from a set of steady state gene expression data. The data are obtained from different sources and they consist of three different elements, namely the whole Escherichia coli transcriptional network, the set of the transcriptional sub2 Given a particular input, the algorithm will always produce the same output, always passing through the same sequence of states.
4
networks and the gene expression profiles to infer the subnetworks from. The Escherichia coli transcriptional network is extracted from the RegulonDB3 database, version 6.4 (2010) and it consists of 3557 experimentally confirmed regulations between 1442 genes, amongst which 172 transcription factors. The 117 subnetworks are defined in [26]: in our experiments we use 7 of these subnetworks, including a number of genes ranging from 7 to 104. The expression data have been originally used in [11] and consist of 445 Escherichia coli Affymetrix Antisense2 microarray expression profiles for 4345 genes, collected under different experimental conditions such as PH changes, growth phases, antibiotics, heat shock, varying oxygen concentrations and numerous genetic perturbations. MAS5 preprocessing is chosen among the available options (MAS5, RMA, gcRMA, DChip).
4
Results
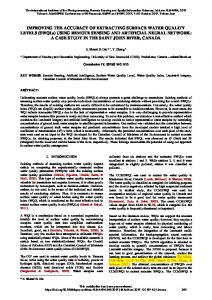
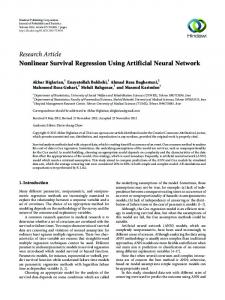
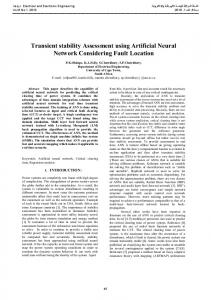
Hereafter we present a selection of the outcomes of the experimental evaluation on both synthetic and biological data. Synthetic data: Figure 2 shows a comparison of the results obtained on synthetic networks of size 100 nodes applying the four different algorithms. Results are obtained varying the topology of the network, the data synthesis method adopted and the amount of data available: the data ratio – the ratio of the number of expression profiles to the number of nodes. Gene expression values are linearly rescaled in [−1, 1]. On the selected test-bed, the four algorithms show consistent MCC curves: RegnANN and KELLER show better scores than the ones obtained with ARACNE and CLR. RegnANN often outperforms KELLER in a number of setups, especially in the case of Erd¨os-R´enyi topology when little amount of data is available. In this case, data ratio 50% (Figure 2c and 2d), KELLER-SLC scores 0.37±0.04 and RegnANN-SLC scores 0.81 ± 0.08 while KELLER-GES scores 0.25 ± 0.02 and REGNANNGES scores 0.36 ± 0.04. On the contrary, CLR shows the worst MCC scores in all the condition here considered. Selected Escherichia coli subnetworks: Table 1 summarizes the results obtained on a selection of Escherichia coli gene subnetworks [22] for the four inference algorithms. Gene expression values are linearly rescaled in [−1, 1]. Table 1: MCC scores of the different network inference algorithms on the selected Escherichia coli network modules. Column ID indicates the id of the network module as in [22], the density of the module is the ratio of the number of links to the square of the number of nodes. ID 81 6 12 75 88 96 94
Density 0.245 0.189 0.180 0.133 0.100 0.001 0.000
N.Nodes 7 13 10 16 19 104 81
N.Links 12 32 18 34 36 18 2
ARACNE 0.78 0.13 0.43 0.10 0.00 0.08 0.09
CLR 0.45 0.29 0.42 0.24 0.17 0.02 0.02
KELLER -0.12 0.02 0.63 0.10 -0.07 0.00 0.15
RegnANN 0.4 0.3 0.32 0.23 -0.05 0.00 0.026
Err 0.1 0.1 0.00 0.08 0.02 0.01 0.001
Table 1 indicates great variability of the MCC scores across the different network modules for all the inference methods tested. ARACNE scores range from 0.78 (module 81) to 0.00 (module 88). CLR values range between 0.45 and 0.02 for module 81 and 96 respectively. KELLER scores range between 0.63 and −0.12 (module 12 and module 81 respectively). Finally RegnANN scores range between 0.32 ± 0.00 4 (module 12) and −0.05 ± 0.02 (module 88). It is interesting to note that the MCC score varies unevenly for the different inference algorithms with respect to the module network 3 4
http://regulondb.ccg.unam.mx/ In this case the error associated to the measure is 0: the very same result is obtained for all repetitions.
5
Top.: Barabasi , Gen.: SLC , N: 100 − Accuracy ARACNE
CLR
RegnANN
KELLER
0.8
0.8
0.6
0.6
0.4
− − − − −
0.2
− − − 50%
mcc
mcc
Top.: Barabasi , Gen.: GES , N: 100 − Accuracy ARACNE
− − − − −
− − − − −
− − − − −
0.4
− − −
200%
− − − 50%
−
−
− − −
− − −
100% 150% Data Ratio
200%
(b)
Top.: Erdos , Gen.: GES , N: 100 − Accuracy CLR
− − − − − − −
− − − −
−
(a) ARACNE
KELLER
− −
0.2
100% 150% Data Ratio
RegnANN
−
− −
− −
− − −
CLR
RegnANN
Top.: Erdos , Gen.: SLC , N: 100 − Accuracy
KELLER
ARACNE
CLR
RegnANN
− − 0.8
−
− − −
−
−
−
−
0.8
KELLER
− 0.6
−
−
0.4
0.2
− − − − − − 50%
− − − − −
− − −
− −
−
−
−
−
− −
− −
− − 100% 150% Data Ratio
mcc
mcc
− −
− 0.4
− − −
− −
− −
− −
− − 50%
− −
− −
− −
0.2
200%
(c)
−
−
0.6
100% 150% Data Ratio
200%
(d)
Figure 2: MCC scores of ARACNE CLR RegnANN and KELLER on syntheric data. a) Results obtained on Barabasi networks adopting GES for data generation. b) Barabasi networks and SLC data generation. c) Results obtained on Erd¨os-R´enyi networks adopting GES for data generation. d) MCC scores on on Erd¨os-R´enyi networks and SLC data generation.
density (the ratio of the number of links to the square of the number of nodes), e.g.: ARACNE scores 0.13 on module 6 (density D = 0.189) and scores 0.43 on module 12 (density D = 0.189). On the same two modules, CLR scores 0.29 and 0.39 respectively while KELLER scores 0.02 and 0.63. On the other hand, RegnANN are more homogeneous: it scores 0.3 ± 0.1 and 0.32 ± 0.00 on module 6 and module 12 respectively. These results suggest that the correctness of the inferred network depends on the topological properties of the modules (the very same expression values are used to infer the different gene sub-networks), in accordance to findings in [21]. 6
5
Conclusion
In this work we presented a novel method for network inference based on an ensemble of multilayer perceptrons configured as multi-variable regressor (RegnANN). We compared its performance to the performance of three different network inference algorithms (ARACNE, CLR and KELLER) on the task of reverse engineering the gene network topology, in terms of the associated MCC score. Our extensive evaluation indicates that the newly introduced RegnANN shows performance scores that compare very favorably with all the other inference methods tested, often outperforming each single one on the selected synthetic test-bed. On the other hand, our results on the biologic data indicates that the above differences in performance are not present. The results show that other factors may influence the accuracy scores in network reconstruction. Thus, further analysis and experimentation is required to fully test the general performance of the proposed methods, also considering potential variability due to the unconstrained biological factors impacting the inference outcome (e.g.: larger network or hidden regulators, noise in the data, effects due to data normalization procedures). An extended version of this paper comprising detailed description of all the methods here applied and also extending the evaluation to possible variability sources in gene network inference can be found on arXiv: M. Grimaldi, G. Jurman, R. Visintainer. Reverse Engineering Gene Networks with ANN: Variability in Network Inference Algorithms, arXiv:1009.4824 [q-bio.MN]. Acknowledgments The author want to thank Cesare Furlanello for his precious remarks and suggestions. The authors acknowledge funding by the European Union FP7 Project HiperDART, by the Italian Ministry of Health Project ISITAD (RF2007conv. 42), and by the PAT funded Project Envirochange.
References [1] L. Glass and S.A. Kauffman. The logical analysis of continuous, non-linear biochemical control networks. J. Theor. Biol., 39:103–129, 1973. [2] V. Bansal, M. Belcastro, A. Ambesi-Impiombato, and D. di Bernardo. How to infer gene networks from expression profiles. Mol. Syst. Biol., 122(3):78, 2007. [3] E.S. Dimitrova, A.S. Jarrah, R.C. Laubenbacher, and B. Stigler. A Gr¨obner fan method for biochemical network modeling. In D. Wang, editor, Proceedings of ISSAC 2007, pages 122–126, 2007. [4] S.A. Kauffman. The Origins of Order: Self-Organization And Selection in Evolution. OUP, Oxford, 1993. [5] N. Friedman, M. Linial, I. Nachman, and D. Pe´er. Using Bayesian networks to analyze expression data. J. Comput. Biol., 7:601–620, 2000. [6] F. Markowetz and R. Spang. Inferring cellular networks - a review. BMC Bioinform., 8(S6):S5, 2007. [7] G. Karlebach and R. Shamir. Modelling and analysis of gene regulatory networks. Nat. Rev. Mol. Cell Biol., 9:770–780, 2008. [8] F. He, R. Balling, and A.-P. Zeng. Reverse engineering and verification of gene networks: Principles, assumptions, and limitations of present methods and future perspectives. J. Biotechnol., 144(3):190–203, 2009. [9] L. Song, M. Kolar, and E.P. Xing. KELLER: estimating time-varying interactions between genes. Bioinformatics, 25(12):i128–i136, 2009. [10] A.A. Margolin, I. Nemenman, K. Basso, C. Wiggins, G. Stolovitzky, R. Dalla-Favera, and A. Califano. ARACNE: an algorithm for the reconstruction of gene regulatory networks in a mammalian cellular context. BMC Bioinform., 7(7):S7, 2006. [11] J.J. Faith, B. Hayete, J.T. Thaden, I. Mogno, J. Wierzbowski, G. Cottarel, S. Kasif, J.J. Collins, and T.S. Gardner. Large-Scale Mapping and Validation of Escherichia coli Transcriptional Regulation from a Compendium of Expression Profiles. PLoS Biol., 5(1):e8, 2007. [12] S. Lahabar, P. Agrawal, and P.J. Narayanan. High Performance Pattern Recognition on GPU. In Proceedings of NCVPRIPG 2008, pages 154–159, 2008. [13] B.W. Matthews. Comparison of the predicted and observed secondary structure of T4 phage lysozyme. Biochim. Biophys. Acta, 405(2):442–451, 1975.
7
[14] D. Stokic, R. Hanel, and S. Thurner. A fast and efficient gene-network reconstruction method from multiple over-expression experiments. BMC Bioinformatics, 10(1):253, 2009. [15] C. Bishop. Neural Networks for Pattern Recognition. OUP, New York, 1995. [16] D.F. Specht. The general regression neural network-rediscovered. Neural Networks, 6(7):1033–1034, 1993. [17] S. Scanzio, S. Cumani, R. Gemello, F. Mana, and P. Laface. Parallel implementation of Artificial Neural Network training for speech recognition. Pattern Recogn. Lett., 31(11):1302–1309, 2010. [18] I. Nemenman, G.S. Escola, W.S. Hlavacek, P.J. Unkefer, C.J. Unkefer, and M.E. Wall. Reconstruction of Metabolic Networks from High-Throughput Metabolite Profiling Data. Ann. N.Y. Acad. Sci., 1115:102– 115, 2007. [19] T.M. Cover and J. Thomas. Elements of Information Theory. Wiley, 2nd edition, 1991. [20] P. Meyer, F. Lafitte, and G. Bontempi. minet: A R/Bioconductor Package for Inferring Large Transcriptional Networks Using Mutual Information. BMC Bioinform., 9(1):461, 2008. [21] G. Altay and F. Emmert-Streib. Revealing differences in gene network inference algorithms on the network level by ensemble methods. Bioinformatics, 26(14):1738–1744, 2010. [22] J.M. Peregrin-Alvarez, X. Xiong, C. Su, and J. Parkinson. The Modular Organization of Protein Interactions in Escherichia coli. PLOS Comput. Biol., 5(10):e1000523, 2009. [23] A.L. Barabasi and R. Albert. Emergence of scaling in random networks. Science, 286(5439):509–512, 1999. [24] P Erd¨os and A Renyi. On Random Graphs. Publ. Math. Debrecen, 6:290–297, 1959. [25] B. Di Camillo, G. Toffolo, and C. Cobelli. A Gene Network Simulator to Assess Reverse Engineering Algorithms. Ann. N.Y. Acad. Sci., 1158, 2009. [26] C. Marr, F.J. Theis, L.S. Liebovitch, and M.-T. H¨utt. Patterns of Subnet Usage Reveal Distinct Scales of Regulation in the Transcriptional Regulatory Network of Escherichia coli. PLoS Comput. Biol., 6(7):e1000836, 2010.
8