RESEARCH PAPER
RESEARCH PAPER
Epigenetics 6:3, 317-325; March 2011; © 2011 Landes Bioscience
Regulation of KEAP1 expression by promoter methylation in malignant gliomas and association with patient’s outcome Lucia Anna Muscarella,1,† Raffaela Barbano,1,7,† Vincenzo D’Angelo,2 Massimiliano Copetti,3 Michelina Coco,1 Teresa Balsamo,1 Annamaria la Torre,1 Angelo Notarangelo,4 Michele Troiano,5 Salvatore Parisi,5 Nadia Icolaro,2 Domenico Catapano,2 Vanna Maria Valori,6 Fabio Pellegrini,3,8 Giuseppe Merla,4 Massimo Carella,4 Vito Michele Fazio1,9,* and Paola Parrella1,* 1 Laboratory of Oncology; 2Department of Neurosurgery; 3Unit of Biostatistics; 4Laboratory of Medical Genetics; 5Department of Radiotherapy; Department of Oncohaematology; IRCCS “Casa Sollievo della Sofferenza”; San Giovanni Rotondo, Italy; 7Department of General and Environmental Physiology; Centre of Excellence in Comparative Genomics (CEGBA); University of Bari; Bari, Italy; 8Department of Clinical Pharmacology and Epidemiology; Consorzio Mario Negri Sud; S. Maria Imbaro; Chieti; 9Molecular Medicine and Biotechnology Laboratory; University Campus BioMedico; Rome, Italy 6
These authors contributed equally to this work.
†
Key words: glioma, KEAP1, NRF2, chemotherapy, radiotherapy, prognosis
In light with the view that KEAP1 loss of function may impact tumor behavior and modify response to chemotherapeutical agents, we sought to determine whether KEAP1 gene is epigenetically regulated in malignant gliomas. We developed a Quantitative Methylation Specific PCR (QMSP) assay to analyze 86 malignant gliomas and 20 normal brain tissues. The discriminatory power of the assay was assessed by Receiving Operating Characteristics (ROC) curve analysis. The AUC value of the curve was 0.823 (95% CI: 0.764–0.883) with an optimal cut off value of 0.133 yielding a 74% sensitivity (95% CI: 63–82%) and an 85% specificity (95% CI: 64–95%). Bisulfite sequencing analysis confirmed QMSP results and demonstrated a direct correlation between percentage of methylated CpGs and methylation levels (Spearman’s Rho 0.929, p = 0.003). Remarkably, a strong inverse correlation was observed between methylation levels and KEAP1 mRNA transcript in tumor tissue (Spearman’s Rho -0.656 p = 0.0001) and in a cell line before and after treatment with 2-deoxy-5-azacytidine (p = 0.003). RECPAM multivariate statistical analysis studying the interaction between MGMT and KEAP1 methylation in subjects treated with radiotherapy and temozolomide (n = 70), identified three prognostic classes of glioma patients at different risk to progress. While simultaneous methylation of MGMT and KEAP1 promoters was associated with the lowest risk to progress, patients showing only MGMT methylation were the subgroup at the higher risk (HR 5.54, 95% CI 1.35–22.74). Our results further suggest that KEAP1 expression is epigenetically regulated. In addition we demonstrated that KEAP1 is frequently methylated in malignant gliomas and a predictor of patient’s outcome.
Introduction Malignant gliomas predominantly glioblastoma multiforme (GBM, WHO grade IV) account for approximately 80% of all primary brain tumor and are characterized by poor prognosis.1,2 Current treatment for malignant glioma patients is surgery associated with combined radio-chemotherapy. Although this integrated approach has resulted in a significant survival benefit, five year survival for glioblastoma is less than 4% and most of the patients die within two years from diagnosis.2 The dismal prognosis in malignant gliomas is attributed to its great tendency to infiltrate into adjacent normal brain tissues, lack of early diagnostic tool, high recurrence rate and high incidence of chemoresistance.3,4 The Keap1 (Kelch-like ECH-associated protein 1) protein tightly regulates the functions of Nrf2 (nuclear factor-erythroid
2-related factor 2), which plays a pivotal role in the cellular response to oxidative stress.5-8 Under basal conditions, Nrf2 is retained in the cytoplasm by the binding with Keap1 and it is maintained at a reduced level by the Keap1-dependent ubiquitination and proteasomal degradation systems. On exposure to oxidative stress, Keap1-dependent ubiquitin ligase activity is inhibited and Nrf2 can translocate to the nucleus, where it binds to consensus sequences on the target genes.9 Several evidences suggest that Keap1/Nrf2 system not only protects normal cells from carcinogenetic agents, but also promotes the survival of transformed cells under deleterious conditions.10,11 Initial reports uncovered mutations in the KEAP1 gene in non-small cell lung cancer (NSCLC) leading to a permanent Nrf2 activation.12,13 Mutations were often associated with loss of heterozygosity at the KEAP1 gene locus suggesting that biallelic inactivation is a common event in NSCLC.14 Somatic mutations
*Correspondence to: Paola Parrella and Vito Michele Fazio; Email:
[email protected] and
[email protected] Submitted: 10/25/10; Accepted: 12/06/10 DOI: 10.4161/epi.6.3.14408 www.landesbioscience.com Epigenetics
317
of the KEAP1 gene were also reported in patients affected by gall bladder tumors and in a breast cancer cell line.15,16 Among the mechanisms involved in the inactivation of cancer related genes promoter aberrant methylation plays a pivotal role in cancerogenesis. Promoter methylation at the KEAP1 locus was reported by Wang et al. in three out of four lung cancer cell lines and two out of five primary tumors.17 The region of the KEAP1 CpG island analyzed contains 62 CpG sites, and is located from -291 bp to -337 bp relative to the KEAP1 transcription start site. In silico analysis17 of this CpG rich region demonstrated many transcriptional regulatory elements including binding sites for AP2 and Sp1 transcription factor which are known to be involved in epigenetic regulation of gene expression.18-22 In this study, we sought to determine whether KEAP1 gene is epigenetically regulated in malignant gliomas and if promoter aberrant methylation may impact patient’s outcome. We found that KEAP1 aberrant promoter methylation is a frequent event in malignant gliomas and it is associated with reduced KEAP1 mRNA expression in tumor tissues. Moreover, treatment of a cell line bearing KEAP1 promoter methylation with 5-aza-2'-deoxycitidine was able to restore KEAP1 mRNA levels. Finally, correlations with patient’s outcome indicate that KEAP1 methylation status can contribute to disease progression prediction in glioma patients treated by radiotherapy and temozolomide. Results KEAP1 aberrant methylation is a frequent event in malignant gliomas. To determine KEAP1 methylation status a primers/probe set was designed to amplify the CpG region showing the highest frequency of methylation and containing putative transcriptional regulatory elements as described in the study by Wang et al.17 (Fig. 1A). KEAP1 methylation status was determined on DNA obtained from 86 gliomas (28 FFPE samples and 58 snap frozen specimens) and 20 normal brain tissues. The median values and InterQuartile Ranges (IQR) of KEAP1/ACTB ratios were 0 (IQR 0-0) for normal brain tissue (NBT) and 3.76 (IQR 0–29.79) for tumor specimens (p = 0.000005). No differences in KEAP1/ACTB ratios were demonstrated among paraffin embedded samples and snap frozen specimen. The discriminatory power of the KEAP1 QMSP assay was assessed by estimating the area under the ROC curve, using methylation levels in normal brain tissues and tumor samples. The AUC value was 0.823 (95% CI: 0.764–0.883) (Sup. Fig. 1) with an optimal cut off value of 0.133 yielding a 74% sensitivity (95% CI: 63–82%) and an 85% specificity (95% CI: 64–95%). To confirm QMSP results, we analyzed KEAP1 methylation status using sequencing of bisulfite-treated genomic DNA on
eight glioma samples and the ANGM-CSS cell line. A 304 bp region containing 19 CpGs and including the QMSP primers/ probe set was cloned in a vector and ten clones for each sample were sequenced (Fig. 1B). This analysis confirmed results obtained by QMSP showing a low percentage of methylated CpGs in samples with low methylation levels (n = 3) and high percentage of methylated CpGs in tumors with high methylation levels (n = 5) (Spearman’s Rho 0.929 p = 0.003). Aberrant KEAP1 methylation is associated with reduced mRNA expression. We sought to determine whether KEAP1 methylation correlated with mRNA expression by analyzing 25 glioma samples (9 unmethylated and 16 methylated samples). A strong inverse correlation was demonstrated between methylation levels and KEAP1 mRNA expression (Spearman’s Rho -0.656 p = 0.0001). The median values and Interquartile ranges (IQR) of KEAP1/RPLPO ratios were 194.80 (IQR 128.30–211.70) in sample showing methylation above the cut off value (M) and 263.10 (IQR 204.22–372.52) in tumors with methylation levels below the cut off (UM) (p = 0.006) (Fig. 2A). The relationship between methylation and gene expression was further confirmed by treating the ANGM-CSS cell line with 5-Aza-2'deoxycytidine. After treatment QMSP analysis of the ANGM-CSS cell line at 48 h demonstrated a 63% decrease in KEAP1/ACTB ratios (Fig. 2B) associated with a 74% increase of KEAP1 transcript as determined by qRT-PCR (Fig. 2C). KEAP1 methylation is a predictor of outcome in glioma patients. We determined whether KEAP1 methylation correlates with patient’s pathological characteristics and outcome. Since MGMT methylation status is to date the main predictive marker of response to chemo-radiotherapy in glioma patients, we included these data in the analysis. MGMT methylation was previously determined by QMSP in 50 of the 86 malignant gliomas included in this study as well as in the normal brain tissues.24 In this work, we extended the analysis to the additional 36 malignant glioma cases. The median values and Interquartile ranges (IQR) of MGMT/ACTB ratios were 0 (IQR 0-0) for normal brain tissue (NBT) and 2.66 (IQR 0–41.23) for the total population of 86 patients (p = 0.000001 Mann-Whitney Test). The AUC value was 0.796 (95% CI: 0.743–0.849) (Sup. Fig. 1B) and the optimal cut off value of 0.219 yielded a 66% sensitivity (95% CI: 56–75%) and an 89% specificity (95% CI: 73–96%). Follow-up data were available for 76 patients. In univariate time to event analyses MGMT and KEAP1 methylated status were both associated with reduced risk of disease progression (HR = 0.36; 95% CI 0.17–0.85, p = 0.017 for MGMT and HR = 0.47, 95% CI 0.22–0.98, p = 0.043 for KEAP1) (Sup. Table 2). These results were confirmed by Kaplan-Meier analyses
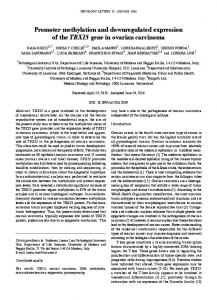
Figure 1 (See opposite page). KEAP1 promoter methylation analysis. (A) Primers design for QMSP and bisulfite sequencing. The original genomic sequence of the KEAP1 promoter region is shown. Highlighted large capital CpGs indicate potential methylation sites. Our QMSP produced 111 bp amplicons (QMSP_Forward, QMSP_Probe, QMSP_Reverse). Primers for bisulfite sequencing (black arrows) were placed in areas completely lacking CpGs to amplify both methylated and unmethylated alleles with equal efficiency. The PCR product for bisulfite sequencing contained 19 CpGs between the two primers. *CpGs in Sp1 putative regulatory element; ‡CpG in a putative AP2 regulatory element. (B) Distribution of methylated CpGs in the KEAP1 gene promoter, long arrows containing 19 circles indicate discrete clones of KEAP1 PCR product. ○, unmethylated CpGs; ●, methylated CpGs; circles in gray rectangles indicate CpGs located in putative transcription regulatory elements. Electropherograms show one out of the ten clones sequenced for ANGM-CSS cell line and the three representative glioma samples. 318
Epigenetics
Volume 6 Issue 3
Figure 1. For figure legend, see page 318.
www.landesbioscience.com Epigenetics
319
analysis, although this lack of association might be due to the short median follow up time. In multivariate Cox regression analysis including age, sex, WHO grading and number of surgery, only MGMT methylation was associated with a lower risk of disease progression (HR 0.36, 95% CI 0.15–0.86; p = 0.02). We then studied the possible interaction between MGMT and KEAP1 methylation in the patient’s cohort treated by both radiotherapy and temozolomide (n = 70) using the RECPAM method. The tree-growing algorithm modeled hazard ratios after a Cox regression with age, gender, WHO grade and number of surgeries as global adjustment variables.25,26 As shown in Figure 3B, three classes of glioma patients at different risks to progress were identified. The reference category is represented by the subgroup with the lowest incidence of progression events. Thus, the HR for all the other subgroups was estimated with respect to the reference class. The most important variable in discriminating the risk of progression was MGMT status. Patients showing unmethylated MGMT promoter were at higher risk to progress (HR 3.40, 95% CI 1.34–8.66). In MGMT methylated patients, however, the risk of progression was further discriminated by KEAP1 status. In fact the subgroup characterized by methylated MGMT promoter and unmethylated KEAP1 promoter showed the highest risk to progress (HR 5.54, 95% CI 1.35–22.74) (Fig. 3B). Discussion
Figure 2. KEAP1 promoter methylation correlates with mRNA expression. (A) Boxplot showing KEAP1 mRNA transcript levels in samples methylated above (M) and below (UM) the cut off value. The boxes mark the interquartile range (interval between the 25th and 75th percentile). The lines inside the boxes denote median values. (B) Changes in KEAP1 methylation levels in the ANGM-CSS cell line before (untreated) and after treatment with 5-azacytadine at 24 h (AZA-24) and 48 h (AZA-48). Error bars indicate the standard deviation of three different experiments. (C) Changes in mRNA transcript levels in the ANGM-CSS cell line before (Untreated) and after treatment with 5-azacytidine at 24 h (AZA-24) and 48 h (AZA-48). Error bars indicate the standard deviation of three different experiments.
(Fig. 3A), which demonstrated an association between better outcome and methylated status for both genes (p = 0.01 for MGMT and p = 0.03 for KEAP1). No association was found between KEAP1 or MGMT methylation status in overall survival
320
Several studies have tried to uncover the methylome of malignant gliomas but the epigenetic signature of this disease remains still partially defined.27-29 Here, we identified KEAP1 as a novel methylated gene in malignant gliomas and investigated the possible contribution of KEAP1 promoter methylation to the poor prognosis of malignant glioma patients. Aberrant promoter methylation was detected in approximately two thirds of the glioma samples by QMSP analysis. In primary tumors, promoter methylation was confirmed by bisulfite sequencing analysis. Moreover an inverse correlation with mRNA expression was demonstrated in both primary tumors and in a cell line derived from a glioblastoma patient. These results are in agreement with in silico analysis17 of the KEAP1 promoter, which indicates that the CpG island analyzed in our QMSP assay contains transcriptional regulatory elements including binding sites for AP2 and Sp1 transcription factor known to be involved in epigenetic regulation of gene expression.18-22 Since somatic mutations of the KEAP1 gene were previously reported in other tumor types,13,14 we queried the publicly available COSMIC database maintained by the Sanger Institute (www.sanger.ac.uk/genetics/CGP/cosmic/; accessed October 5, 2010). KEAP1 sequencing analysis data were available for 22 glioblastoma samples and no pathological variations were detected suggesting that KEAP1 somatic mutations are infrequent in gliomas.30 Indeed, Solis et al.31 have recently reported in NSCLC absent or reduced Keap1 expression as determined by IHC in 56% of NSCLC, but a very low frequency of KEAP1 mutation. These results further suggest that epigenetic mechanisms play a major role in KEAP1 inactivation in cancer cell.
Epigenetics
Volume 6 Issue 3
Figure 3. KEAP1 promoter methylation is a predictor of disease progression in malignant gliomas. (A) Kaplan-Meier curves showing the relationship of KEAP1 and MGMT methylation with progression free survival (PFS). An association between better outcome and methylated status was demonstrated for both KEAP1 (left part p = 0.01 Long rank Test) and MGMT (right part p = 0.01 Long rank test). (B) Identification of glioma patients subgroups at different risk to progress by RECPAM analysis. Splitting variables are shown between branches, while condition sending patients to left or right sibling is on relative branch. Class 1 with lowest mortality was reference category (HR = 1). Circles indicate subgroups of patients. Squares indicate patient subgroup RECPAM classes. Numbers inside circles and squares represent the number of events (top) and the number of non-events (bottom), respectively.
The current treatment of malignant glioma is a combination of radiotherapy and alkylating agent temozolomide. To date the inactivation of MGMT expression by promoter methylation is the main predictor of outcome in this patients.32,33 In fact, alkylating agents induce cell death by forming cross links between adjacent DNA strands through the alkylation of the O6 position of guanine. Transcriptional active MGMT rapidly removes the alkyl adducts preventing the formation of cross links thereby causing resistance to alkylating drugs.34 MGMT promoter methylation with consequent loss of Mgmt protein expression reduces the DNA repair activity of glioma cells overcoming resistance to alkylating agents and consequently inducing the activation of proapoptotic pathways.32 In our study, as expected MGMT promoter methylation was associated with a reduced risk to progress. However, when the interaction between KEAP1 and MGMT methylation was evaluated,
the subgroup characterized by simultaneous methylation of the two genes was at lower risk to progress, whereas patients with MGMT methylation but KEAP1 unmethylated status showed the worse prognosis. Since upregulation of Nrf2 through Keap1 deregulation has been linked to resistance to a variety of anticancer drugs,11,35-38 these findings may seem puzzling. However, in recent years, several lines of evidence, suggest that the activation of the oxidative stress response may regulate proapoptotic and apoptotic activities inducing programmed cell death rather than survival in cancer cells.39 Indeed, there are evidences that the disruption of the Keap1/Nrf2 interaction may increase apoptotic activity.40,41 Therefore, reduced KEAP1 expression in MGMT methylated tumors may enhance the effect of MGMT downregulation on inducing programmed cell death. On the other side in tumors with only MGMT methylation, physiological regulation of the Nrf2 by Keap1 may promote the NRF2 mediated survival
www.landesbioscience.com Epigenetics
321
of cancer cell counterbalancing the beneficial effects of MGMT downregulation. Taken together these evidences further suggest that KEAP1 epigenetic regulation may affect glioma cell survival in patients treated with radiotherapy and temozolomide. Although combined treatment with radiotherapy and temozolomide has improved survival, the majority of the patients affected by malignant glioma will die within two years from the diagnosis. Thus there is a need for novel therapeutical strategies that may improve patient’s outcome. It remains still to be determined, whether aberrant KEAP1 promoter methylation may play a role in resistance to chemotherapeutical compounds other than alkylating agents in malignant gliomas. Nrf2 upregulation leads ultimately to the increased transcription of antioxidant proteins and drug efflux system involved in multidrug resistant phenotypes.7 Interestingly, increased expression of these proteins is frequently found in glioma tissues as well as in glioma cancer stem cells.3 Jiang et al.35 have reported in endometrial cancer, an association between high Nrf2 levels and chemoresistance. In particular, silencing of NRF2 in a resistant cell line was able to increase susceptibility to chemotherapeutic treatment. Likewise, the inhibition of Nrf2 by overexpressing Keap1 was able to enhance chemosensitivity in both cell line and in a SCID mouse model.35 Thus the elucidation of the role of KEAP1 methylation in chemoresistance would be of primary importance when novel therapeutical strategies, such as chemotherapeutical compounds incorporated nanoparticles,42,43 are evaluated for application in the clinical setting. One important aspect of epigenetic alterations is that they are potentially reversible, and in vitro and animal model studies indicate that treatment with demethylating agents can reverse drug resistance.44 Taken together these observations strongly suggest that pharmacological modulation of the Keap1/Nrf2 system and in particular reversal of KEAP1 methylation may be able to increase the efficacy of chemotherapeutic drugs in cancer cells. In summary, we show that the NRF2 negative regulator KEAP1 is frequently methylated in malignant gliomas suggesting that its reduced expression may play a role in the development and progression of this deadly disease. KEAP1 methylation was also associated with patient’s outcome and may contribute to prediction of disease progression in patients treated with current chemo-radiotherapy regimen. Since deregulation of the Nrf2/Keap1 system has been linked to chemoresistance in several tumor types, the reversal of KEAP1 methylation could also represent a novel strategy to increase sensitivity of glioma cells to a variety of anticancer drugs. Materials and Methods Patients and samples. We analyzed 86 glioma patients treated by surgery at the Department of Neurosurgery, IRCCS Casa Sollievo della Sofferenza, San Giovanni Rotondo (FG), Italy. Of those tumors, 28 were formalin-fixed paraffin embedded (FFPE) samples and 58 snap frozen specimens. After surgery, the majority of the patients were treated with radiotherapy and the alkylating agent temozolomide (TMZ) at dose of 75 mg/m2 / day x 7 days/week for 6 weeks followed by adjuvant TMZ
322
(200 mg/m2 /day x 5 days, every 28 days for 5–6–12 cycles). The median total dose of radiotherapy delivered was 63.5 Gy (range, 45–66 Gy), with conventional fractionation according to ICRU recommendations. The median follow up time was 14 months (IQR 8–21 months). Clinicopathological characteristics of the patient’s cohort are shown on Supplemental Table 1. As control KEAP1 methylation status was analyzed on DNA sample extracted from 20 histologically confirmed normal brain tissues obtained from autopsies. All human materials used in the study were collected according to the guidelines of the local ethical committee. Prior written and informed consent was obtained from each of the patients in accordance with Institutional guidelines. Cell culture and 5-azacytidine (5-Aza) treatment. The ANGM-CSS cell line derived from a glioblastoma patients (deposited to European Collection of Cell Cultures, ECACC cat n° 08040401; Notarangelo et al., under review) was cultured at 37°C, 95% CO2 in DMEM/F12 (Invitrogen, Carlsbad, CA), supplemented with 10% fetal bovine serum and 1% penicillin/ streptomycin (Invitrogen). For treatment with 5-Aza cells were plated at 60% confluency 24 h before treatment. Then cells were treated with 5 μm 5-Aza and harvested at 24 or 48 h. DNA and RNA were extracted as described previously in reference 45. DNA and RNA extraction from tissues. DNA was extracted from one half of frozen sections after ensuring that tumor contained more than 70% of tumor cells.46 Total RNA was extracted from the second half of the sample using the Invitrogen TRIzol reagent (Carlsbad, CA).47 RNA quality was measured by using 2100 Expert Analyzer (Agilent Technology) and only RNA with RIN (RNA Integrity Number) ≥ 7.0 was processed. DNA and RNA concentrations were quantified by the absorbance measurement at 260 and 280 nm using the Nanodrop spectrophotometer. Bisulfite conversion. DNA extracted from normal brain, tumor samples and ANGM-CSS cell line were subjected to bisulfite treatment and DNA purification using the Epitect Bisulfite kit (Qiagen Sci, MD) according to manufacturer instruction. Bisulfite-modified DNA from the same treatment was used as template for fluorescence-based real-time Quantitative Methylation Specific PCR (QMSP) and bisulfite direct sequencing. Quantitative methylation specific PCR (QMSP). Real time PCR was performed for KEAP1 using the following primers/ probe set: forward 5'-TGC GGT CGT CGG ATT ACG AGG TCG-3', reverse 5'-CTT CCA TCT CCC GAT TTC GTT AC-3'; probe 5'-FAM-GTG GCG CGT AGT TTC GCG AG-TAMRA-3' yielding a 111 bp amplicon (Fig. 1A). MGMT promoter methylation status was determined by using primers/probe set previously described in reference 24. As reference gene a primers/probe set specific for the unmethylated promoter region of the ACTB gene was used: forward 5'-TGG TGA TGG AGG AGG TTT AGT AAG T-3'; reverse 5'-AAC CAA TAA AAC CTA CTC CTC CCT TAA-3'; probe 5'-FAM ACC ACC ACC CAA CAC ACA ATA ACA AAC ACA TAMRA-3', yielding an amplicon size of 133 bp.24 Calibration curves for both target and reference genes were construed using serial dilutions (90-0.009 ng) of a commercially available fully methylated DNA (CpGenome Universal Methylated DNA, Serologicals Corp., Norcross, GA).
Epigenetics
Volume 6 Issue 3
Amplification reactions were carried out in triplicate in a volume of 10 μL that contained 50 ng bisulfite-modified DNA, 600 nM forward and reverse primers, 200 nM probe, 0.6 U of Platinum Taq polymerase (Invitrogen, Inc., Rockville, MD), 200 μM each of dATP, dCTP, dGTP, dTTP and 2 μl of PCR buffer.24 PCR conditions were as follows: one step at 95°C for 3 min, 50 cycles at 95°C for 15 seconds and 60–62°C for 1 minute. PCR reactions were performed in 384-well plates on a ABI PRISM 7900 Sequence detection system (Applied Biosystems, Carlsbad, CA) and were analyzed by SDS 2.1.1 software (Applied Biosystems, Foster City, CA). Each plate included calibration curves for the ACTB and KEAP1 or MGMT genes, patient DNA samples, positive (CpGenomeTM Universal Methylated DNA, Serologicals Corp., Norcross, GA) and negative (Universal Unmethylated DNA, Serologicals Corp., Norcross, GA) controls and multiple water blanks. The relative level of methylated DNA was determined as a ratio of KEAP1 or MGMT to ACTB and then multiplied by 1,000 for easier tabulation (average value of triplicates of gene of interest/average value of triplicates of ACTB x1,000). Bisulfite direct sequencing. After bisulfite conversion, a 304 bp DNA fragment of the KEAP1 promoter region located from -91 bp to -395 bp relative to the transcription start site (Fig. 1A), was amplified using primers specific for the bisulfite-converted sequence not containing CpGs. This region contains 19 CpG sites, 11 of which are included in the QMSP primers/probe set (forward, 7–11th sites; probe, 14–17th sites; reverse, 18th and 19th sites). Primer sequences are as follows forward: (5'-GAG GTT AGG AGT TTA AGG-3') and reverse (5'-CAA CCA AAC CCC CCT TCT C-3'). PCR products were cloned by using the One shot “TOP10F” cloning kit (Invitrogen Carlsbad, CA). Sequence reactions were performed on an automated sequencer (ABI 310; Applied Biosystem) using the ABI-PRISM big-dye Terminator Cycle Sequencing Ready Reaction kit (Applied Biosystem). Quantitative reverse transcription polymerase chain reaction (qRT-PCR). Reverse transcription was performed using High Capacity cDNA Reverse Transcription kit (Applied Biosystems). Fluorescence based RT-PCR (RT-qPCR) was set up in 384-well plates in a total volume of 10 μl containing 1 μl cDNA, 1 μl KEAP1 Taqman® Gene Expression Assays (Hs00202227_m1 Applied Biosystems) and 5 μl of PCR Master Mix (Applied Biosystems). Reactions were run on ABI PRISM 7900 Sequence detection system (Applied Biosystems). For each of the target genes transcription levels were normalized using the Human Large Ribosomal Protein, RPLPO (Applied Biosystems) as reference gene. A relative quantification method with standard curve was developed, mRNA levels in each sample were determined as the ratio of the KEAP1 expression level to the RPLPO expression and then multiplied by 1,000 for easier tabulation (KEAP1/ RPLPO x1,000).45 Statistical methods. Patients’ baseline characteristics were reported as median and interquartile range (IQR) or frequencies and percentages for continuous and categorical variables, respectively. Baseline comparisons were made using the Mann-Whitney
U-test for continuous variables and the chi-square test for categorical variables. The discriminatory power of MGMT and KEAP1 was assessed by estimating the area under the Receiver Operating Characteristics (ROC) curves, using methylation levels in normal brain tissues and tumor samples. The optimal cut-off was assessed maximizing jointly sensitivity and specificity. Sensitivity and specificity, computed at the optimal cut-off, were reported along with their 95% confidence intervals (CI). The area under the ROC curve (AUC) was also reported along its 95% CI. Glioma samples were classified as methylated (M) or unmethylated (UM) based on whether KEAP1 or MGMT to ACTB ratios were respectively above or below cut of values. Correlation between KEAP1/ACTB ratios and percentage of methylated CpGs or mRNA transcript levels were estimated using the Spearman rank coefficient. Differences in KEAP1 methylation and mRNA expression in the ANGM-CSS cell line were analyzed using the one way Analysis of Variance (ANOVA) and the unpaired t-test with Bonferroni correction for multiple comparisons. Time-to-event parameters were estimated using the KaplanMeier method and significance was assessed with a log-rank test. Time-to-event analysis was conducted also by means of univariate and multivariate Cox proportional hazards regression models. Risks will be reported as Hazard Ratios (HR) along with their 95% CI. Time to progression was defined as the time between surgery and the first progression event. Overall Survival Time was defined as the time between surgery and death. Furthermore to evaluate interactions between MGMT and KEAP1, and to identify distinct and homogeneous subgroups of patients in terms of time to progression and overall survival, the RECPAM method was used.25,26 This tree-based method integrates the advantages of main effects Cox regression and tree-growing techniques. At each partitioning step the method chooses the covariate and its best binary split to maximize the difference in the outcome of interest. The algorithm stops when user defined conditions (stopping rules) are met. To obtain more robust and stable split, a permutation approach was adopted to choose the best splitting variable. Global adjustment for age, gender, WHO grading and number of surgeries was accounted for. A p value < 0.05 was considered for statistical significance. All analyses were performed using SAS Release 9.1 (SAS Institute, Cary, NC). For the RECPAM analysis we used an SAS macro routine written by one of the authors (F. Pellegrini). Acknowledgements
This work is supported by Grants from the Ministero della Salute (Italian Ministry of Health) IRCCS RC2009-RC2010 and Progetto Integrato Oncologia 2006. Note
Supplemental materials can be found at: www.landesbioscience.com/journals/epigenetics/article/14408
www.landesbioscience.com Epigenetics
323
References 1. Laws ER, Parney IF, Huang W, Anderson F, Morris AM, Asher A, et al. Survival following surgery and prognostic factors for recently diagnosed malignant glioma: data from the Glioma Outcomes Project. J Neurosurg 2003; 99:467-73; PMID: 12959431; DOI: 10.3171/jns.2003.99.3.0467. 2. Stupp R, Hegi ME, Mason WP, van den Bent MJ, Taphoorn MJ, Janzer RC, et al. Effects of radiotherapy with concomitant and adjuvant temozolomide versus radiotherapy alone on survival in glioblastoma in a randomised phase III study: 5 year analysis of the EORTCNCIC trial. Lancet Oncol 2009; 10:459-66; PMID: 19269895; DOI:10.1016/S1470-2045(09)70025-7. 3. Lu C, Shervington A. Chemoresistance in gliomas. Mol Cell Biochem 2008; 312:71-80; PMID: 18259841; DOI: 10.1007/s11010-008-9722-8. 4. Hunter SB, Brat DJ, Olson JJ, Von Deimling A, Zhou W, Van Meir EG. Alterations in molecular pathways of diffusely infiltrating glial neoplasms: application to tumor classification and anti-tumor therapy. Int J Oncol 2003; 23:857-69; PMID: 12963964. 5. Kensler TW, Wakabayashi N, Biswal S. Cell survival responses to environmental stresses via the Keap1Nrf2-ARE pathway. Annu Rev Pharmacol Toxicol 2007; 47:89-116; PMID: 12963964; DOI: 10.1146/ annurev.pharmtox.46.120604.141046. 6. Zhang DD. Mechanistic studies of the Nrf2Keap1 signaling pathway. Drug Metab Rev 2006; 38:769-89; PMID: 17145701 DOI:10.1080/03602530600971974. 7. Shen G, Kong AN. Nrf2 plays an important role in coordinated regulation of Phase II drug metabolism enzymes and Phase III drug transporters. Biopharm Drug Dispos 2009; 30:345-55; PMID: 19725016 DOI: 10.1002/bdd.680. 8. MacLeod AK, McMahon M, Plummer SM, Higgins LG, Penning TM, Igarashi K, et al. Characterization of the cancer chemopreventive NRF2-dependent gene battery in human keratinocytes: demonstration that the KEAP1-NRF2 pathway, and not the BACH1-NRF2 pathway, controls cytoprotection against electrophiles as well as redox-cycling compounds. Carcinogenesis 2009; 30:1571-80; PMID: 19608619; DOI: 10.1093/ carcin/bgp176. 9. Hayes JD, McMahon M. NRF2 and KEAP1 mutations: permanent activation of an adaptive response in cancer. Trends Biochem Sci 2009; 34:176-88; PMID: 19321346; DOI:10.1016/j.tibs.2008.12.008. 10. Ramos-Gomez M, Kwak MK, Dolan PM, Itoh K, Yamamoto M, Talalay P, et al. Sensitivity to carcinogenesis is increased and chemoprotective efficacy of enzyme inducers is lost in nrf2 transcription factor-deficient mice. Proc Natl Acad Sci USA 2001; 98:3410-5; PMID: 11248092; DOI: 10.1073/pnas.051618798. 11. Lau A, Villeneuve NF, Sun Z, Wong PK, Zhang DD. Dual roles of Nrf2 in cancer. Pharmacol Res 2008; 58:262-70; PMID: 18838122; DOI: 10.1016/j. phrs.2008.09.003. 12. Padmanabhan B, Tong KI, Ohta T, Nakamura Y, Scharlock M, Ohtsuji M, et al. Structural basis for defects of Keap1 activity provoked by its point mutations in lung cancer. Mol Cell 2006; 21:689700; PMID: 16507366; DOI:10.1016/j.molcel.2006.01.013. 13. Singh A, Misra V, Thimmulappa RK, Lee H, Ames S, Hoque MO, et al. Dysfunctional KEAP1-NRF2 interaction in non-small-cell lung cancer. PLoS Med 2006; 3:420; PMID: 17020408; DOI: 10.1371/journal. pmed.0030420. 14. Ohta T, Iijima K, Miyamoto M, Nakahara I, Tanaka H, Ohtsuji M, et al. Loss of Keap1 function activates Nrf2 and provides advantages for lung cancer cell growth. Cancer Res 2008; 68:1303-9; PMID: 18316592; DOI: 10.1158/0008-5472.CAN-07-5003.
324
15. Shibata T, Kokubu A, Gotoh M, Ojima H, Ohta T, Yamamoto M, et al. Genetic alteration of Keap1 confers constitutive Nrf2 activation and resistance to chemotherapy in gallbladder cancer. Gastroenterology 2008; 135:1358-68; PMID: 18692501; DOI:10.1053/j.gastro.2008.06.082. 16. Nioi P, Nguyen T. A mutation of Keap1 found in breast cancer impairs its ability to repress Nrf2 activity. Biochem Biophys Res Commun 2007; 362:816-21; PMID: 17822677; DOI:10.1016/j.bbrc.2007.08.051. 17. Wang R, An J, Ji F, Jiao H, Sun H, Zhou D. Hypermethylation of the Keap1 gene in human lung cancer cell lines and lung cancer tissues. Biochem Biophys Res Commun 2008; 373:151-4; PMID: 18555005; DOI: 10.1016/j.bbrc.2008.06.004. 18. Kopp MU, Winterhalter KH, Trueb B. DNA methylation accounts for the inhibition of collagen VI expression in transformed fibroblasts. Eur J Biochem 1997; 249:489-96; PMID: 9370358; DOI: 10.1111/j.1432033.1997.00489.x 19. Prokhortchouk A, Hendrich B, Jorgensen H, Ruzov A, Wilm M, Georgiev G, et al. The p120 catenin partner Kaiso is a DNA methylation-dependent transcriptional repressor. Genes Dev 2001; 15:1613-8; PMID: 11445535; DOI: 10.1101/gad.198501. 20. Macleod D, Charlton J, Mullins J, Bird AP. Sp1 sites in the mouse aprt gene promoter are required to prevent methylation of the CpG island. Genes Dev 1994; 8:2282-92; PMID: 7958895; DOI: 10.1101/ gad.8.19.2282. 21. Comb M, Goodman HM. CpG methylation inhibits proenkephalin gene expression and binding of the transcription factor AP-2. Nucleic Acids Res 1990; 18:3975-82; PMID: 1695733; DOI: 10.1093/ nar/18.13.3975. 22. Tate PH, Bird AP. Effects of DNA methylation on DNA-binding proteins and gene expression. Curr Opin Genet Dev 1993; 3:226-31; PMID: 8504247; DOI:10.1016/0959-437X(93)90027-M. 23. Wang J, Wang X, Jiang S, Lin P, Zhang J, Wu Y, et al. Establishment of a new human glioblastoma multiforme cell line (WJ1) and its partial characterization. Cell Mol Neurobiol 2007; 27:831-43; PMID: 17703357; DOI: 10.1007/s10571-007-9188-3. 24. Parrella P, la Torre A, Copetti M, Valori VM, Barbano R, Notarangelo A, et al. High specificity of quantitative methylation-specific PCR analysis for MGMT promoter hypermethylation detection in gliomas. J Biomed Biotechnol 2009; 2009:531692; PMID: 19503806; DOI: 10.1155/2009/531692. 25. Ciampi A, Negassa A, Lou Z. Tree-structured prediction for censored survival data and the Cox model. J Clin Epidemiol 1995; 48:675-89; PMID: 7730923; DOI:10.1016/0895-4356(94)00164-L 26. De Berardis G, Pellegrini F, Franciosi M, Belfiglio M, Di Nardo B, Greenfield S, et al. Clinical and psychological predictors of incidence of self-reported erectile dysfunction in patients with type 2 diabetes. J Urol 2007; 177:252-7; PMID: 17162057 DOI:10.1016/j. juro.2006.08.102. 27. Martinez R, Martin-Subero JI, Rohde V, Kirsch M, Alaminos M, Fernandez AF, et al. A microarray-based DNA methylation study of glioblastoma multiforme. Epigenetics 2009; 4:255-64. PMID: 19550145; DOI: 10.4161/epi. 28. Noushmehr H, Weisenberger DJ, Diefes K, Phillips HS, Pujara K, Berman BP, et al. Identification of a CpG island methylator phenotype that defines a distinct subgroup of glioma. Cancer Cell 2010; 17:510-22; PMID: 20399149; DOI 10.1016/j.ccr.2010.03.017. 29. Martinez R, Esteller M. The DNA methylome of glioblastoma multiforme. Neurobiol Dis 2010; 39:40-6; PMID: 20064612; DOI:10.1016/j.nbd.2009.12.030.
Epigenetics
30. Comprehensive genomic characterization defines human glioblastoma genes and core pathways. Nature 2008; 455:1061-8; PMID: 18772890; DOI: 10.1038/ nature07385. 31. Solis LM, Behrens C, Dong W, Suraokar M, Ozburn NC, Moran CA, et al. Nrf2 and Keap1 abnormalities in non-small cell lung carcinoma and association with clinicopathologic features. Clin Cancer Res 16:374353; PMID: 20534738; DOI: 10.1158/1078-0432. CCR-09-3352. 32. Esteller M, Garcia-Foncillas J, Andion E, Goodman SN, Hidalgo OF, Vanaclocha V, et al. Inactivation of the DNA-repair gene MGMT and the clinical response of gliomas to alkylating agents. N Engl J Med 2000; 343:1350-4; PMID: 11070098. 33. Hegi ME, Liu L, Herman JG, Stupp R, Wick W, Weller M, et al. Correlation of O6-methylguanine methyltransferase (MGMT) promoter methylation with clinical outcomes in glioblastoma and clinical strategies to modulate MGMT activity. J Clin Oncol 2008; 26:4189-99; PMID: 18757334; DOI: 10.1200/ JCO.2007.11.5964. 34. Gerson SL. MGMT: its role in cancer aetiology and cancer therapeutics. Nat Rev Cancer 2004; 4:296-307; PMID: 15057289; DOI: 10.1038/nrc1319. 35. Jiang T, Chen N, Zhao F, Wang XJ, Kong B, Zheng W, et al. High levels of Nrf2 determine chemoresistance in type II endometrial cancer. Cancer Res 2010; 70:548696. PMID: 20530669; DOI: 10.1158/0008-5472. CAN-10-0713. 36. Shim GS, Manandhar S, Shin DH, Kim TH, Kwak MK. Acquisition of doxorubicin resistance in ovarian carcinoma cells accompanies activation of the NRF2 pathway. Free Radic Biol Med 2009; 47:161931; PMID:19751820; DOI: 10.1016/j.freeradbiomed.2009.09.006. 37. Cho JM, Manandhar S, Lee HR, Park HM, Kwak MK. Role of the Nrf2-antioxidant system in cytotoxicity mediated by anticancer cisplatin: implication to cancer cell resistance. Cancer Lett 2008; 260:96-108; PMID: 18036733; DOI:10.1016/j.canlet.2007.10.022. 38. Singh A, Boldin-Adamsky S, Thimmulappa RK, Rath SK, Ashush H, Coulter J, et al. RNAi-mediated silencing of nuclear factor erythroid-2-related factor 2 gene expression in non-small cell lung cancer inhibits tumor growth and increases efficacy of chemotherapy. Cancer Res 2008; 68:7975-84; PMID: 18829555; DOI: 10.1158/0008-5472.CAN-08-1401. 39. Wang K, Fang H, Xiao D, Zhu X, He M, Pan X, et al. Converting redox signaling to apoptotic activities by stress-responsive regulators HSF1 and NRF2 in fenretinide treated cancer cells. PLoS One 2009; 4:7538; PMID: 19844581; DOI: 10.1371/journal. pone.0007538. 40. Lo SC, Hannink M. PGAM5, a Bcl-XL-interacting protein, is a novel substrate for the redox-regulated Keap1-dependent ubiquitin ligase complex. J Biol Chem 2006; 281:37893-903; PMID 17046835; DOI: 10.1074/jbc.M606539200. 41. Strachan GD, Ostrow LA, Jordan-Sciutto KL. Expression of the fetal Alz-50 clone 1 protein induces apoptotic cell death. Biochem Biophys Res Commun 2005; 336:490-5; PMID: 16137655; DOI:10.1016/j. bbrc.2005.08.127. 42. Jeong YI, Jin SG, Kim IY, Pei J, Wen M, Jung TY, et al. Doxorubicin-incorporated nanoparticles composed of poly(ethylene glycol)-grafted carboxymethyl chitosan and antitumor activity against glioma cells in vitro. Colloids Surf B Biointerfaces 2010; 79:149-55; PMID 20427160; DOI: 10.1016/j.colsurfb.2010.03.037. 43. Sarin H. Recent progress towards development of effective systemic chemotherapy for the treatment of malignant brain tumors. J Transl Med 2009; 7:77; PMID: 19723323; DOI: 10.1186/1479-5876-7-77.
Volume 6 Issue 3
44. Plumb JA, Strathdee G, Sludden J, Kaye SB, Brown R. Reversal of drug resistance in human tumor xenografts by 2'-deoxy-5-azacytidine-induced demethylation of the hMLH1 gene promoter. Cancer Res 2000; 60:6039-44; PMID: 11085525. 45. Savino M, Parrella P, Copetti M, Barbano R, Murgo R, Fazio VM, et al. Comparison between real-time quantitative PCR detection of HER2 mRNA copy number in peripheral blood and ELISA of serum HER2 protein for determining HER2 status in breast cancer patients. Cell Oncol 2009; 31:203-11; PMID: 19478388; DOI 10.3233/CLO-2009-0468.
46. Parrella P, Xiao Y, Fliss M, Sanchez-Cespedes M, Mazzarelli P, Rinaldi M, et al. Detection of mitochondrial DNA mutations in primary breast cancer and fine-needle aspirates. Cancer Res 2001; 61:7623-6; PMID: 11606403. 47. Scintu M, Vitale R, Prencipe M, Gallo AP, Bonghi L, Valori VM, et al. Genomic instability and increased expression of BUB1B and MAD2L1 genes in ductal breast carcinoma. Cancer Lett 2007; 254:298307; PMID: 17498870; DOI: 10.1016/j.canlet.2007.03.021.
www.landesbioscience.com Epigenetics
325