Epidemiology/Health Services Research O R I G I N A L
A R T I C L E
Relationship Between A1C and Fasting Plasma Glucose in Dysglycemia or Type 2 Diabetes An analysis of baseline data from the ORIGIN trial AMBADY RAMACHANDRAN, MD1 MATTHEW C. RIDDLE, MD2 CONRAD KABALI, PHD3
HERTZEL C. GERSTEIN, MD4 ON BEHALF OF THE ORIGIN INVESTIGATORS
OBJECTIVEdA1C measurement has advantages over measures of plasma glucose. Few studies have evaluated the A1C–fasting plasma glucose (FPG) relationship and whether oral antidiabetes drugs (OADs) and ethnic or geographic variations affect the relationship. Baseline A1C and FPG data from the Outcome Reduction with Initial Glargine Intervention (ORIGIN) trial participants were analyzed to 1) elucidate the relationship between A1C and FPG in people with moderate dysglycemia (A1C 5.6–9.0% [38–75 mmol/mol]) and additional risk factors for cardiovascular disease, 2) determine whether this relationship is altered by use of an OAD, and 3) study whether geographic and ethnic differences exist. RESEARCH DESIGN AND METHODSdAnalysis was performed of 12,527 participants with dysglycemia or early type 2 diabetes recruited in North America, South America, Europe, Australia, and Asia who comprised white, Latin American, Asian, black, and other ethnicities. The A1C-FPG relationships were analyzed using cubic B spline curves in all participants and in subgroups not using an OAD or using an OAD and comprising persons of different ethnic or geographic origin. RESULTSdA strong relationship between FPG in the range of 5.6–9.0 mmol/L and the corresponding A1C was seen across different geographic regions and ethnic groups. A smaller increase in A1C per unit increase in FPG occurred for persons taking an OAD versus those not taking an OAD. CONCLUSIONSdThe strong relationship between A1C and FPG in moderate dysglycemia is not significantly affected by ethnic or geographic differences. Use of an OAD alters the relationship and should be considered when interpreting A1C level.
A
1C is widely used in the management of diabetes both as a measure of long-term glycemic control and as a risk factor for diabetes complications (1–3). Many studies have demonstrated that A1C is correlated with and reflects other measures of glycemic control including FPG and 2-h plasma glucose (4,5). A1C has several advantages over direct measures of plasma glucose including
greater reproducibility and sample stability, less intrapersonal variation, and measurability in random versus fasting or postprandial blood samples (6,7). Limitations of A1C as a measure of glycemic control include genetically determined variations of hemoglobin structure that may alter the rate of glycation of the molecule or the lifespan of erythrocytes, thus altering the relationship between glucose
c c c c c c c c c c c c c c c c c c c c c c c c c c c c c c c c c c c c c c c c c c c c c c c c c
From the 1India Diabetes Research Foundation and Dr. A. Ramachandran’s Diabetes Hospitals, Chennai, India; the 2Division of Endocrinology, Diabetes, and Clinical Nutrition, Oregon Health and Science University, Portland, Oregon; the 3Population Health Research Institute, Hamilton Health Services, Hamilton, Ontario, Canada; and the 4Department of Medicine, McMaster University, Hamilton, Ontario, Canada. Corresponding author: Ambady Ramachandran,
[email protected]. Received 4 October 2011 and accepted 20 December 2011. DOI: 10.2337/dc11-1918. Clinical trial reg. no. NCT0069784, clinicaltrials.gov. This article contains Supplementary Data online at http://care.diabetesjournals.org/lookup/suppl/doi:10 .2337/dc11-1918/-/DC1. © 2012 by the American Diabetes Association. Readers may use this article as long as the work is properly cited, the use is educational and not for profit, and the work is not altered. See http://creativecommons.org/ licenses/by-nc-nd/3.0/ for details.
and A1C. These observations, together with known ethnic and regional variations of dietary habits, suggest that A1C and glucose levels may differ by ethnicity (8–10) or geographic location (11). However, little is known about the relationship between A1C and glucose levels in different populations. Furthermore, few studies have evaluated whether the relationship between A1C and glucose levels is affected by the use of glucose-lowering agents (4,8,12). The Outcome Reduction with Initial Glargine Intervention (ORIGIN) trial is a global trial testing whether targeting normal FPG levels with basal insulin glargine reduces cardiovascular outcomes compared with standard care in people taking 0 or 1 oral antidiabetes drugs (OADs) (13). Baseline A1C and FPG data collected from participants were analyzed in order to 1) elucidate the relationship between A1C and FPG in persons with moderate dysglycemia (A1C 5.6–9.0% [38–75 mmol/mol]) and additional risk factors for cardiovascular disease, 2) determine whether this relationship is altered by use of an OAD, and 3) study whether the relationship differs in persons from different geographic regions or of different ethnicity. RESEARCH DESIGN AND METHODSdThe design, methods, and baseline characteristics of the ORIGIN trial have previously been published (13). Briefly, ORIGIN included participants with established type 2 diabetes mellitus (T2DM) (82%) or with newly diagnosed T2DM, impaired fasting glucose, or impaired glucose tolerance based on either FPG or an oral glucose tolerance test (18%). This analysis is restricted to 12,527 participants with both a baseline FPG and concurrent A1C measurement who were recruited in North America, South America, Europe, and Pacific Rim countries (Australia, Asia, and India) and who comprised white, Latin American, Asian, black, and other ethnicities. FPG (glucose dehydrogenase method) and
care.diabetesjournals.org
Diabetes Care Publish Ahead of Print, published online February 8, 2012
DIABETES CARE
1
FPG-A1C relationship Table 1dBaseline characteristics of participants on glycemic treatment by use of OADs Overall
Participants Females Males Established diabetes Metformin Sulfonylurea Others Regions Europe South America North America Pacific Rim Ethnicity White Latin Asian Black Other
Not on an OAD
On an OAD
n
%
n
%
n
%
12,527 4,381 8,146 10,290 3,401 3,691 298
100 35.0 65.0 82.1 27.1 29.5 2.4
5,137 1,673 3,464 2,941 0 0 0
100 32.6 67.4 57.3 0 0 0
7,390 2,708 4,682 7,349 3,401 3,691 298
100 36.6 63.4 99.4 46.0 49.9 4.0
6,067 3,844 1,308 1,308
48.4 30.7 10.4 10.4
2,849 1,239 685 364
47.0 32.2 52.3 28.0
3,218 2,605 623 944
53.0 67.8 47.7 72.1
7,395 3,157 1,251 409 315
59.0 25.2 10.0 3.3 2.5
3,574 992 338 77 156
48.4 31.5 27.0 18.9 49.6
3,821 2,165 913 332 159
51.6 68.5 73.0 81.1 50.4
A1C (high-performance liquid chromatography method) levels were determined in local laboratories around the world. Minor differences in A1C assays and their
normal ranges across sites were accounted for by dividing the obtained result by the upper limit of the normal for the local assay and multiplying by 6%.
Statistical analysis All statistical analyses were performed at the ORIGIN project office in the Population Health Research Institute using S-Plus version 8.1.1 (Tibco Software, Palo Alto, CA). Baseline characteristics were summarized as either counts (%) or means (SDs). Cubic B spline curves with 95% CIs were generated to show the relationship between the A1C (dependent variable on the ordinate) and FPG in all participants, participants not on an OAD, participants on any OAD, and participants on metformin, a sulfonylurea, or any other OAD. Similar spline curves were also generated for persons using and not using an OAD within each geographic region and each ethnicity. FPG knots of 5.6 and 9.0 mmol/L that were selected by the statistical program for all participants were used for all of the analyses. These two knots identified three FPG intervals: ,5.6, 5.6–9.0, and .9.0 mmol/L. Linear regression models were generated to characterize the FPG-A1C relationship within each of these three intervals for 1) all participants, 2) participants on an OAD, and 3) participants
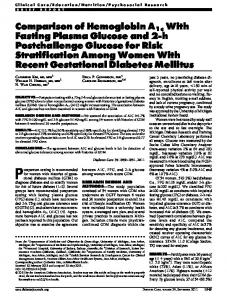
Figure 1dSpline curves with 95% CIs of the relationship between FPG and A1C are shown for the total group (A), persons on an OAD (B), persons not on an OAD (C), and persons on metformin (D), a sulfonylurea (E), or any other OAD (F). (A high-quality color representation of this figure is available in the online issue.) 2
DIABETES CARE
care.diabetesjournals.org
Ramachandran and Associates not on an OAD. The FPG-A1C relationship in each of these groups was therefore described by three regression models (i.e., one regression model per FPG interval). In each model, the dependent variable was A1C and the independent variables were FPG, the subgroups of interest, and terms for the interaction of FPG with the subgroups. Thus, the independent variables for each of the three equations generated for the entire group were FPG, OAD, and FPG 3 OAD, and the independent variables for those participants on an OAD included 1) each OAD category and interactions of FPG with each category, 2) each geographic region and the relevant interactions with FPG, and 3) each ethnicity and the relevant interactions with FPG. Similar models for each geographic region and ethnicity were generated for those participants not on an OAD. The following approach was used to determine whether the FPG-A1C relationship was significantly affected by use versus nonuse of an OAD, ethnicity, and/ or geographic region. First, the interaction terms for each model were tested for statistical significance. As each FPG-A1C relationship was described by three models, the cut point for significance was set at P = 0.017 (i.e., one-third of 0.05). If the interaction term in any of the three models described a relationship that was significant at P , 0.017, it was inferred that the FPG-A1C relationship was significantly affected by the subgroup being tested and that different estimates of the FPG-A1C relationship are appropriate for persons in that subgroup versus those not in that subgroup. When that occurred, the difference in the estimated A1C in persons in and not in that subgroup was estimated from the respective spline curves and plotted. RESULTSdParticipants’ mean (SD) age was 63.6 (7.8) years. As noted in Table 1, 8,146 (65%) were men, 7,390 (59%) were on an OAD (comprising 27% on metformin and 30% on a sulfonylurea), 6,067 (48%) were from Europe, and 7,395 (59%) were white. The mean BMI was 29.8 (5.2) kg/m2; the mean FPG in people not on an OAD and on an OAD was 6.9 (1.6) and 7.6 (2.2) mmol/L, respectively (P , 0.0001); and the mean A1C in these two groups was 6.3% (45 mmol/mol) (0.9) and 6.7% (50 mmol/ mol) (0.9), respectively (P , 0.0001). Inspection of the spline curves illustrating the relationship between FPG and A1C for the entire group (Fig. 1A) showed care.diabetesjournals.org
Table 2dRelationship between FPG and A1C calculated using linear regression model for each segment of FPG for each subgroup
Dependent
Parameter
SE
b coefficient
95% CI
P
,5.6 (n = 1,780)
A1C
Intercept FPG OAD FPG 3 OAD
0.317 0.062 0.399 0.079
5.227 0.104 1.091 20.143
4.605–5.849 20.017 to 0.226 0.309–1.874 20.297 to 0.011
,0.0001 0.093 0.006 0.068
5.6–9.0 (n = 8,759)
A1C
0.105 0.015 0.137 0.019
.9.0 (n = 1,917)
Intercept FPG OAD FPG 3 OAD
3.257 0.430 1.476 20.176
3.051–3.463 0.401–0.460 1.208–1.744 20.214 to 20.137
,0.0001 ,0.0001 ,0.0001 ,0.0001
A1C
Intercept FPG OAD FPG 3 OAD
0.361 0.035 0.409 0.039
5.336 0.211 0.913 20.114
4.629–6.044 ,0.0001 0.143–0.278 ,0.0001 0.111–1.714 0.026 20.190 to 20.037 0.004
FPG (mmol/L)
that the shape of the relationship is consistent with the two knots of 5.6 and 9.0 mmol/L identified by the statistics program. It also suggested that the relationship differed depending on whether the participant was taking an OAD (Fig. 1B) or was not taking an OAD (Fig. 1C). This possibility was tested by inspecting the interaction terms for the three linear regression models that described each of the three segments of the FPG-A1C relationship (FPG ,5.6, 5.6–9.0, and .9 mmol/L) in all participants (Table 2). Indeed, as the interaction term was significant (at P , 0.017) for two of these models (P ,
0.0001 and P = 0.004 for FPG 5.6–9 and .9 mmol/L, respectively), OAD use was clearly a significant determinant of the FPG-A1C relationship in this population (due to the differences in the relationship for FPG levels $5.6 mmol/L). At FPG levels of 5.6–9.0 mmol/L and without OAD use, for every 1.0 mmol/L higher FPG, A1C increased by an average of 0.43%. (b coefficient 0.430 [95% CI 0.402–0.458], P , 0.0001). With OAD use, the corresponding average increase in A1C was 0.26% (0.255 [0.230– 0.280], P , 0.0001). At FPG levels of .9.0 mmol/L without OAD use, the
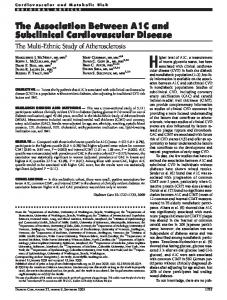
Figure 2dThe difference in estimated A1C (%) between the groups on an OAD versus the group not on an OAD at FPG values $5.6 mmol/L. Differences were derived from the respective spline curves. DIABETES CARE
3
FPG-A1C relationship average increment in A1C was 0.21% (0.211 [0.135–0.286], P , 0.0001), and with OAD use, the average increment was 0.10% for every millimole per liter rise in FPG (0.097 [0.063–0.132], P , 0.0001). The impact of this interaction for FPG levels .5.6 mmol/L is illustrated in Fig. 2, which shows that the difference in the estimated A1C levels for people on an OAD versus not on an OAD was greatest for FPG levels .9 and ,8 mmol/L. This can be appreciated by noting that the predicted FPG for participants with an A1C of 6.5% (48 mmol/mol) would be 6.95 mmol/L (95% CI 4.0–12.0) with OAD use and 7.5 mmol/L (6.6–8.6) without OAD use. In all subsequent analyses, performed separately for people on and not on an OAD, no significant interactions were seen with respect to type of OAD used (in people on an OAD [Fig. 1D–F]), geographic location (Fig. 3), or ethnicity (Supplementary Data Fig. 4).
CONCLUSIONSdThese analyses of cross-sectional data from .12,500 people with impaired fasting glucose, impaired glucose tolerance, or early diabetes who volunteered for the international ORIGIN trial demonstrate a clear graded relationship between FPG $5.6 mmol/L and A1C levels. They also show that the nature of the relationship differs depending on whether an individual is taking an OAD but is unaffected by either ethnic origin or geographical location. Scrutiny of the FPG-A1C relationship suggests several insights from these observations. Both inspection and statistical analysis of the curve for FPG versus A1C levels in the whole population (Fig. 1A) revealed a complex relationship, with a steeper, relatively linear part of the curve between FPG 5.6 and 9.0 mmol/L. At levels ,5.6 mmol/L, no statistically significant relationships between FPG and A1C were found. At levels .9.0 mmol/L, the slope of the curve was less steep, demonstrating a lesser increase
of A1C with higher FPG levels. While speculative, potential explanations for alteration of the relationship between FPG and A1C when FPG is .9.0 mmol/L can be proposed. One may be blunting of postprandial peaks by glycosuria when they are above the renal “threshold” for reabsorption, which is typically $9 mmol/L (14). Also, erythrocyte survival may be shortened during marked hyperglycemia (15,16). The relationship between FPG and A1C is particularly relevant for FPG levels between 5.6 and 9.0 mmol/L, as patients with diabetes typically have FPG in this range. For persons not taking any OAD, the slope of the relationship indicated a 0.43% higher A1C for each 1 mmol/L of FPG concentration. For individuals taking an OAD, this relationship was significantly blunted, with a 0.25% higher A1C for every 1 mmol/L higher FPG within this range. The linear relationship between FPG and A1C in both these subgroups (albeit
Figure 3dSpline curves with 95% CIs of the relationship between FPG and A1C are shown for persons from different geographical regions not on an OAD (A) and on an OAD (B). (A high-quality color representation of this figure is available in the online issue.) 4
DIABETES CARE
care.diabetesjournals.org
Ramachandran and Associates with different slopes) and the fact that the A1C measurement is known to reflect both fasting and nonfasting hyperglycemia suggest that fasting and nonfasting glucose levels generally change in parallel within this range. Why the FPG-A1C relationship was altered when OADs were used is unknown. One possible explanation is that both metformin and sulfonylureas (the most commonly used OADs) lower FPG more than nonfasting glucose levels (17–19). Another is that drug-naïve individuals are less inclined to attempt lifestyle interventions or less likely to be checking their glucose levels because they either do not have a diagnosis of diabetes or are not taking a drug that can affect glycemic patterns. Whatever the mechanisms for the effect of OAD therapy, both clinical management and interpretation of epidemiologic data may be illuminated by this alteration of the FPGA1C relationship. In contrast, the absence of differences in the FPG-A1C relationship across different populations suggests that FPG levels are much more strongly related to A1C levels than to any variables associated with either geography or ethnicity, whether genetic or behavioral in origin. The strength of the study was the large number of subjects available for the overall and subgroup analyses. The numbers were high for subgroup analysis in relation to the use of OAD. The large sample size with a wide range of A1C and FPG levels facilitated analysis of data at clinically relevant A1C levels. Important limitations include the fact that participants were all volunteers and were all deemed to be at high risk for cardiovascular disease. Whether similar relationships would be apparent in individuals from the general population at lower risk for cardiovascular disease is unknown, although there is no compelling reason to believe that they would be different. These observations are also limited by the fact that glucose and A1C values were locally measured using a variety of assays worldwide and that a mathematical approach was used to adjust for differences in each laboratory’s normal range for A1C. Thus, laboratory-related variability may have influenced the results. Also, information on the presence of variant hemoglobins or other physiologic factors that might affect A1C values was not available, and whether such factors may have altered the FPG-A1C relationships observed is unknown. However, the fact that clear FPG-A1C relationships were observed despite these potential sources of variability strengthens the conclusions and suggests that a stronger relationship would be care.diabetesjournals.org
apparent if the measurements were all made in the same laboratory. In summary, our cross-sectional analyses in a large population of persons with dysglycemia or early T2DM confirm a strong relationship between FPG in the range of 5.6–9.0 mmol/L and concurrent A1C measurements across different geographic regions and ethnic groups. They also show a clear effect of oral therapies on this relationship, with a smaller increase in A1C per unit increase in FPG for persons taking an OAD. These data highlight the relevance and appropriateness of the A1C test as a useful measure of glycemic status throughout the world and also suggest that OAD use or nonuse should be considered when interpreting A1C level.
8.
9.
10.
11. AcknowledgmentsdThe ORIGIN trial is funded by sanofi-aventis. No other potential conflicts of interest relevant to this article were reported. A.R. and M.C.R. contributed to, researched, analyzed, discussed, and prepared the manuscript. C.K. contributed to, researched, analyzed, and performed the statistical analyses. H.C.G. contributed to, researched, analyzed, discussed, and prepared the manuscript. A.R. and H.C.G. are the guarantors of this work and, as such, had full access to all the data in the study and take responsibility for the integrity of the data and the accuracy of the data analysis. A.R. acknowledges the help provided by Dr. C. Snehalatha, Director, Research in India Diabetes Research Foundation, in the preparation of the manuscript.
References 1. American Diabetes Association. Standards of medical care in diabetesd2010. Diabetes Care 2010;33(Suppl. 1):S11–S61 2. The Diabetes Control and Complications Trial Research Group. The effect of intensive treatment of diabetes on the development and progression of long-term complications in insulin-dependent diabetes mellitus. N Engl J Med 1993;329:977–986 3. UK Prospective Diabetes Study (UKPDS) Group. Intensive blood-glucose control with sulphonylureas or insulin compared with conventional treatment and risk of complications in patients with type 2 diabetes (UKPDS 33). Lancet 1998;352:837–853 4. Kilpatric ES, Bloomgarden ZT, Zimmet PZ. Is haemoglobin A1c a step forward for diagnosing diabetes? BMJ 2009;339:1288–1290 5. Sacks DB. A1C versus glucose testing: a comparison. Diabetes Care 2011;34:518–523 6. International Expert Committee. International Expert Committee report on the role of the A1C assay in the diagnosis of diabetes. Diabetes Care 2009;32:1327–1334 7. Monnier L, Lapinski H, Colette C. Contributions of fasting and postprandial plasma
12.
13.
14.
15.
16.
17.
18.
19.
glucose increments to the overall diurnal hyperglycemia of type 2 diabetic patients: variations with increasing levels of HbA (1c). Diabetes Care 2003;26:881–885 Nathan DM, Singer DE, Hurxthal K, Goodson JD. The clinical information value of the glycosylated hemoglobin assay. N Engl J Med 1984;310:341–346 Herman WH, Dungan KM, Wolffenbuttel BH, et al. Racial and ethnic differences in mean plasma glucose, hemoglobin A1c, and 1,5-anhydroglucitol in over 2000 patients with type 2 diabetes. J Clin Endocrinol Metab 2009;94:1689–1694 Selvin E, Steffes MW, Ballantyne CM, Hoogeveen RC, Coresh J, Brancati FL. Racial differences in glycemic markers: a cross-sectional analysis of communitybased data. Ann Intern Med 2011;154: 303–309 Cohen RM. A1C: does one size fit all? Diabetes Care 2007;30:2756–2758 Kirk JK, D’Agostino RB Jr, Bell RA, et al. Disparities in HbA1c levels between African-American and non-Hispanic white adults with diabetes: a meta-analysis. Diabetes Care 2006;29:2130–2136 Gerstein H, Yusuf S, Riddle MC, Ryden L, Bosch J; Origin Trial Investigators. Rationale, design, and baseline characteristics for a large international trial of cardiovascular disease prevention in people with dysglycemia: the ORIGIN Trial (Outcome Reduction with an Initial Glargine Intervention). Am Heart J 2008;155:26–32, 32, e1–e6 Wolf S, Rave K, Heinemann L, Roggen K. Renal glucose excretion and tubular reabsorption rate related to blood glucose in subjects with type 2 diabetes with a critical reappraisal of the “renal glucose threshold” model. Horm Metab Res 2009;41:600–604 Cohen RM, Franco RS, Khera PK, et al. Red cell life span heterogeneity in hematologically normal people is sufficient to alter HbA1c. Blood 2008;112:4284–4291 Virtue MA, Furne JK, Nuttall FQ, Levitt MD. Relationship between GHb concentration and erythrocyte survival determined from breath carbon monoxide concentration. Diabetes Care 2004;27:931–935 Mori Y. [Exploring an optimal approach to the use of oral hypoglycemic agents based on CGM results: implications for combination therapy with oral hypoglycemic agents]. Nihon Rinsho 2011;69: 1505–1514 [in Japanese] Shapiro ET, Van Cauter E, Tillil H, et al. Glyburide enhances the responsiveness of the beta-cell to glucose but does not correct the abnormal patterns of insulin secretion in noninsulin-dependent diabetes mellitus. J Clin Endocrinol Metab 1989;69:571–576 Jeppesen J, Zhou M-Y, Chen Y-DI, Reaven GM. Effect of metformin on postprandial lipemia in patients with fairly to poorly controlled NIDDM. Diabetes Care 1994; 17:1093–1099 DIABETES CARE
5