Epidemiology/Health Services/Psychosocial Research O R I G I N A L
A R T I C L E
Relationship Between Gestational Diabetes Mellitus and Low Maternal Birth Weight GIUSEPPE SEGHIERI, MD1 ROBERTO ANICHINI, MD1 ALESSANDRA DE BELLIS, MD1
LORENZO ALVIGGI, MD1 FLAVIA FRANCONI, MD2 MARIA CRISTINA BRESCHI, MD1
OBJECTIVE — To study the relationship between low birth weight and the presence of gestational diabetes mellitus (GDM) or peripheral insulin resistance during pregnancy. RESEARCH DESIGN AND METHODS — We studied the relationship between peripheral insulin sensitivity (calculated by Matsuda and DeFronzo’s oral glucose tolerance test (OGTT)-derived insulin sensitivity index [ISIOGTT]) or GDM prevalence and birth weight in 604 pregnant women, classified as normally glucose tolerant (n ⫽ 462) or affected with GDM (n ⫽ 142) after a 100-g 3-h oral glucose tolerance test. We then categorized these subjects into two groups: individuals with birth weight in the ⬍10th percentile (⬍2,600 g; n ⫽ 68) and individuals with birth weight in the ⬎10th percentile (n ⫽ 536). RESULTS — GDM prevalence was higher in the group in the lowest birth weight decile (⬍2,600 g; 24/68; 35%) than in the group with normal/high birth weight (118/536; 22%; 2 ⫽ 5.917; P ⫽ 0.01). Relative risk for GDM adjusted for age, parity, family history of diabetes, and prepregnancy body weight was about twofold in the group with low birth weight (odds ratio ⫽ 1.89 [95% CI 1.088 –3.285; P ⫽ 0.023]), and the prevalence of low birth weight was about threefold higher in the first ISIOGTT decile. In 450 women whose newborn’s weight was known, the delivery of macrosomic babies was associated with a twofold higher relative risk for GDM in women who themselves had low birth weight. In the latter, the relationships between their newborn’s weight and either maternal glucose tolerance (positive) or ISIOGTT (negative) were amplified. CONCLUSIONS — Low maternal birth weight was associated with a twofold higher risk for GDM, independent of major confounders. Such a risk was highest in women with low birth weight who delivered macrosomic babies, and in the group with low birth weight, the relationship between maternal glucose tolerance or insulin resistance and offspring’s neonatal weight was much more evident. Diabetes Care 25:1761–1765, 2002
A
ccording to the hypothesis of the thrifty phenotype, low neonatal weight is related to a higher peripheral insulin resistance as well as to the appearance, during adult life, of the clinical correlates of the insulin resistance syndrome, including type 2 diabetes (1– 3). Low birth weight would thus mirror a
retardation of the intrauterine programming process that leads to reduced organ maturation (4,5). Pregnancy is characterized by a physiological state of insulin resistance, which is further magnified in women affected by gestational diabetes mellitus (GDM) (6,7). Furthermore, pregnant women
● ● ● ● ● ● ● ● ● ● ● ● ● ● ● ● ● ● ● ● ● ● ● ● ● ● ● ● ● ● ● ● ● ● ● ● ● ● ● ● ● ● ● ● ● ● ● ● ●
From the 1Department of Internal Medicine, Spedali Riuniti, Pistoia, Italy; and the 2Department of Pharmacology, University of Sassari, Sassari, Italy. Address correspondence and reprint requests to Giuseppe Seghieri, MD, Via Monte Sabotino 96/A, 51100 Pistoia, Italy. E-mail:
[email protected]. Received for publication 14 January 2002 and accepted in revised form 24 June 2002. Abbreviations: GDM, gestational diabetes mellitus; OGTT, oral glucose tolerance test; OR, odd ratio. A table elsewhere in this issue shows conventional and Syste`me International (SI) units and conversion factors for many substances.
DIABETES CARE, VOLUME 25, NUMBER 10, OCTOBER 2002
with GDM have many features of the metabolic syndrome (8) and have a high risk of developing type 2 diabetes (9). Maternal insulin sensitivity is inversely related to offspring’s neonatal weight (10,11), and a small maternal birth weight could therefore hypothetically modify the risk of giving birth to macrosomic babies. It is still unknown whether insulin resistance and a woman’s own birth weight are linked during pregnancy, and there are conflicting results regarding the relationship between GDM and maternal birth weight (12,13). We therefore designed our study to evaluate whether there is a relationship between maternal birth weight and peripheral insulin resistance or the presence of GDM in a group of pregnant women. A second purpose of this study was to verify whether low maternal birth weight modifies the relationship between insulin resistance or GDM and the neonatal offspring’s weight. RESEARCH DESIGN AND METHODS — This study included 604 pregnant women who, during the last 2 years, consecutively performed a 100-g 3-h oral glucose tolerance test (OGTT) between the 24th and 28th gestational week. The test was performed at the Outpatients Clinic of the Diabetes Unit of the Hospital of Pistoia, Italy, according to a standardized program of the Regional Health Service, in essential agreement with the recommendations of the American Diabetes Association (14). According to this protocol, a full 100-g 3-h OGTT should be performed in all women who are classified as glucose intolerant to a previous 1-h 50-g OGTT, who show a 1-h plasma glucose level ⬎7.8 mmol/l, or who have other risk factors for GDM (history of glucose intolerance, of macrosomic deliveries during previous pregnancies, or of diabetes in first-degree relatives). We chose this “high-risk” population because it represents a sample of women who are the common target of screening, and therefore we can expect a higher ratio of GDM cases per screened 1761
Maternal birth weight and gestational diabetes birth weights in the ⬍10th percentile (⬍2,600 g; n ⫽ 68) and individuals with birth weights in the ⬎10th percentile (n ⫽ 536). The study was approved by the ethical committee of our hospital.
Table 1—Main characteristics of women with GDM and normal glucose tolerance
n Age (years) Prepregnancy BMI (kg/m2) Actual BMI (kg/m2) Family history of diabetes (%) Systolic blood pressure (mmHg) Diastolic blood pressure (mmHg) Parity (n) 2-h glucose area under the curve (mol 䡠 l⫺1 䡠 2 h⫺1) 2-h insulin area under the curve (nmol 䡠 l⫺1 䡠 2 h⫺1) ISIOGTT (mg 䡠 dl⫺1 䡠 min⫺1) Maternal birth weight (g)
Normal glucose tolerance
GDM
P
462 31.3 ⫾ 4 23.1 ⫾ 4.3 25.9 ⫾ 4 32.1 114.7 ⫾ 9.5 71.3 ⫾ 7.5 1.8 ⫾ 1 0.8 ⫾ 0.1
142 32.9 ⫾ 4.4 23.8 ⫾ 3.8 26.6 ⫾ 3.9 42.2 115.4 ⫾ 8 72.2 ⫾ 8.1 1.8 ⫾ 1 1.1 ⫾ 0.1
— 0.0001 NS NS 0.01 NS NS NS 0.0001
58.7 ⫾ 30.8
67.9 ⫾ 40.7
5.7 ⫾ 3.7 3,282 ⫾ 555
3.9 ⫾ 2 3,221 ⫾ 555
0.005 0.0001 NS
Data are means ⫾ SD.
individuals. The 1-h 50-g OGTT was performed in 470 cases and was positive in 427 cases. GDM was diagnosed by a full 100-g 3-h OGTT in 112 women whose 1-h 50-g OGTT was ⬎7.8 mmol/l (23.8%), in 2 of 43 with a negative test, and in 28 of 134 without a previous 1-h 50-g test (19.7%). In all these cases, the women were treated with diet only. In 154 cases, women or their mothers remembered their birth weight. Birth weight was known by means of written record in 450 women, but, nevertheless, these records were largely incomplete as to gestational age of pregnancies. Age, birth weight, parity, and prepregnancy BMI were, on average, similar in these two groups, and in this young population (⬍40 years of age), the birth weights ascertained through family’s memories and through legal or medical documents should be in agreement because, as previously described, in this case, the younger the population, the more birth weights correspond to reality (15). Plasma glucose (Glucose GOD-PAP; Roche Diagnostic, Mannheim, Germany) and insulin (Immunometric Assay; DPC, Los Angeles, CA) were measured at baseline and at 60, 120, and 180 min after 100-g glucose oral load in all women. The areas under time multiplied by concentration curves of glucose and insulin were computed by trapezoidal integration and expressed as moles per liter per 2 h and as nanomoles per liter per 2 h, respectively. Peripheral insulin sensitivity was graded by using the insulin sensitivity index of 1762
Matsuda and DeFronzo (16) as follows: ISIOGTT ⫽ 10,000/square root [fasting plasma glucose (mg/dl) ⫻ fasting plasma insulin (mU/l)] ⫻ (mean glucose value during the OGTT ⫻ mean basal insulin value during the OGTT). This index was recently validated in pregnant women with or without GDM (17). Blood pressure was measured before the test in the supine position and was expressed as the mean value of three consecutive measurements. GDM was diagnosed in a total of 142 women using the criteria suggested by the American Diabetes Association (14). The women were further categorized into two groups: individuals with
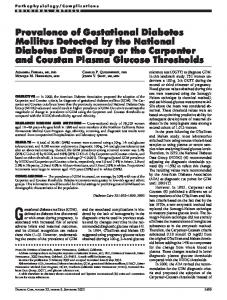
Statistical analysis Data are expressed as means ⫾ SD. Differences between means were tested by two-tailed Student’s t test. Comparisons between slopes of regression lines were calculated by ANOVA (18). Differences between frequencies were evaluated by the 2 method. Logistic analysis regression was used to estimate odds ratio (OR) associated with risk of GDM after adjusting for main confounders. Significance level was set at P ⬍ 0.05. All data were analyzed by a SAS statistical package for personal computers (19). RESULTS — As shown in Table 1, diabetic women were older and were characterized by higher 2-h areas under the curve for glucose and insulin, as well as by a reduced mean value of ISIOGTT. When the women were stratified according to their birth weight, all studied parameters did not present significant differences (Table 2). Nevertheless, although the pregnant women’s birth weight was, on average, not different in the group with GDM (Table 1), the prevalence of GDM was significantly higher (24/68; 35%) in the group in the first birth weight decile (⬍2,600 g) compared with the prevalence in the other deciles (118/536; 22%; 2 ⫽ 5.917; P ⫽ 0.01, as shown in Fig. 1).
Table 2—Main characteristics of pregnant women stratified by birth weight
n Age (years) Prepregnancy BMI (kg/m2) Actual BMI (kg/m2) Family history of diabetes (%) Systolic blood pressure (mmHg) Diastolic blood pressure (mmHg) Parity (n) 2-h glucose area under the curve (mol 䡠 l⫺1 䡠 2 h⫺1) 2-h insulin area under the curve (nmol 䡠 l⫺1 䡠 2 h⫺1) ISIOGTT (mg 䡠 dl⫺1 䡠 min⫺1) Maternal birth weight (g)
Birth weight ⱖ2,600 g
Birth weight ⬍2,600 g
P
536 31.6 ⫾ 4.1 23.3 ⫾ 4.2 26.1 ⫾ 4 35.3 114.9 ⫾ 9.2 71.5 ⫾ 7.5 1.8 ⫾ 1 0.9 ⫾ 0.1
68 32.1 ⫾ 4.7 22.8 ⫾ 4.7 25.6 ⫾ 3.5 36.9 114.8 ⫾ 8.9 71.8 ⫾ 7.9 1.8 ⫾ 1 0.9 ⫾ 0.1
— NS NS NS NS NS NS NS NS
60.1 ⫾ 33.9
64.7 ⫾ 29.8
5.3 ⫾ 3.3 3,390 ⫾ 449
5.1 ⫾ 4.7 2,305 ⫾ 320
NS NS 0.0001
Data are means ⫾ SD.
DIABETES CARE, VOLUME 25, NUMBER 10, OCTOBER 2002
Seghieri and Associates
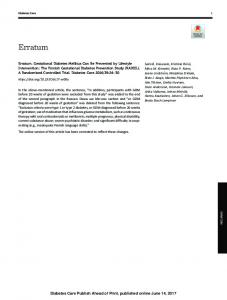
Figure 1—Prevalence of GDM in women stratified by deciles of their birth weight.
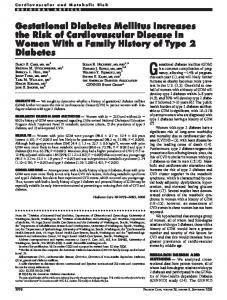
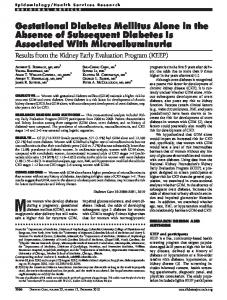
After adjusting for age, parity, family history of diabetes, and prepregnancy BMI, the relative risk of having GDM was about twofold in women with birth weights ⬍2,600 g (OR: 1.89; 95% CI 1.088 – 3.285; P ⫽ 0.023). In the subgroup of 450 women whose delivery records were precisely known, the maternal birth weights were evaluated across tertiles of their newborn’s weight adjusted for sex and gestational age. This analysis shows that, within each tertile, the prevalence of GDM was higher in the group of mothers with a small birth weight. The highest prevalence of GDM (43%) was, however, observed in individuals with a small birth weight who deliv-
ered the heaviest babies (in the upper tertile) (Fig. 2). The OR of being affected with GDM in mothers whose birth weight was ⬍2,600 g, compared with individuals with a birth weight ⱖ2,600 g, was 1.38 (95% CI 0.65–2.95, NS) in the first tertile of offspring’s neonatal weight; 2.40 (95% CI 1–5.77; NS) in the second tertile; and 2.27 (95% CI 1.12– 4.55; P ⫽ 0.03) in the third tertile. Maternal birth weight was unrelated to age, glucose/insulin 2-h areas under the curve, ISIOGTT, and blood pressure and was directly related to both actual and prepregnancy BMI (r ⫽ 0.11, P ⫽ 0.005 and r ⫽ 0.12, P ⫽ 0.005, respectively) and to offspring’s neonatal weight (r ⫽ 0.12, P ⫽ 0.007), although
Figure 2—Prevalence of GDM in pregnant women stratified by their birth weight as well as by their offspring’s birth weight.
DIABETES CARE, VOLUME 25, NUMBER 10, OCTOBER 2002
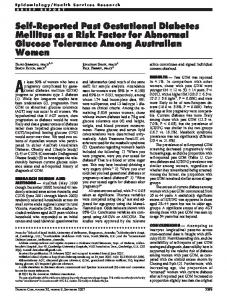
these relationships appear very weak and explain a negligible percentage of these variables’ variance. The percentage of women with low birth weight was about threefold higher in the first ISIOGTT decile than in the upper ISIOGTT decile (14 vs. 5%; P ⫽ 0.04). Finally, the relationship between worsening of glucose tolerance and offspring’s neonatal weight was amplified in mothers with low birth weight, as shown by the significantly steeper slope of the regression line joining the 2-h area under the curve for glucose with the offspring’s neonatal weight adjusted for sex and gestational age in women with birth weights ⬍2,600 g {neonatal weight ⫽ 0.7139 ⫹ 0.2897 ⫻ 2-h glucose area under curve [R2 ⫽ 0.104, P ⫽ 0.03, for women with small birth weight (n ⫽ 48)], and neonatal weight ⫽ 0.9222 ⫹ 0.0890 ⫻ 2-h glucose area under curve [R2 ⫽ 0.012, P ⫽ 0.03, for women with birth weights ⱖ2,600 g (n ⫽ 402)]} (P ⫽ 0.006 by ANOVA for difference in slopes; Fig. 3). Likewise, offspring’s relative neonatal weight was inversely related to ISIOGTT (r ⫽ ⫺0.13, P ⫽ 0.009), and this result was significantly more marked in the group with a low birth weight [neonatal weight ⫽ 1.0185 ⫺ 0.0068 ⫻ ISIOGTT (R2 ⫽ 0.078, P ⫽ 0.04 for women with low birth weight), and neonatal weight ⫽ 1.0251 ⫺ 0.00383 ⫻ ISIOGTT (R2 ⫽ 0.012, P ⫽ 0.03 for women with birth weights ⱖ2,600 g)] (the slopes being significantly different, P ⫽ 0.009 by ANOVA; Fig. 3). CONCLUSIONS — Our data suggest that, although the association between insulin resistance and pregnant women’s birth weight is nonlinear, the risk of GDM is about twofold in pregnant women who themselves had low birth weight. ISIOGTT was, as expected, reduced in women with GDM, and, moreover, no linear relationship was observed between maternal birth weight and insulin resistance. Despite a similarity in the means of women’s birth weight between groups with normal glucose tolerance and GDM, there was a significant increase in the prevalence of GDM, according to a “threshold effect” in women with birth weights in the lowest decile. This latter observation can explain the absence of significant variations in mean glucose/ insulin areas under the curve and ISIOGTT observed in the group of women with low 1763
Maternal birth weight and gestational diabetes
Figure 3—Regression lines relating glucose tolerance (A) and ISIOGTT (B) to offspring’s neonatal weight in mothers with birth weight ⱖ2,600 or ⬍2,600 g. *Relative offspring’s neonatal weight adjusted for sex and gestational age.
birth weight due to a dilution effect on the mean exerted by the large majority of nondiabetic subjects (about two-thirds). These results are in agreement with the data of Moses et al. (13), who did not find any linear relation between grade of glucose tolerance and birth weight in a group of pregnant women. Nevertheless, the different design of this latter study does not allow us to reach any conclusion on the hypothesis that birth weight categorization may be linked to GDM by a threshold effect. Our study has, in fact, some features that do not allow any true comparison with the data of Moses et al.: first, ours is not a population-based study because it involves a selected high-risk population. Second, the women’s birth weight in our database is not adjusted by gestational weight, and, third, diagnosis criteria for GDM are different. Although we studied a high-risk population, we did not observe a U-shaped distribution curve of GDM prevalence across deciles of pregnant women’s birth weight, which is a characteristic of populations at high risk for diabetes such as, for instance, Pima Indians (20). A further difference is represented by the fact that mean body weight of the women studied either with or without diabetes was, on average, much leaner than that of the Pima Indians. This is a further demonstration that genetic factors, differences in perinatal life expectancy, or perhaps some other unknown factors may play a major role in determining the distribution shape of risk for diabetes and of GDM in adult Caucasian women with larger neonatal weights. Nevertheless, our data are in full agreement with the findings of a Norwegian population study including 138,714 women that reports a very similar OR (1.8; 95% CI 1.1–3) of having diabetes during pregnancy in women whose birth weight was ⬍2,500 g (12). Besides this 1764
similarity, whether our study can be extrapolated to the whole population remains doubtful. Moreover, it is noteworthy that, according to the Norwegian study, adjusting for gestational age does not provide any additional predictive information on GDM risk. A further aspect of our study is the relationship linking maternal birth weight with the offspring’s neonatal weight. We confirm a previous observation that these two weights are linearly related (21), although this relationship appears very weak and explains a negligible 1% of offspring’s weight variance. Our findings suggest that women with low birth weight who give birth to larger babies are at the highest risk for GDM. In other words, our results lead to the conclusion that maternal diabetes is more related to offspring macrosomia in women with low birth weight. This is also disclosed by the magnifying effect exerted by the mother’s low birth weight on the direct relationship that links either maternal glucose tolerance (directly) or insulin sensitivity (inversely) to offspring fetal growth. All this suggests that a low birth weight, considered a proxy for low fetal growth rate in utero, may be acting as an amplifier of risk (in this case, fetal macrosomia associated with GDM) rather than a risk factor per se. The concept that reduced maturation in utero may act as a risk amplifier during adult life is, moreover, suggested by the findings of a previous study describing a stronger relationship between obesity and blood pressure in females whose mothers were exposed to poor nutrition during pregnancy (22). In conclusion, low maternal birth weight seems to be associated with a twofold higher risk for GDM, independent of major confounders. Such a risk is highest in women with small birth weight who
deliver macrosomic babies, and a small birth weight acts as an “amplifier” of the relationship between maternal glucose tolerance or insulin resistance and the newborn’s weight. Our study suggests that knowledge of a woman’s birth weight during the pregnancy may be useful from an epidemiological point of view, first, to assess the global risk of being affected with GDM and, second, to better predict a higher risk of giving birth to larger (macrosomic) babies in diabetic pregnant women. Acknowledgments — We acknowledge the contribution of Mary Forrest in editing the revised text of the manuscript. This study was presented as a communication at the 37th Annual Meeting of the European Association for the Study of Diabetes and was published in abstract form in Diabetologia 44 (Suppl. 1):A13, 2001.
References 1. Clausen JO, Borch-Johnsen K, Ibsen H, Pedersen O: Relation between birth weight and the insulin sensitivity index in a population sample of 331 young healthy Caucasians. Am J Epidemiol 146:23–31, 1997 2. Barker DJ, Hales CN, Fall CH, Osmond C, Phipps K, Clark PM: Type 2 (non-insulin dependent) diabetes mellitus, hypertension and hyperlipidaemia (syndrome X): relation to reduced fetal growth. Diabetologia 36:62– 67, 1993 3. Rich-Edwards JW, Colditz GA, Stampfer MJ, Willett WC, Gillman MW, Hennekens CH, Speizer FE, Manson JAE: Birthweight and risk for type 2 diabetes mellitus in adult women. Ann Intern Med 130:278 –284, 1999 4. Barker DJP: The fetal origins of disease. Eur J Clin Invest 25:457– 463, 1995 5. Godfrey KM, Barker DJP: Fetal malnutrition and adult disease. Am J Clin Nutr 71: 1344S–1352S, 2000 6. Catalano PM, Tyzbir ED, Roman NM, Amini SB, Sims EAH: Longitudinal changes in insulin release and insulin resistance in nonobese pregnant women. Am J Obstet Gynecol 165:1667–1672, 1991 7. Catalano PM, Tyzbir ED, Wolfe RR, Calles J, Roman NN, Amini SB, Sims EA: Carbohydrate metabolism during pregnancy in control subjects and women with gestational diabetes. Am J Physiol 264:E60 – E67, 1993 8. Clark CM, Qui C, Amerman B, Porter B, Fineberg N, Aldasouqi S, Golichowski A: Gestational diabetes: should it be added
DIABETES CARE, VOLUME 25, NUMBER 10, OCTOBER 2002
Seghieri and Associates
9.
10.
11.
12.
13.
to the syndrome of insulin resistance? Diabetes Care 20:867– 871, 1997 Henry OA, Beischer NA: Long-term implications of gestational diabetes for the mother. In Bailliere’s Clinical Obstetrics and Gynaecology. Oats JN, Ed. London, Bailliere Tindall, 1991, p. 461– 483 Catalano PM, Drago NM, Amini SB: Maternal carbohydrate metabolism and its relationship to fetal growth and body composition. Am J Obstet Gynecol 172: 1464 –1470, 1995 Breschi MC, Seghieri G, Bartolomei G, Gironi A, Baldi S, Ferrannini E: Relation of birthweight to maternal plasma glucose and insulin concentrations during normal pregnancy. Diabetologia 36:1315–1321, 1993 Egeland GM, Skjaerven R, Irgens LM: Birth characteristics of women who develop gestational diabetes: population based study. BMJ 321:546 –547, 2000 Moses RG, Moses J, Knights S: Birth
14.
15.
16.
17.
18.
DIABETES CARE, VOLUME 25, NUMBER 10, OCTOBER 2002
weight of women with gestational diabetes. Diabetes Care 22:1059 –1062, 1999 American Diabetes Association: Gestational diabetes mellitus (Position Statement). Diabetes Care 22 (Suppl. 1):S74 – S76, 1999 Andersson SW, Niklasson A, Lapidus L, Hallberg L, Bengtsson C, Hulthen L: Poor agreement between self-reported birth weight and birth weight from original records in adult women. Am J Epidemiol 152:609 – 616, 2000 Matsuda M, DeFronzo RA: Insulin sensitivity indices obtained from oral glucose tolerance testing: comparison with the euglycemic insulin clamp. Diabetes Care 22: 1462–1470, 1999 Kirwan JP, Huston-Presley H, Kalhan SC, Catalano PM: Clinically useful estimates of insulin sensitivity during pregnancy. Diabetes Care 24:1602–1607, 2001 Snedecor GW, Cochran WG: Statistical Methods. 7th ed. Ames, IA, Iowa State
University Press, 1980, p. 385–388 19. SAS Institute, Inc.: SAS/STAT User’s Guide, Version 6, 4th Edition, Cary, NC, SAS Institute Inc., 1989 20. McCance DRM, Petitt DJ, Hanson RL, Jacobsson LTH, Knowler WC, Bennett PH: Birth weight and non-insulin dependent diabetes: thrifty genotype, thrifty phenotype, or surviving small baby genotype? BMJ 308:942–945, 1994 21. Godfrey KM, Barker DJP, Robinson S, Osmond C: Mother’s birthweight and diet in pregnancy in relation to the baby’s thinness at birth. Br J Obstet Gynaecol 104: 663– 667, 1997 22. Stanner SA, Bulmer K, Andres C, Lantseva OE, Borodina V, Poteen VV, Yudkin JS: Does malnutrition in utero determine diabetes and coronary heart disease in adulthood? Results from the Leningrad Siege Study, a cross sectional study. BMJ 315:1342–1348, 1997
1765