African Journal of Biotechnology Vol. 8 (2), pp. 133-138, 19 January, 2009 Available online at http://www.academicjournals.org/AJB ISSN 1684–5315 © 2009 Academic Journals
Full Length Research Paper
Relationship between placental thickness and growth parameters in normal Nigerian foetuses Ohagwu, C. C. 1, Abu, P. O. 2, Ezeokeke U.O. and Ugwu, A .C. 4 1
Department of Medical Radiography, College of Medical Sciences, University of Maiduguri, Borno State, Nigeria 2 Department of Obstetrics and Gynaecology, Federal Medical Centre, Makurdi, Benue State, Nigeria. 3 Radiology Department, Federal Medical Centre, Gombe State, Nigeria. 4 Department of Radiography, College of Medicine, Nnamdi Azikiwe University, Awka, Anambra State, Nigeria. Accepted 31 October, 2008
To investigate the relationship between placental thickness and foetal growth parameters in normal singleton Nigerian foetuses. Six hundred and sixty-six pregnant Nigerian women were studied by ultrasound in a cross sectional prospective study at the Federal Medical Centre, Makurdi, Nigeria. The pregnancies were in the second and third trimesters, and were not complicated by either maternal or foetal disease. BPD and AC were measured, and the placental thickness was measured at the insertion of the umbilical cord. A nomogram of placental thickness was formulated while the relationship between placental thickness and, BPD and AC was investigated by Pearson’s correlation analysis. Mathematical relationships between placental thickness and, BPD and AC were derived by regression analysis. Values were expressed as mean ± standard deviation. Statistical tests were two-tailed with p< 0.01 to indicate statistical significance.The maximum mean placental thickness of 45.09 ± 6.37 mm was recorded at 39 week of gestation. There was a fairly linear increase in placental thickness with gestational age. There was significant positive correlation between placental thickness and, BPD and AC in the second and third trimesters with both parameters having identical relationship with placental thickness. Placental thickness has a strong positive correlation with BPD and AC. Subnormal placental thickness for a particular gestational age may be the earliest sign of intrauterine growth retardation. Measurement of placental thickness should therefore be carried out routinely during obstetrics ultrasound scan. Key words: Placental thickness, foetal growth parameters, ultrasound, singleton fetuses, Nigerian women. INTODUCTION At term, the placenta is discoid with a diameter of 15 to 25 cm and is approximately 3 cm thick and weighs about 500 t0 600 g (Sadler, 2004). Placental thickness increases with age of the foetus (Hoddick et al., 1984; Jauniaux et al., 1994; Tongsong and Boonyanurak, 2004; Mital et al., 2002; Anupama et al., 2001). Placenta is a highly vascular foetal organ which maintains the maternal-foetal circulation via its connection by the umbilical cord. Amongst its functions are exchange of metabolic and gaseous product between maternal and foetal blood streams and production of hormones (Sadler, 2004). One of the hormones produced by the placenta is
*Corresponding author. E-mail:
[email protected]. Tel: 234-8058954638.
the growth hormone- like substance somatomammotropin (Sadler, 2004). Foetal growth parameters such as biparietal diameter (BPD) and abdominal circumference (AC) are used in the sonographic estimation of gestational age and weight of the foetus in the second and third trimesters. Femur length has been established as an accurate parameter for estimating gestational age in the second and third trimesters (Ziylan and Murshid, 2003) while foetal weight can be estimated by Sherpard’s method using only BPD and AC with a deviation of 295 g from the actual birth weight (Hebbar, 2003). These growth parameters are adversely affected by insufficient nutrients reaching the foetus through the placenta. In these foetuses the placental is often thin. A placental thickness of less than 2.5 cm is usually associated with intrauterine growth retardation (IUGR) (Kunlmann and Warsof, 1996).
134
Afr. J. Biotechnol.
We think that placental thickness should have a certain relationship with foetal growth parameters especially BPD and AC. The aim of our study was to investigate this relationship in normal singleton Nigerian foetuses. To the best of our knowledge no such studies have been carried out in this aspect of obstetric ultralsonography in our locality. MATERIALS AND METHODS This cross sectional prospective study was conducted in the Department of Radiology and Department of Obstetrics and Gynaecology, Federal Medical Centre, Makurdi Benue State, Nigeria. A total of 666 Nigerian women in the second and third trimesters of pregnancies were selected for the study. All the women were attending antenatal clinic with viable singleton and uncomplicated pregnancies. Patients with pregnancy induced hypertension (PIH), diabetes mellitus, history of previous intrauterine growth retardation (IUGR), hydrops foetalis, congenital malformation, twin gestation, hydroamnois and placental anomalies were excluded from the study. Patients who did not know their last menstrual period (LMP) were also excluded from the study. Sonography was carried out on each patient included in the study using Toshiba SSA 250 Sonolayer ultrasound equipment with a 3.75 MHz curvilinear transducer. The foetus was observed for viability and congenital anatomical defects, and gestational age estimated using various growth parameters. The growth parameters used in estimating gestational age were BPD and FL in the second trimester and BPD, FL and AC in the third trimester. The composite average of the gestational ages estimated by the various growth parameters was taking for each foetus. The placental was localized in a longitudinal section. The placental thickness was then measured near the insertion of the umbilical cord. Statistical analysis Analysis was done on computer using the Microsoft statistical package, SPSS 11.0. Descriptive statistic was used to formulate a nomogram of placental thickness. Pearson’s correlation analysis was used to establish the degree of relationship between placental thickness and, BPD and AC. Mathematical relationships between placental thickness and, BPD and AC were derived by regression analysis while the best-fit method was used to plot the linear graphs of relationship between placental thickness and the growth parameters. Values were expressed as mean ± standard deviation. Statistical tests were two-tailed with p < 0.01 to indicate statistical significance.
RESULTS The results of our study showed that there was a fairly linear increase in placental thickness with gestational age as shown in Table 1. The maximum mean placental thickness of 45.09 ± 6. 37 mm was recorded at 39 week of gestation as shown in Table 1. There was a significant positive correlation between placental thickness and, BPD and AC in the second and third trimesters; with both parameters having identical relationship with placental thickness as shown in Table 2.
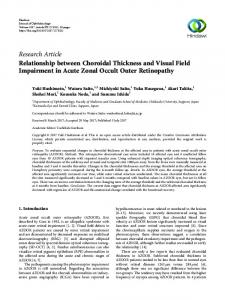
Regression analyses yielded the following linear mathematical relationships between BPD and AC, and placental thickness in the second and third trimesters: y[BPD(mm)] = 1.302 (placental thickness(mm)) ± 15.366 (1) (r = 0.626) in the second trimester. y[AC(mm)] = 5.3435 (placental thickness(mm)) ± 20.226 (2) (r = 0.626) in the second trimester. y[BPD(mm)] = 0.6853 (placental thickness(mm)) ± 56.988 (3) (r = 0.522) in the third trimester. y[AC(mm)] = 3.3854 (placental thickness(mm)) ± 263.49 (4) (r = 0.523) in the third trimester. These equations are shown in the graphs in the Figures 1, 2, 3 and 4. DISCUSSION The placenta is a very vascular foetal organ which main function is to exchange nutrients and metabolic products and gases between the maternal and foetal blood streams. The size of the placenta increases during the foetal growth period to enable it performs its vital functions. As the embryo grows and develops a vascular system, it must establish a much more efficient means of obtaining nutrients and eliminating waste products, and does so by establishing an efficient interface between its vascular system and that of its mother. That interface is the placenta. In addition to its primary goal of facilitating transport between mother and fetus, the placenta is also a major endocrine organ. In almost all mammals the placenta synthesizes and secretes steroid hormones progestins and estrogens. The placenta also produces a number of protein hormones. Depending on the species, it is the source of chorionic gonadotropins, relaxin, and placental lactogens. Placental hormones have profound effects on both fetal and maternal physiology. Despite the fact that all placentae carry out the same basic processes of transport and hormone secretion, there are important differences in structure and function among families of mammals. The placentae of humans, cattle, horses and dogs are all very different from one another at both gross and histologic levels. They also differ in certain functions that are clinically important - for example, in the ability to transport maternal immunoglobulins to the fetus (http://www.vivo.colostate.edu/hbooks/pathphys/reprod/pl acenta). The result of our study showed that placental thickness increased with gestational age in a fairly linear manner. This relationship suggests that placental thickness can be
Ohagwu et al.
135
Table 1. Normal values of placental thickness in the second and third trimesters.
EGA(weeks) 14 15 16 17 18 19 20 21 22 23 24 25 26 Third trimester 27 28 29 30 31 32 33 34 35 36 37 38 39 40 41 n = 666
Second trimester No of measurements 10 23 27 15 15 23 17 24 16 20 12 17 25 24 28 28 21 31 48 27 18 37 33 31 33 35 13 15
Table 2. Correlation between placental thickness and the growth parameters; biparietal diameter (BPD) and abdominal circumference (AC).
Pregnancy Second trimester (n = 244) Third trimester (n = 422)
BPD r = 0.626 * p = 0.000 r = 0.522 * p = 0.000
AC r = 0.626 * p = 0.000 r = 0.523 * p = 0.000
* = Significant.
used as an indicator of gestational age. Our study showed a statistically significant positive correlation between placental thickness and, BPD and AC. This means that estimated foetal weight which is calculated based on a formula having BPD and AC as variables (Shepard et al., 1987) is dependent on placental thickness.
Placental thickness(mm) 18.33 + 1.15 18.65 + 3.68 21.96 + 2.86 21.20 + 3.43 23.67 + 2.61 23.65 + 4.30 25.41 + 4.26 27.17 + 4.88 28.63 + 4.50 27.30 + 3.28 28.92 + 5.09 27.41 + 5.21 32.52 + 4.94 31.42 + 4.47 32.00 + 4.36 33.82 + 4.41 36.00 + 5.39 36.81 + 4.69 36.00 + 5.63 37.00 + 0.00 37.29 + 3.97 41.08 + 7.63 39.30 + 7.11 43.52 + 5.56 42.49 + 5.79 45.09 + 6.37 43.00 + 5.29 43.40 + 8.31
Placental thickness of less than 2.5 cm is associated with intrauterine growth retardation (Kunlmann and Warsof, 1996) while thick placentas are associated with maternal diabetes mellitus, foetal hydrops and intrauterine foetal infections. The usefulness of this relationship between placental thickness and growth parameters is that subnormal placental thickness for a gestational age may be the earliest indication of foetal growth retardation. When a thin placenta is observed foetal weight should be estimated and possible medical intervention undertaken if the foetal weight is below the normal value. In this study we adopted a cross sectional design and did not follow the patients longitudinally. There is a need to recruit subjects at the beginning of the second trimester and scan them at regular intervals to ascertain the relationship between placental thickness and growth parameters. Such a study should be multiple to increase the validity of the result. In our environment this will be a difficult task because of low literacy level.
136
Afr. J. Biotechnol.
90 y = 1.3024x + 15.366 R2 = 0.392 R = 626
80 70
BPD (mm)
60 50 40 30 20 10 0 0
5
10
15
20
25
30
35
40
45
Placental thickness (mm)
Figure 1. Graph of biparietal diameter (BPD) against placental thickness in the second trimester.
Figure 2. Graph of AC against placental thickness in the second trimester.
The mathematical relationships derived by regression analysis presented in equations 1, 2, 3, and 4 can be used to objectively reach a conclusion on the normality of placental thickness in relation to BPD and AC observed during obstetric scan.
Conclusion Placental thickness has a strong positive correlation with BPD and AC; with both parameters having identical relationship with placental thickness. Subnormal placental
Ohagwu et al.
120
137
y = 0.6853x + 56.988 R2 = 0.2726 R = 0.522
100
BPD (mm)
80
60
40
20
0 0
10
20
30 40 Placental thickness (mm)
50
60
70
Figure 3. Graph of BPD against placental thickness in the third trimester.
Figure 4. Graph of AC against placental thickness in the third trimester.
thickness for a particular gestational age may represent a sign of intrauterine growth retardation. We therefore recommend that measurement of placental thickness be routinely carried out during obstetric ultrasound scan. REFERENCES Anupama J, Ganesh K, Agarwal U, Kharakwal S (2001). Placental thickness- A sonographic indicator of gestational age. J Obst. Gyne. Indian 51(3): 48-49.
Hebbar S (2003). Critical evaluation of various methods of estimating foetal weight by ultrasound. J. Obstet. Gynecol. Indian 52(2): 131133. Hoddick WK, Mahony BS, Callen PW, Filly RA (1985). Placental thickness. J Ultra Med. 4(9): 479-482. Implantation and Development of the Placenta: Introduction and Index http://www.vivo.colostate.edu/hbooks/pathphys/reprod/placenta Jauniaux E, Ramsay B, Campbell S (1994). Ultrasonographic investigation of placental morphologic characteristics and size during the second trimester of pregnancy. Am. J. Obstet. Gynecol. 170(1 pt1): 130-137. Kunlmann RS, Warsof S (1996). Ultrasound of the placenta. Clin.
138
Afr. J. Biotechnol.
Obstet. Gynecol. 39: 519-534. Mital P, Hooja N, Mehndiratta K (2002). Placental thickness: a sonographic parameter for estimating gestational age of the foetus. Indian J. Radiol. Imaging 12: 553-554. Sadler TW (2004). Langman’s medical embryology. 9th Edition. Baltimore, MD: Lippincott Williams and Wilkins. pp. 177-148. Shepard MJ, Richard VA, Berkowitz RL, Warsof SL, Hobbins JC (1987). An evaluation of two equations for predicting foetal weight by ultrasound. Am. J. Obstet. Gynecol. 156: 80-85.
Tongsong T, Boonyanurak P (2004). Placental thickness in the first half of pregnancy. J. Clin. Ultrasound. 32: 231-234. Ziylan T, Murshid KA (2003). An assessment of femur growth parameters in human fetuses and their relationship to gestational age. Turk. J. Med. Sci. 33: 27-32.