Theor Appl Climatol DOI 10.1007/s00704-014-1299-4
ORIGINAL PAPER
Relationships between Rwandan seasonal rainfall anomalies and ENSO events I. Muhire & F. Ahmed & K. Abutaleb
Received: 20 November 2013 / Accepted: 2 October 2014 # Springer-Verlag Wien 2014
Abstract This study aims primarily at investigating the relationships between Rwandan seasonal rainfall anomalies and El Niño-South Oscillation phenomenon (ENSO) events. The study is useful for early warning of negative effects associated with extreme rainfall anomalies across the country. It covers the period 1935–1992, using long and short rains data from 28 weather stations in Rwanda and ENSO events resourced from Glantz (2001). The mean standardized anomaly indices were calculated to investigate their associations with ENSO events. One-way analysis of variance was applied on the mean standardized anomaly index values per ENSO event to explore the spatial correlation of rainfall anomalies per ENSO event. A geographical information system was used to present spatially the variations in mean standardized anomaly indices per ENSO event. The results showed approximately three climatic periods, namely, dry period (1935–1960), semi-humid period (1961–1976) and wet period (1977–1992). Though positive and negative correlations were detected between extreme short rains anomalies and El Niño events, La Niña events were mostly linked to negative rainfall anomalies while El Niño events were associated with positive rainfall anomalies. The occurrence of El Niño and La Niña in the same year does not show any clear association with rainfall anomalies. However, the phenomenon was more linked with positive long rains anomalies and negative short rains anomalies. The I. Muhire : K. Abutaleb Department of Geography, Environmental Management and Energy Studies, University of Johannesburg, Auckland Park, Johannesburg, South Africa I. Muhire (*) College of Education, University of Rwanda, Kigali, Rwanda e-mail:
[email protected] F. Ahmed School of Geography, Archaeology and Environmental Studies, University of Witwatersrand, Johannesburg, South Africa
normal years were largely linked with negative long rains anomalies and positive short rains anomalies, which is a pointer to the influence of other factors other than ENSO events. This makes projection of seasonal rainfall anomalies in the country by merely predicting ENSO events difficult.
1 Introduction Variability in precipitation intensity and frequency has been observed globally during the past century (twentieth century), with Africa being the most affected (Sokona and Denton 2001; Huq et al. 2003; Boko et al. 2007; FAO 2008; Stringer et al. 2009). The subtropical zones, especially sub-Saharan Africa (SSA), have become more arid (Niasse et al. 2004; Druyan et al. 2008; Eriksen et al. 2008; Claudia et al. 2010). East Africa experiences the dipole rainfall pattern that is characterized by increases over the northern region and decreases over the eastern and southern regions (Mutai et al. 1998; Mutai and Ward 2000; Schreck and Semazzi 2004; Anyah and Semazzi 2007; Eriksen et al. 2008; Ilunga and Muhire 2010), with Rwanda becoming wetter over the northern highlands and south-western region and warmer over the eastern lowlands and the central plateau (Muhire and Ahmed 2014). Heavy rainfall has caused devastating floods and landslides in some parts of Rwanda in the last few years. The most affected areas are the Northern (Gakenke, Cyeru, Rulindo and Gicumbi districts) and Western (Nyamasheke, Nyamagabe, Karongi and Ngororero districts) regions in the years 2001, 2002, 2007, 2008 and 2012 (David et al. 2011). The May 2002 floods had 108 fatalities in the north western regions, while the 2007 one resulted in the displacement of more than 456 families, with hundreds of hectares of crops in Bigogwe sector in Nyabihu District destroyed. The September 2008 heavy rainfall accompanied with winds affected 8 of the 12 sectors of Rubavu District, leading to the displacement of
I. Muhire et al.
over 500 families and the destruction of about 2,000 ha of crops and infrastructure. The September 2012 floods in Nyabihu, Rubavu and Kirehe districts led to the displacement of more than 1,000 families and complete submersion of their crops (David et al. 2011). The Rwanda Red Cross has records to the effect that it assisted more than 5,820 people (by way of food and shelter) affected by floods in different parts of the country (e.g. Nyabihu, Rubavu, Musanze, Kayonza, Kirehe, Ngoma and Rwamagana districts) from 2006 to 2008 (MINERENA 2010). Notwithstanding all the available records, there is still no single published study detailing the relationship between the heavy rains, weather extreme episodes and El Niño-South Oscillation phenomenon (ENSO) events across the country. It is worth noting that the changes in mean rainfall over the Eastern Africa region were neither spatially uniform nor progressive for long periods but occurred in unpredictable events (Mary and Majule 2009). Climate forecasts predict increased precipitation variability and incidences of extreme events such as droughts, floods, and erratic rainfall (IPCC 2007; Mary and Majule 2009). If the driving factors of the predicted rainfall variability over East Africa were known, this could provide the basis for developing the most suitable measures and strategies to deal with the negative effects of the projected rainfall variability. Recent studies have shown a positive correlation between variability in seasonal rainfall totals and sea-surface temperature anomalies (SSTAs) over Eastern and Southern Africa (Indeje et al. 2000; Schreck and Semazzi 2004; Washington and Preston 2006; Anyah and Semazzi 2007; Shongwe et al. 2009, 2011). It is established that there is a strong relationship between the short rains (October–December) over East Africa and SST patterns in the tropical Pacific, tropical Indian and, to a lesser extent, tropical Atlantic Oceans (Beltrando and Camberlin 1993; Rowell et al. 1994; Mutai et al. 1998; Schreck and Semazzi 2004; Anyah and Semazzi 2007; Shyongwe et al. 2009, 2011). This positive correlation results from the influence of global and regional large-scale sea-surface temperature-forced signals ENSO phenomenon on the tropical atmospheric circulation (Rasmusson and Carpenter 1982; Ropelewski and Halpert 1987; Rowell et al. 1994; Mutai and Ward 2000; Schreck and Semazzi 2004). However, these studies are not spatially specific as they give an overview of the relationship between rainfall variability and SSTAs over East Africa. Consequently, a study that seeks to elucidate the relationship between Rwandan rainfall anomalies and ENSO events, as well as offer more specific associations between the rainfall variability and ENSO events at regional and local levels, is required. The wetter conditions over Eastern Africa where Rwanda is located were linked to warm ENSO (El Niño), while the drier conditions were associated with the cold ENSO events (La Nina) (Indeje et al. 2000; Hastenrath and Polzin 2004; Schreck and Semazzi 2004; O’Hare et al. 2005; Ilunga and Muhire 2010; Shyongwe et al. 2009, 2011). During the warm
ENSO events, the evaporation rate is high, leading to increased moisture in the atmosphere and the resultant heavy rainfall. The cold ENSO events react in the opposite manner (Mutai et al. 1998; Glantz 2001; Schreck and Semazzi 2004). However, ENSO explains about 50 % of the rainfall variability over Eastern Africa, with other factors responsible for the variance (Ogallo 1988; Nicholson and Nyenzi 1990; Nicholson 1996; Mutai et al. 1998; Indeje et al. 2000). Long (March–May) and short (September–December) rains patterns over East Africa in general and Rwanda in particular are largely controlled by the intertropical convergence zone (ITCZ) (Mutai and Ward 2000; Ilunga et al. 2004; Anyah and Semazzi 2007; Kizza et al. 2009). This would ideally make the respective rains variability to be associated with SST patterns over the Indian and Atlantic oceans from the ITCZ over Rwanda, and the convergence of Mascarene Anticyclones from the Indian Ocean, and Saint Helena Anticyclones from the South Atlantic Ocean (Mutai and Ward 2000; Ilunga et al. 2004; Anyah and Semazzi 2007; Kizza et al. 2009). Long and short rains were investigated because they contribute about 75 % of the rains received in Rwanda. In addition, more rainfall variability was observed during the two seasons where the long rains were markedly reduced especially in May (Muhire and Ahmed 2014). At the same time, an increase was observed during the short rains period especially over the northern highlands and south-west region of Rwanda (Muhire and Ahmed 2014). It needs not be overemphasized that changes in rainfall intensity and frequency, which are linked with ENSO events, are bound to have an impact (positive or negative) on crops productivity and by extension the livelihoods of majority of the population. It is with that in mind that this study provides useful information on long and short rains anomalies (corresponding with crops growing periods) linked with ENSO events to help decision-makers and the population in general to move from a state of unpreparedness to actionable knowledge, impact prevention and response mechanisms (Andrews and Flores 2008) across the country and within specific seasons. Of prime concern is the agriculture sector.
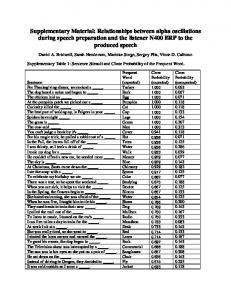
2 Study area Rwanda is a landlocked country located in East Africa. It covers an area of 26,338 km2 and lies between 1°4′ and 2°51′ south, and 28°53′ and 30°53′ east (Fig. 1a) (Sirven et al. 1974; Ilunga et al. 2004; MINERENA 2010). Despite its proximity to the equator, Rwanda is spatially subdivided into four climatic regions, which are moderated by hilly topography varying between 900 and 4,507 m (Ilunga et al. 2004). The Eastern lowlands, lying between 1,000 and 1,500 m in altitude, receive rainfall of between 700 and 1,100 mm annually (Fig. 1b, c). The central plateau region,
Rwandan seasonal rainfall anomalies and ENSO events
Fig. 1 Location of the weather stations used in the study, topography and spatial variations of annual mean rainfall in Rwanda (1935–1992)
located between 1,500 and 2,000 m, enjoys rainfall ranging between 1,100 and 1,300 mm (Fig. 1b. c). The highlands, including the Congo-Nile Ridge and volcanic chains of Birunga with height varying between 1,800 and 4,500 m, benefit from an annual rainfall of between 1,300 and 1,550 mm (Fig. 1b, c). Regions around Kivu Lake and Bugarama plains, sitting on 900–1,800 m get between 1,200 and 1,500 mm of rainfall per year (Fig. 1b, c) (Sirven et al. 1974; Ilunga et al. 2004; REMA 2009; Ilunga and Muhire 2010; MINERENA 2010; David et al. 2011; Muhire and Ahmed 2014).
Rwanda has four climatic seasons. The long rains (March–May) and short rains (September–November) alternate with long dry (June–August) and short dry seasons (December–February). The long and short rains account for about 43 % (320–700 mm from east to west) and 32 % (220–600 mm from east to west) of the annual mean rainfall, respectively (Ilunga et al. 2004; Muhire and Ahmed 2014). The long dry and short dry seasons on the other hand are responsible for 5 % (40–70 mm from east to west) and 20 % (160–280 mm
I. Muhire et al.
from east to west) of the annual mean rainfall, respectively (Ilunga et al. 2004; Muhire and Ahmed 2014). With regard to the number of rainy days (i.e. days with rainfall of more than zero mm), it rains at least once in every 2 days over the south-west region and the north-west highlands, and once in 4 days over the central plateau and the eastern lowlands during the two seasons (Ilunga et al. 2004; Muhire and Ahmed 2014). The average (highest) intensity of 7.6 mm per day is recorded during the long rains period over the south-west and the north-west highlands, while the lowest is registered over the eastern lowlands during the long dry season, especially in July where several consecutive dry spells (up to a month) are recorded (Ilunga et al. 2004; Muhire and Ahmed 2014). The four seasons above mentioned are largely controlled by the position and intensity of anticyclones such as Mascarenes, Saint Helena, Azores and Siberian (Mutai and Ward 2000; Ilunga et al. 2004; Anyah and Semazzi 2007; Kizza et al. 2009). Rwanda experiences the influence of Mascarene anticyclones from the coast of Mozambique in the Indian Ocean, which converge with wet winds (Saint Helena anticyclones) from the South Atlantic Ocean that pass over the Congo basin and Lake Kivu to form the ITCZ. These anticyclones are responsible for the heavy rainfall between March and May. Between June and August, the country comes under the influence of the dry Saint Helena and Azores anticyclones, which cause the dry conditions mainly in the eastern lowlands (Mutai and Ward 2000; Clark et al. 2003; Ilunga et al. 2004; Anyah and Semazzi 2007; Ilunga et al. 2008; Kizza et al. 2009). At the beginning of September, the ITCZ begins at the coast of Somalia and passes over Lake Victoria where it gathers humidity and brings rain to Rwanda, before heading southwards by the end of November. Dry and cold air masses (Siberian anticyclones) from the Arabian Sea are pushed by winter monsoon over Lake Victoria to yield some humidity, which gives a little rainfall in the highlands from December to February (Mutai et al. 1998; Indeje et al. 2000; Mutai and Ward 2000; Clark et al. 2003; Ilunga et al. 2004; Anyah and Semazzi 2007; Ilunga et al. 2008; Kizza et al. 2009). Thus, the sea-surface temperatures-signals ENSO phenomenon over the Atlantic, Indian and Pacific oceans contribute significantly to the seasonal rainfall variability over Rwanda (Indeje et al. 2000; Schreck and Semazzi 2004; Washington and Preston 2006; Anyah and Semazzi 2007; Shongwe et al. 2011). It follows, therefore, that strong relationships between rainfall anomalies and ENSO events are expected.
3 Materials and methods Precipitation data used in this study were collected from the Rwandan Meteorological Center based in Kigali, while the
ENSO events were sourced from Glantz (2001). In order to ensure a wide coverage of the country, the basic criteria for selecting the weather stations were length and completeness of records. The long and short rains were analysed for the period 1935–1992 using raw mean monthly data collected from 28 weather stations from which annual rainfall values were derived. While September, which is part of the short rains season in Rwanda, was left out, December was considered. The logic behind this was that the short rains in the former month do not correlate significantly with ENSO events while December showed a good relationship (Mutai et al. 1998; Mutai and Ward 2000; Funk and Brown 2006; Anyah and Semazzi 2007; Eriksen et al. 2008). The missing values in monthly records were estimated by interpolating the values from the complete nearby weather stations if these values were less than 3 % of the total weather station’s records for the whole study period (Türkeş et al. 1996, 2002; Kizza et al. 2009; Del Río et al. 2012). It is worth noting, however, that the more recent period (1993–2012) is not part of this study as most of the weather stations were destroyed during the 1990–1994 war and genocide. Consequently, a lack of comprehensive data for the said period is a major drawback to the study of Rwandan seasonal rainfall anomalies vis-à-vis ENSO events. The mean standardized anomaly indices for each year j (Xj) were calculated as follows: Xj ¼
Ri j −Ri σi
Where Rij is the seasonal rainfall in millimetre;
Ri is the mean seasonal rainfall of all years (1935–1992) for a given weather station; and σi is the standard deviation of seasonal rainfall totals over the study period (Mutai et al. 1998) for a given weather station. The annual mean standardized anomaly indices for the study period (1935–1992) at a given weather station were calculated, results that were thereafter used to derive the national figure. In an attempt to establish the relationship between rainfall anomalies and ENSO events, the results derived were associated with four episodes, namely, El Niño (warm ENSO event), La Niña (cold ENSO event), El Niño-La Niña (occurrence of warm and cold ENSO events in the same year) and non-ENSO (without occurrence of ENSO event). It is worth noting that the year with above-mean standardized index (positive rainfall anomaly) was rated as being wet, while that with below-mean standardized index (negative rainfall anomaly) was taken to be relatively dry. Hence, the annual climatic characteristics were determined by analysing the trends (positive/negative) of rainfall anomaly indices, drawn from the various weather stations. One-way analysis of variance (ANOVA) was applied on mean standardized anomaly indices per ENSO event. Thus, four mean standardized anomaly indices associated with each of the above-mentioned ENSO events at each of the 28 weather stations were obtained to investigate the spatial
Rwandan seasonal rainfall anomalies and ENSO events
variations of rainfall anomalies in relation to ENSO events. A geographical information system (GIS) was used to generate the maps of the variances and direction of mean standardized anomaly indices per ENSO event. Spatially, the results were first presented in vector form that was interpolated by performing ‘topo to raster analyst’. Then, the variances of mean standardized anomaly indices per ENSO event were presented with contours, while the direction (positive or negative) of mean standardized anomaly indices was differentiated using grey colours as used by Del Río et al. (2012).
4 Results and discussion 4.1 Relationships between long rains anomalies and ENSO events The mean standardized rainfall anomaly values presented in Figs. 2 and 3 attest to the general trends of rainfall variations. Positive standardized rainfall anomalies indicate a rise in rainfall while negative anomalies show a decrease in rainfall amounts compared to the mean rainfall received during the study period (1935–1992). The number of weather stations with negative/positive rainfall anomaly values was also analysed to evaluate the extent to which rainfall variability is linked to ENSO in Rwanda. It is evident from Figs. 2 and 3 that the study period can safely be subdivided into three main climatic periods: drier period (1935–1962), semi-humid period (1963–1976) and wet (humid) period (1977–1992). This means in essence that a rise in rainfall in Rwanda was registered from the 1960s, reaching the apex in the 1980s (Muhire and Ahmed 2014). The period 1935–1962 comprises 20 and 8 years with drier and wetter conditions, respectively. Six out of eight wet years are associated with El Niño, while the remaining six El Niño events are linked with the drier conditions. Notwithstanding that 1937 was linked with non-ENSO events, it registered the 30
NegaƟve long rains anomalies PosiƟve long rains anomalies
25 20
15 10
5 0
1935 1937 1939 1941 1943 1945 1947 1949 1951 1953 1955 1957 1959 1961 1963 1965 1967 1969 1971 1973 1975 1977 1979 1981 1983 1985 1987 1989 1991
Number of weather staƟons
Fig. 2 Number of weather stations with negative and positive long rains anomalies (1935–1992)
highest index of 1.37. The six wet years associated with El Niño events had high anomaly indices (positive). This goes to show that wetter conditions would be predicted at the rate of 50 % during this period using El Niño data predictions. It also emerged that seven out of nine La Niña events recorded during this period were linked with drier conditions with one wet year (1942) associated with El Niño-La Niña events. This reveals a strong relationship between La Niña events and drier conditions. Thus, it was possible to predict drier conditions from the predicted La Niña events at the rate of 85 % during the period 1935–1962. The period 1963–1976 shows equal number of dry and wet years (7 years), where five out of the seven wet years were linked with El Niño. In addition, the highest rainfall anomaly indices were associated with El Niño. However, there is no clear association between La Niña and dry years. Thus, El Niño events have strong relationships (71.4 %) with wetter climatic conditions during this period. Only 4 years with drier conditions were registered in the period 1977–1992, where all El Niño events were associated with wetter conditions. However, one in two La Niña events registered during this period was linked with drier conditions. This shows again that the wetter conditions were strongly associated with El Niño events, just as La Niña events were linked with drier conditions. From this analysis, therefore, it is concluded that La Niña events were better associated with drier climatic conditions for the period 1935–1962, while El Niño events were more linked with wetter conditions for the period 1963–1992, and nonENSO events were strongly linked with drier conditions. However, it is imperative to note that strong relationships between rainfall anomalies and ENSO events were not seen for the entire period of study and at all weather stations. This is evidence enough that ENSO events alone cannot be used to explain the long rains variability over Rwanda. A summary of the association between rainfall anomalies and ENSO events for the period 1935–1992 is provided in Table 1.
Years
I. Muhire et al. Fig. 3 Associations of long rains anomalies and ENSO events (El, El Niño event; La, La Niña; El/La, both El Niño and La Niña)
2 El
1.5
El
1
El /La El
0.5
La El /La El /La
El El /La
El
0 El
-0.5
La
EL La
El /La El La
La
ElEl /La
El
La
-1
El /La
El /La
El
La
El
El El El
El
El
El El
La El /La
La
El
La
1935 1937 1939 1941 1943 1945 1947 1949 1951 1953 1955 1957 1959 1961 1963 1965 1967 1969 1971 1973 1975 1977 1979 1981 1983 1985 1987 1989 1991
-1.5
El Niño events were associated with positive rainfall anomalies at the rate of 71.4 %, while La Nina events were associated with negative rainfall anomalies at the rate of 72.7 % for the whole period of study. While the years linked with El Niño-La Niña did not show any specific association, the ‘normal’ years (non-ENSO events) were linked with negative rainfall anomalies at 72.2 %. Such high correlation between the ‘normal’ years and drier conditions may be associated with other climatic factors rather than ENSO events. It emerges, therefore, that positive rainfall anomalies are associated more with El Niño while La Niña is associated with negative rainfall anomalies. Indeje et al. (2000), Schreck and Semazzi (2004), Kijazi and Reason (2005), and O’Hare et al. (2005) got similar findings for the short rains period over the Eastern Africa region, where positive rainfall anomalies were associated with El Niño and La Niña was linked with negative rainfall anomalies at the rate of around 70 %. This study made an analysis of extreme rainfall anomalies in relation to ENSO events with a view to further exploring the correlation of ENSO events with occurrences of weather extreme events such as flooding episodes. While fully admitting that the prediction of incidences of extreme events such as floods, erratic rainfall and droughts can be efficiently made using daily precipitation data, the annual mean rainfall anomalies give a general picture of the annual rainfall variability. An analysis of the annual extreme rainfall anomalies can give an idea of the years that have experienced extreme weather events (e.g. floods, erratic rainfall). The correlation of extreme Table 1 Number of years with drier/wetter conditions in association with ENSO events
Climatic conditions
Number of years with drier conditions Number of years with wetter conditions Total years
rainfall anomalies with ENSO events would give a clearer picture of the role of ENSO events in causing extreme weather events especially floods in Rwanda. The extreme positive rainfall anomalies were considered as the mean standardized anomaly indices ≥1, while the extreme negative rainfall anomalies were considered as the mean standardized anomaly indices ≤−1. Figure 4 shows the relationship between extreme mean standardized anomaly indices and ENSO events at four representative weather stations. During the period of study (i.e. 1935–1992) between 7 and 9 years had either negative or positive extreme long rains anomalies. At the same time, a significant percentage (between 50 and 78 %) was marked for extreme rainfall anomalies, mostly associated with El Niño events. More positive extreme long rains anomalies (wettest years) were observed from the 1970s and became more pronounced towards the end of the 1980s, as evidenced by increased flooding episodes that occurred especially over the northern highlands and south-western regions of Rwanda in the 1980s and 1990s (MINERENA 2010; CAMCO 2011; David et al. 2011). A study on the correlation between these flooding episodes and El Niño events is recommended. At the same time, a forecast of extreme weather conditions such as flooding should be done with caution since El Niño events are associated with between 10 and 33 % of the total negative extreme rainfall anomalies. Note should also be taken of the existence of other predicted El Niño events which do not necessarily link with any extreme rainfall anomaly.
El Niño
La Niña
El Niño and La Niña
Non-ENSO
Years
%
Years
%
Years
%
Years
%
6
28.6
8
72.7
4
50
13
72.2
15
71.4
3
27.3
4
50
5
27.8
21
100
11
100
8
100
18
100
Rwandan seasonal rainfall anomalies and ENSO events Fig. 4 Relationship between extreme mean standardized long rains anomalies and ENSO events (El, El Niño event; La, La Niña; El/La, El Niño-La Niña; No, nonENSO)
It was also observed that more negative extreme long rains anomalies (driest years) were registered in the period 1943– 1955 (Fig. 4). These anomalies, however, do not show a clear link with La Niña or El Niño events. Between 33 and 57 %, 22 and 44 % and 10 and 34 % of the total negative extreme rainfall anomalies are associated with ‘normal years’ (nonENSO years), La Niña and El Niño events, respectively. As such, the negative extreme long rains anomalies do not show a clear association with ENSO events. The occurrence of El Niño and La Niña in the same year does not show any clear association with extreme rainfall anomalies. A number of normal years (non-ENSO years) were associated with extreme rainfall anomalies, especially the negative. All these are a pointer to the fact that factors other than ENSO events could be associated with observed extreme rainfall anomalies for the period 1935–1992 in Rwanda. The figures show a spatial distribution of variances in mean standardized indices per ENSO event. Figure 5 shows that most parts of Rwanda experienced positive rainfall anomalies with regard to El Niño events and negative rainfall anomalies in association with La Niña events.
The above-mean standardized anomaly indices associated with El Niño oscillated between 0.1 and 0.41. Save for small pockets in the western region, most parts of the country showed a positive pattern in mean rainfall anomalies linked with El Niño. The opposite was observed insofar as association with counter event (La Niña) was concerned, where a negative trend of between 0.1 and 0.61 in mean rainfall anomaly indices was observed over most parts of the country. Only a few isolated areas in the western region—to the west of the Congo-Nile crest—had a positive trend. This region is mostly influenced by wet winds (Saint Helena anticyclones) from the South Atlantic Ocean that pass over the Congo basin and Lake Kivu to form ITCZ with Mascarene anticyclones. Mascarene anticyclones from the Indian Ocean influence areas to the east of the Congo-Nile crest (Ilunga et al. 2004). This attests to the strong relationships existing between rains over East Africa and SST patterns in the tropical Pacific, tropical Indian and, to a lesser extent, tropical Atlantic Oceans (Beltrando and Camberlin 1993; Rowell et al. 1994; Mutai et al. 1998; Schreck and Semazzi 2004; Anyah and Semazzi 2007; Shongwe et al. 2009, 2011).
I. Muhire et al. Fig. 5 Variance in mean standardized long rains anomaly indices per ENSO event
Years linked with El Niño-La Niña showed positive rainfall anomalies over the Congo-Nile Crest, Birunga volcanoes and the eastern region. The rest of the country (the central and western regions) showed negative rainfall anomalies. A high positive anomaly index of 0.71 was linked with a combination of El Niño and La Niña events over the eastern region of Rwanda, the region that is on average dry compared to the rest of the country. The lowest negative anomaly index of 0.284 was seen over the western region, the wettest region of the country. The situation could be associated with the influence of cold ENSO event (La Niña) over the tropical Atlantic Ocean, which has led to a negative rainfall trend over the western region of Congo-Nile crest. At the same time, the unusual positive rainfall trend over the eastern region of the country could result from the influence of warm ENSO (El Niño event) over tropical Pacific and tropical Indian Oceans during the years when both El Niño and La Niña were observed. Apart from the central region extending over most of the Congo-Nile crest, all other areas of the country were under negative rainfall anomalies in association with normal years. It is clear that these ‘normal years’ (non-ENSO years) show low rainfall anomaly indices ranging between 0.01 and 0.1 in most parts with the exception of the northern highlands and southwest region where negative rainfall anomaly indices oscillated
between 0.3 and 0.43. The positive rainfall anomalies and higher negative anomalies over the Congo-Nile crest and northern highlands, respectively, may be linked to the orographic factor (highlands), while the higher negative anomalies in the south-west region (around Lake Kivu) may be due to the effects of the water body on the local climate. It worth noting that the lower and higher rainfall anomaly indices observed during the non-ENSO years and ENSO years, respectively, show also the association between ENSO events and long rains anomalies over Rwanda. 4.2 Relationship between short rains anomalies and ENSO events The mean standardized rainfall anomaly values shown in Figs. 6 and 7 give a general picture of short rains variations for the period 1935–1992 and their associations with ENSO events. Positive standardized short rains anomalies indicate the rise in rainfall while the negative anomalies show a decrease in rainfall amounts compared to the mean rainfall received during the study period (1935–1992). Save for 1956 and 1979 where positive and negative mean rainfall anomaly indices were registered at 14 and 15 weather stations, respectively. The years take the same characteristic (dry or wet) of the weather stations higher in number as was
Rwandan seasonal rainfall anomalies and ENSO events 30
NegaƟve short rains anomalies PosiƟve short rains anomalies
25
Number of weather staƟons
Fig. 6 Number of weather stations with negative and positive short rains anomalies (1935–1992)
20 15 10
5
1935 1937 1939 1941 1943 1945 1947 1949 1951 1953 1955 1957 1959 1961 1963 1965 1967 1969 1971 1973 1975 1977 1979 1981 1983 1985 1987 1989 1991
0
Years
the case for the long rains anomalies. From Figs. 6 and 7, it is evident that the period of study can be subdivided into three main climatic periods: drier period (1935–1956), semi-humid period (1957–1976) and wet (humid) period (1977–1992). This means in essence that a rise in rainfall in Rwanda was registered since the 1960s, getting more pronounced in the 1980s. This attests to the recent significant increases in short rains registered in Rwanda, especially in the northern highlands and the south-western region from 1961 to 1992 (Muhire and Ahmed 2014). The period between 1935 and 1956 has only 3 years with wetter conditions, two of which are associated with El Niño events. All La Niña events are linked with drier conditions. Though the highest positive mean standardized anomaly indices (e.g. 0.84 and 0.89 for 1941 and 1951, respectively) are associated with El Niño events, the lowest index of −1.42 of 1952 is also recorded in an El Niño year. In addition, there were many years in which high negative anomaly indexes were observed in association with El Niño. This shows that there were positive and negative correlations between rainfall anomalies and El Niño events. Although all La Niña events were 2 1.5 1
El
El
0.5 El
0 -0.5
-1 -1.5
El El
El
El El La La El/La El La El/LaLa
El La ElEl/La
El/La ElEl/La El
El La
La
El
El El
La La
El El
El/La El/La La El/La El
El
-2 1935 1937 1939 1941 1943 1945 1947 1949 1951 1953 1955 1957 1959 1961 1963 1965 1967 1969 1971 1973 1975 1977 1979 1981 1983 1985 1987 1989 1991
Fig. 7 Associations of short rains anomalies and ENSO events (El, El Niño event; La, La Niña; El/La, both El Niño and La Niña)
associated with drier conditions, there were no clear differences between rainfall anomaly indices in the periods associated with La Niña and normal years (with non-ENSO events). It was observed that 8 drier and 12 wetter years were registered for the period 1957–1976. Only five El Niño events were associated with wetter conditions with another six showing a link with drier conditions. A half of La Niña events (four) were associated with drier conditions while the other half was linked with wetter conditions. This reveals a weak association between rainfall anomalies and ENSO events during this period. Both La Niña and El Niño events were associated with wet conditions, but it was El Niño events that accounted for the highest rainfall anomalies indices for the period 1977–1992. However, 1977 stood out as the driest year, a phenomenon that was linked with combined El Niño and La Niña events. The other two dry years were linked with non-ENSO. This shows a strong correlation between positive rainfall anomalies and El Niño for the period 1977–1992. Table 2 provides a general summary of the associations between ENSO events and short rains anomalies for the period 1935–1992.
I. Muhire et al. Table 2 Number of years with drier/wetter conditions in association with ENSO events during short rains
Climatic conditions
El Niño Years
Number of years with drier conditions Number of years with wetter conditions Total years
La Niña %
Years
%
El Niño and La Niña
Non-ENSO
Years
Years
%
%
8
38.1
7
63.6
6
75
8
44.5
13
61.9
4
36.4
2
25
10
55.5
8
100
18
21
El Niño events were associated with positive rainfall anomalies at the rate of 61.9 %; La Niña events with negative rainfall anomalies at the rate of 63.6 %. The years linked with combined El Niño and La Niña events had negative rainfall anomalies at the rate of 75 %, while the normal years (non-ENSO years) were linked with negative rainfall anomalies at the rate of 44.5 %. The negative rainfall anomalies had a stronger relationship with La Niña compared with El Niño’s association with positive rainfall anomalies. From the weak relationship between positive short rains anomalies and El Niño events, it is possible to explain the positive and negative correlations between the two (Fig. 8). This makes it difficult to predict the positive rains anomalies using El Niño data compared to the prediction of positive long rains anomalies. The higher correlation between negative rainfall anomalies and combined El Niño and La Niña events at the rate of 75 % may also result from the positive and negative correlations observed between El Niño and short rains anomalies. However, at around 60 %, it was possible to predict the short rains anomalies over Rwanda using anticipated El Niño and La Niña events. This is a low percentage compared to the link of 70 % between the rainfall variability and ENSO events during October and December over East Africa especially around Indian Ocean as per Ogallo (1988), Nicholson and Nyenzi (1990), Kapala et al. (1994), Nicholson (1996), Mutai et al. (1998), Indeje et al. (2000), Mutai and Ward (2000), and Kijazi and Reason (2005). An analysis of extreme rainfall anomalies in relation to ENSO events was made with a view to further exploring the correlation of ENSO events with occurrences of weather extreme events such as flooding episodes during the short rains period. Mean standardized anomaly index limits of ≥1 and ≤−1 for positive and negative extreme rainfall anomalies, respectively, were maintained as they were used in long rains extreme anomaly analysis. Figure 8 shows the relationship between mean standardized anomaly indices and ENSO events at four representative weather stations. It emerges that between 10 and 13, and 6 and 9 years with positive and negative extreme short rains anomalies, respectively, were observed for the period 1935–1992. Save for Cyangugu and Rwamagana weather stations
100
11
100
100
where the wettest years (with positive extreme short rains anomalies) were linked with El Niño at the rate of 40 and 36 %, respectively, the wettest years were associated with El Niño events at the rate of 70 and 77 % at Rwankeri and Butare weather stations, respectively. A high number of wettest years were registered by the end of 1970s and in 1980s. This explains the occurrence of increased flooding episodes that took place in Rwanda especially over the northern highlands and south-western region in 1980s and 1990s (MINERENA 2010; CAMCO 2011; David et al. 2011; Muhire and Ahmed 2014). The periods with negative extreme short rains anomalies do not show a clear association with ENSO events. This may be the result of the positive and negative correlations observed between extreme short rains anomalies and El Niño events and an improved association between positive and negative extreme rainfall anomalies with normal years (non-ENSO years). This association is different from what was found by Kabanda and Jury (1999) over most parts of East Africa, which stood a low chance of receiving below normal rainfall in associations with warm ENSO events. Further investigation on the driving factors of extreme short rains anomalies over Rwanda is recommended so as to fully comprehend how the correlations work. The high relationships between positive extreme short rains anomalies and normal years (non-ENSO years) were registered compared to the correlations observed in long rains period. Consequently, the observed recent increases in mean short rains over Rwanda and more occurrences of flooding episodes (MINERENA 2010; CAMCO 2011; David et al. 2011; Muhire and Ahmed 2014) may not only be linked with ENSO events but also to other climatic factors. This makes it difficult to forecast the extreme weather conditions such as flooding during the short rains periods based only on ENSO events data. Figure 5 shows the variance in short rains anomalies per ENSO event. The spatial representation (Fig. 9) reveals that most parts of the country showed positive short rains anomalies with regard to El Niño events and negative short rains anomalies linked to La Niña events. The above-mean standardized anomaly indices ranged between 0.1 and 0.33 with regard to El Niño. As for La Niña events, the below-mean standardized anomaly indices oscillated between 0.1 and 0.41. Although more years
Rwandan seasonal rainfall anomalies and ENSO events Fig. 8 Relationships between extreme mean standardized short rains anomalies and ENSO events (El, El Niño event; La, La Niña; El/La, both El Niño and La Niña; No, non-ENSO)
with extreme short rains anomalies were observed during the short rains period, these mean standardized anomaly indices are lower compared to those registered during the long rains anomalies. It is safe, therefore, to conclude that the long rains period showed a more rainfall variability compared to the short rains period, which is contrary to what happened in the other Eastern Africa regions (Mutai et al. 1998; Mutai and Ward 2000; Funk and Brown 2006; Anyah and Semazzi 2007; Eriksen et al. 2008). This may be attributed to the following factors: firstly, the influence of Lake Victoria as the ITCZ begins at the coast of Somalia and passes over the lake where it gathers humidity to yield rains over Rwanda (Mutai and Ward 2000; Ilunga et al. 2004; Anyah and Semazzi 2007; Kizza et al. 2009). The lake perhaps moderates these onward winds and in so doing modifies the expected influence of the ENSO events on the short rains anomalies, consequently leading to the weak relationships between short rains anomalies and ENSO events as was observed above. The same factor could explain a contrasting behaviour of the north-eastern region of the country where negative rainfall anomalies were
associated with El Niño and positive anomalies associated with La Niña. Secondly, the horizontal convergence anomaly motion associated with higher SSTs over the western sector of the Indian Ocean during warm ENSO events weaken the prevailing south easterly low-level circulation over the Eastern Africa region including Rwanda (Schreck and Semazzi 2004). Lastly, the low short rains variability may be attributed to other climatic factors (e.g. global, regional, local atmospheric circulation, monsoon and trade winds, tropical cycles, subtropical cyclones, easterly/westerly waves, extra-tropical weather systems, etc.) rather than ENSO events (Mutai et al. 1998; Indeje et al. 2000). Save for a small region in the Congo-Nile crest which showed positive rainfall anomalies (0.1–0.4) linked El NiñoLa Niña events, the rest of the country had negative rainfall anomalies ranging between 0.01 and 0.82. The normal years (non-ENSO years) were mainly associated with positive rainfall anomalies (between 0.01 and 0.35) except small pockets in the central and western regions, which are different from
I. Muhire et al. Fig. 9 Variance in mean standardized short rains anomaly indices per ENSO event
what happened during long rains period. This is evidence that the other factors rather than ENSO events came in handy as shown above. It is for this reason that further research regarding the various climatic factors that are associated with long and short rains anomalies in Rwanda is recommended, so as to be able to make more accurate forecasts.
5 Conclusion Analysis of rainfall anomalies is key to establishing three climatic periods in Rwanda, namely, dry period (1935– 1960), semi-humid period (1961–1976) and wet period (1977–1992). Arising from this, increased rainfall was recorded from the 1960s to the 1980s especially during the short rains period. Most of the El Niño events were associated with positive rainfall anomalies, while La Niña events were linked with negative rainfall anomalies. At the same time, the analysis of the variance in mean standardized anomaly indices showed a healthy relationship between positive rainfall anomalies and El Niño on one hand, and negative rainfall anomalies and La Niña on the other. However, the combined El Niño and La Niña events do not show any clear association with rainfall anomalies; they were more linked with positive long rains and negative short rains anomalies.
The normal years (non-ENSO years) were dominantly associated with negative long rains and positive short rains anomalies. Thus, other climatic factors like global, regional, local atmospheric circulation, monsoon and trade winds, tropical cycles, African Jet Stream, subtropical cyclones, easterly/westerly wave, extra-tropical weather systems, etc. (Mutai et al. 1998; Kabanda and Jury 1999; Indeje et al. 2000) could have an impact on rainfall variability in Rwanda. An analysis of the impact of each of these factors on rainfall variability in Rwanda is recommended. Notwithstanding that more occurrences of flooding episodes, soil erosion and landslides have been observed recently especially in the northern highlands and southwestern region of Rwanda, there is no study correlating these episodes with ENSO events. Hence, a study on the relationships between rainfall erosivity, flooding episodes and ENSO events is also recommended. This, it is hoped, will shed more light on the impacts of ENSO events on the occurrences of extreme events in Rwanda. Acknowledgments We wish to first of all express our sincere gratitude to the Government of the Republic of Rwanda and the University of Johannesburg, for all the financial assistance accorded to the first author. Similar gratitudes go to the University of Rwanda-College of Education for granting him a study leave to pursue PhD studies. The authors are grateful to the Rwandan Meteorological Center based in Kigali for providing rainfall dataset used in this study.
Rwandan seasonal rainfall anomalies and ENSO events
References Andrews C, Flores M (2008) Vulnerability to hunger. Improving food crisis responses in fragile states. UNU Wider, 42, Finland Anyah RO, Semazzi FHM (2007) Variability of East African rainfall based on multiyear RegCM3 simulations. Int J Climatol 27(3):357–371 Beltrando G, Camberlin P (1993) Interannual variability of rainfall in the eastern horn of Africa and indicators of atmospheric circulation. Int J Climatol 13(5):533–546 Boko M, Niang I, Nyong A, Vogel C, Githeko A, Medany M, OsmanElasha B, Tabo R, Yanda P (2007) In: Parry ML, Canziani OF, Palutikof JP, van der Linden PJ, Hanson CE (eds) Africa: climate change 2007: impacts, adaptation and vulnerability. Contribution of working group II to the fourth assessment report of the intergovernmental panel on climate change. Cambridge University Press, Cambridge, pp 433–467 CAMCO (2011) Rwanda country situational analysis. Nairobi, Kenya Clark CO, Webster PJ, Cole JE (2003) Inter-decadal variability of the relationship between the Indian Ocean zonal mode and East African coastal rainfall anomalies. J Climate 16:548–554 Claudia R, Tingju Z, Ximing C, Jawoo K, Dingbao W (2010). Climate change impacts on food security in Sub-Saharan Africa. International Food Policy Research Institute. Available on http:// www.parcc-web.org/parcc-project/documents/2012/12/climatechange-impacts-on-food-security-in-sub-saharan-africa.pdf Accessed 29 May 2014 David K, Megan C, Christian C, Jillian D, Ryan H, Robert M, Mathew W, Sally T, Andrew AB, Michael H (2011) Green growth and climate resilience national strategy for climate change and low carbon development. Republic of Rwanda, Kigali Del Río S, Cano-Ortiz A, Herrero L, Penas A (2012) Recent trends in mean maximum and minimum air temperatures over Spain (1961– 2006). Theor Appl Climatol 109:605–625 Druyan L, Fulakeza M, Lonergan P (2008) The impact of vertical resolution on regional model simulation of the west African summer monsoon. Int J Climatol 28:1293–1314 Eriksen S, O’Brien K, Losentrater L (2008). Climate change in eastern and southern Africa: impacts, vulnerability and adaptation. Global environmental change and human security, Report, 2008:2. University of Oslo. Available on http://www.bvsde.paho.org/ bvsacd/cd68/ClimAfrica.pdf Accessed on 29 May 2014 Food and Agriculture Organization (FAO) (2008). Climate change and food security: a framework document. FAO, Rome Funk CC, Brown ME (2006) Intra-seasonal NDVI change projections in semi-arid Africa. Remote Sens Environ 101:249–256 Glantz MH (2001) Currents of change: impacts of El Niño and La Niña on climate and society, 2nd edn. Cambridge University Press, UK Hastenrath S, Polzin D (2004) Dynamics of the surface wind field over the equatorial Indian Ocean. Q J Roy Meteorol Soc 130(597):503–517 Huq S, Rahman A, Konate M, Sokona Y, Reid H (2003) Mainstreaming adaptation to climate change in Least Developed Countries (LDCS). International Institute for Environment and development, London Ilunga L, Muhire I (2010) Comparison of the Rwandan annual mean rainfall fluctuations with El-Nino/La Nina events and sunspots. Geo-Eco-Trop 34(1–2):75–86 Ilunga L, Mbaragijimana C, Muhire I (2004) Pluviometric seasons and rainfall origin in Rwanda. Geo-Eco-Trop 28(1–2):61–68 Ilunga, L., Mugiraneza, A., Mukingambeho, D., Maguru, M., Uwimana, J. and Muhire, I., (2008). Probable sowing period in Rwanda. GeoEco-Trop, 32(1-2):29–36 Indeje M, Semazzi FHM, Ogallo LJ (2000) ENSO signals in East African rainfall seasons. Int J Climatol 20:19–46 IPCC (2007) Climate change 2007: impacts, adaptation and vulnerability. Contribution of working group II, III to the fourth assessment report
of the Intergovernmental Panel on Climate Change. Cambridge University Press, Cambridge Kabanda TA, Jury MR (1999) Inter-annual variability of short rains over northern Tanzania. Climate Res 13:231–241 Kapala A, Born K, Flohn H (1994) Monsoon anomaly or an El Niño event in the Equatorial Indian Ocean? Catastrophic rains 1961/62 in East Africa and their teleconections. WMO/TD 619:119–126 Kijazi AL, Reason CJC (2005) Relationships between intraseasonal rainfall variability of coastal Tanzania and ENSO. Theor Aplied Climatol 82:153–176 Kizza M, Rodhe A, Xu CY, Ntale HK, Halldin S (2009) Temporal rainfall variability in the Lake Victoria Basin in East Africa during the twentieth century. Theor Appl Climatol 98:119–135 Mary AL, Majule AE (2009) Impacts of climate change, variability and adaptation strategies on agriculture in semi-arid areas of Tanzania: the case of Manyoni District in Singida Region, Tanzania. Afr J Environl Sci Technol 3(8):206–218 Ministry of Natural Resources (MINERENA) (2010) Second National Communication under United Nations Framework Conventions on Climate change (UNFCCC). Kigali, Rwanda Muhire I, Ahmed F (2014) Spatio-temporal trend analysis of precipitation data over Rwanda. South Afr Geogr J. doi:10.1080/03736245.2014. 924869 Mutai CC, Ward MN (2000) East African rainfall and the tropical circulation/convection on intraseasonal to interannual timescales. J Climate 13:3915–3939 Mutai CC, Ward MN, Colman AW (1998) Towards the prediction of the East Africa short rains based on sea-surface temperature and atmosphere coupling. Int J Climatol 18(9):975–997 Niasse M, Afound A, Amani A (eds) (2004) Reducing West Africa’s vulnerability to climate impacts on water resources, wetland and desertification: elements of a regional strategy for preparedness and adaptation. IUCN, Gland Nicholson SE (1996) A review of climate dynamics and climate variability in Eastern Africa. In: Johnson TC, Odata E (eds) Limnology, climatology and paleoclimatology of the East African lakes. Gordon and Breach, The Netherlands Nicholson SE, Nyenzi BS (1990) Temporal and spatial variability of SST in the tropical Atlantic and Indian Oceans. Meteorol Atmos Phys 42: 1–17 O’Hare G, Sweeney J, Wilby R (2005) Weather, climate and climate change: human perspectives. Pearson, Harlow, England, 403p Ogallo LJ (1988) Relationships between seasonal rainfall in East Africa and the Southern Oscillation. J Climatol 8:34–43 Rasmusson EM, Carpenter TH (1982) Variations in tropical sea surface temperature and surface wind fields associated with the Southern Oscillation: El Niño. Mon Weather Rev 110:354–384 Ropelewski CF, Halpert MS (1987) Global and regional scale precipitation patterns associated with El Niño-Southern Oscillation. Mon Weather Rev 115:1606–1626 Rowell DP, Ininda JM, Ward MN (1994). The impacts of global sea surface temperature patterns on seasonal rainfall in East Africa. Proceedings International Conference on Monsoon Variability and Prediction, Trieste, Italy, 9–13 May 1994, WMO/TD, 619:666–672 Rwanda Environment Management Authority (REMA) (2009) Rwanda state of environment and outlook report. Kigali, Rwanda Schreck CJ, Semazzi FHM (2004) Variability of the recent climate of eastern Africa. Int J Climatol 24:681–701 Shongwe ME, van Oldenborgh GJ, van den Hurk BJJM, de Boer B, Coelho CAS, van Aalst MK (2009) Projected changes in mean and extreme precipitation in Africa under global warming. Part I: Southern Africa. J Clim 22:3819–3837 Shongwe ME, van Oldenborgh JG, van den Hurk, BJJM, de Boer B, van Aalst M (2011) Projected changes in mean and extreme precipitation in Africa under global warming, Part II: East Africa, Journal of Climate, (submitted)
I. Muhire et al. Sirven P, Gotanegre JF, Prioul C (1974). Géographie du Rwanda, A. De Boeck-Bruxelles Sokona Y, Denton F (2001) Climate change impacts: can Africa cope with the challenges? Clim Policy 1:117–123 Stringer LC, Dyer JC, Reed MS, Dougil AJ, Twyman C, Mkwambisi D (2009) Adaptations to climatic change, drought and desertification: local insights to enhance policy in Southern Africa. Environ Sci Pol 12(7):748–765
Türkeş M, Sümer UM, Kiliç G (1996) Observed changes in maximum and minimum temperatures in Turkey. Int J Climatol 16(4):463–477 Türkeş M, Sümer UM, Demir I (2002) Re-evaluation of trends and changes in mean, maximum and minimum temperatures of Turkey for the period 1929–1999. Int J Climatol 22(8):947–977 Washington R, Preston A (2006) Extreme wet years over Southern Africa: role of Indian Ocean sea-surface temperatures. J Geophys Res 111, D15104. doi:10.1029/2005JD006724