Journal of Exposure Science and Environmental Epidemiology (2014) 24, 517–521 & 2014 Nature America, Inc. All rights reserved 1559-0631/14
www.nature.com/jes
ORIGINAL ARTICLE
Reliability of triclosan measures in repeated urine samples from Norwegian pregnant women Randi J. Bertelsen1,2, Stephanie M. Engel3, Todd A. Jusko1,4, Antonia M. Calafat5, Jane A. Hoppin1, Stephanie J. London1, Merete Eggesbø6, Heidi Aase7, Pa˚l Zeiner8, Ted Reichborn-Kjennerud9, Gun P. Knudsen9, Virginia T. Guidry3 and Matthew P. Longnecker1 Triclosan (TCS) is a synthetic antibacterial chemical that is used in personal care products and is measurable in urine. Urinary TCS has been associated with allergy in children in Norway and the United States. A reasonable degree of temporal reliability of TCS urinary concentrations has been reported among US children as well as for Puerto Rican pregnant women. We examined the reliability of TCS measures in urine among Norwegian pregnant women. TCS was measured in spot urine samples collected in gestational weeks 17, 23, and 29 from 45 women in The Norwegian Mother and Child Cohort Study (MoBa) enrolled in 2007 and 2008. Spearman’s rank correlation coefficient (rs) and intraclass correlation coefficient (ICC) statistics were calculated. Fifty-six percent of the 45 women had a least one sample with a value above the method limit of detection (2.3 mg/l). The correlation coefficients were 0.61 for TCS concentrations at 17 and 23 weeks and 0.49 for concentrations at 17 and 29 weeks. For the three time points, the ICC was 0.49. The reliability of TCS concentrations in repeated urine samples from pregnant Norwegian women was reasonably good, suggesting a single urine sample can adequately represent TCS exposure during pregnancy. Journal of Exposure Science and Environmental Epidemiology (2014) 24, 517–521; doi:10.1038/jes.2013.95; published online 29 January 2014 Keywords: biomarkers; MoBa; intraclass correlation coefficient; pregnancy; reliability; triclosan
INTRODUCTION Triclosan (TCS) is a synthetic antibacterial chemical that is used in personal care products such as toothpaste, cosmetics, skin care creams and lotions, soaps and dental products, as well as in toys and kitchen utensils.1 TCS does not accumulate in the body and has a urinary half-life of about 21 h.2 A biomarker of TCS is measurable in urine. Urinary concentrations of TCS have been found to be associated with allergy in Norwegian children3 and in children and adolescents in the US National Health and Nutrition Examination Study (NHANES).4 In environmental epidemiology, collection of biological specimens is often limited to one single sample for each participant, and therefore knowledge about the temporal variability of urinary concentrations of the biomarkers is of importance in planning studies and interpreting results. The temporal variability of urinary concentrations of TCS in urine has been evaluated in 6–10-year-old healthy US children,5 and in pregnant women in Puerto Rico.6 However, differences between countries in the regulations and recommended use of TCS-containing consumer products7–9 may influence the dominant sources of exposure and thus, the reliability of TCS measures. In the present study, we examined the temporal variability of TCS concentrations in urine collected from Norwegian pregnant women across the gestational period.
MATERIALS AND METHODS The Norwegian Mother and Child Cohort Study (MoBa) is a prospective population-based pregnancy cohort initiated and maintained at the Norwegian Institute of Public Health.10 MoBa participants were recruited from all of Norway from 1999 to 2008, and 38.5% of the invited women consented to participate. The cohort now includes 4108,000 children and 90,700 mothers. Follow-up is conducted by questionnaires at regular intervals and by linkage to national health registries, among them the Medical Birth Registry of Norway.11 The study protocol was approved by The Regional Committee for Medical and Health Research Ethics in southeastern Norway. Informed consent was obtained from each MoBa participant upon recruitment. The current study is based on version 7 of the quality-assured data files released for research in June 2012. All women in the MoBa cohort study were asked to provide a set of biologic specimens in approximately the 17th week of pregnancy. For women in the reliability substudy of MoBa (n ¼ 671), sets of biologic specimens were also collected at weeks 23 and 29 of pregnancy from November 2007 to December 2008. The rationale for this substudy was to examine whether biomarker concentrations in the 17-week specimens were representative for the gestational period. Subjects in the reliability substudy were enrolled from four hospitals, each representing a different region of Norway (northwest (Sunnmøre Hospital HF Ålesund), southwest (Stavanger University Hospital HF), central (St Olavs Hospital HF) and eastern (Østfold Hospital HF Fredrikstad) Norway). The present study includes data from 45 women selected for TCS analysis from the MoBa reliability substudy. Fifteen women were included in this study because
1 Epidemiology Branch, National Institute of Environmental Health Sciences (NIEHS/NIH), Research Triangle Park, North Cardina, USA; 2Department of food, water and cosmetics, Norwegian Institute of Public Health, Oslo, Norway; 3Department of Epidemiology, Gillings School of Global Public Health, University of North Carolina, Chapel Hill, North Carolina, USA; 4Department of Public Health Sciences, University of Rochester School of Medicine and Dentistry, Rochester, New York, USA; 5Division of Laboratory Sciences, Centers for Disease Control and Prevention, Atlanta, Georgia, USA; 6Department of Genes and Environment, Norwegian Institute of Public Health, Oslo, Norway; 7Department of Childhood, Development and Cultural diversity, Norwegian Institute of Public Health, Oslo, Norway; 8Department of Genetics, Institute of Clinical Medicine, University of Oslo, Oslo, Norway and 9Environment and Mental Health, Norwegian Institute of Public Health, Oslo, Norway. Correspondence to: Dr Randi J Bertelsen, Department of food, water and cosmetics, Norwegian Institute of Public Health, N-0403 Oslo, Norway. Tel.: +47 99674046. Fax: +47 21076686. E-mail:
[email protected] Received 11 July 2013; revised 18 November 2013; accepted 19 November 2013; published online 29 January 2014
Triclosan reliability Bertelsen et al
518 Table 1.
Characteristics of women in the MoBa TCS reliability substudy by TCS concentration.
Characteristics
n (%)
Marital statusc Married Cohabitated Single Maternal educationc Less than high school High school Up to 4 years of college 44 years of college
Women (n) with Z1 sample with TCS4LOD
Geometric mean of mean TCS for all three samples (mg/l)a,b
Geometric mean of mean TCS for all three samples (mg/g creatinine)a,b
20 (46) 21 (49) 2 (5)
9 14 0
oLOD 4.5 oLOD
oLOD 4.6 oLOD
4 8 24 6
(10) (19) (57) (14)
0 4 14 4
oLOD oLOD 3.4 oLOD
oLOD oLOD 3.9 3.0
Maternal income (in 1000 Nok/year)c o150 7 (17) 150–300 11 (26) 300–400 17 (40) 4400 7 (17)
2 8 9 5
oLOD oLOD 4.0 4.3
oLOD 2.8 4.0 5.7
Parity Primiparous Multiparous
23 (51) 22 (49)
19 6
5.3 oLOD
5.8 oLOD
Smoking during pregnancyc None Sometimes Daily
38 (90) 2 (5) 2 (5)
20 2 0
oLOD 19.4 oLOD
2.5 16.9 oLOD
Maternal age at delivery, years o25 25–29 30–34 435
5 12 12 13
(11) (33) (27) (29)
1 10 8 6
oLOD 3.7 3.9 oLOD
oLOD 4.1 4.5 oLOD
Pre-pregnancy BMI, kg/m2c o20 20–24.9 25–29.9 Z30
7 25 6 4
(17) (60) (14) (9)
4 15 4 0
oLOD 2.7 3.8 oLOD
2.5 3.3 3.2 oLOD
oLOD indicates that the calculated GM concentration is below the LOD ¼ 2.3 mg/l. a No statistically significant difference between the groups (ANOVA P40.05). bGM calculations for the woman’s mean concentration based on her three urine sample. cInformation missing for maternal education (n ¼ 3), marital status (n ¼ 2), maternal income (n ¼ 3), smoking during pregnancy (n ¼ 3), and prepregnancy BMI (n ¼ 3).
a previous study had found evidence of high total bisphenol-A concentrations in at least one of their urine samples, and an additional 30 women were randomly sampled from the population of women in the reliability substudy. The 15 women with a previously measured high total bisphenol-A concentration had been initially selected at random from the reliability substudy. The high total bisphenol-A concentration was found to be caused by a urine preservative in the urine collection tubes.12 To replicate the collection and handling of MoBa samples, urine was transferred to a 8-mL BD vacutainers urinalysis preservative tube containing a mixture of chlorhexidine, ethyl paraben and sodium propionate (BD Diagnostics, Franklin Lakes, NJ, USA). Total and free TCS concentrations were measured by online solid phase extraction–high performance liquid chromatography–isotope dilution tandem mass spectrometry13 at the Centers for Disease Control and Prevention (CDC, Atlanta, GA, USA). The samples were processed by procedures adopted by CDC to avoid external contamination with TCS.14 The method limit of detection (LOD) was 2.3 mg/l. To account for differences in urinary analyte concentrations caused by urine dilution, the TCS concentration were divided by creatinine concentrations.15
Statistics We calculated Spearman’s rank correlation coefficient (rs) for TCS urinary concentrations between pairs of samples from week 17 and 23, week 23 and 29, and between week 17 and 29. We calculated the intraclass
correlation coefficient (ICC) statistics for the three pairs. The ICC is a measure of consistency or agreement of the same measurement within an individual. The ICC was calculated using a one-way random-effects model on natural log transformed TCS concentrations. For concentrations below the LOD, instead of imputed values we used the actual instrumental values.16 The Spearman’s rank correlation coefficients and the ICC statistics are presented for urinary TCS concentrations by uncorrected (mg/l) and creatinine-corrected (mg/creatinine) values. We also calculated the ICC among the subset of participants who had TCS concentrations below the method LOD in all three urine samples, to evaluate whether the instrumental values would provide any additional information compared with random values or substitution methods. All statistics were performed with Statistical Package for Social Sciences (SPSS version 19.0; SPSS Inc., Chicago, IL, USA).
RESULTS Approximately half of the 45 women in the present study were primiparous and 30 years or older at the time of delivery (Table 1). The majority of the pregnant women were married or lived with a partner (95%), had a college degree (71%), and had a prepregnancy body mass index (BMI) between 20 and 25 kg/m2 (60%) (Table 1).
Journal of Exposure Science and Environmental Epidemiology (2014), 517 – 521
& 2014 Nature America, Inc.
Triclosan reliability Bertelsen et al
519 Table 2.
Urinary TCS concentrations (ng/ml) reported in different studies obtained using the same laboratory and analytical method. Percentiles
a
Norwegian pregnant women Norwegian children New York City children Puerto Rican pregnant women NHANES 07–08 women (18–40 years) NHANES 09–10 women (18–40 years)
%4LOD
GM (95% CI)
50th
95th
Max
Reference
36 47 71.7 88.9 84.9 79.0
(oLOD) 2.4 13.6 29.9 (23.6, 37.9) 18.7 (14.7, 23.8) 16.9 (12.2, 23.4)
(oLOD) (oLOD) 8.5 26.2 14.0 13.0
387 444 477 944 520 577
970 3610 1040 2000 2780 2690
This work Bertelsen et al.3 Teitelbaum et al.5 Meeker et al.6 Meeker et al.6 Meeker et al.6
a
Includes TCS concentrations for three repeated samples per women (n ¼ 105 samples). (oLOD) for concentrations below the LOD ¼ 2.3 mg/l.
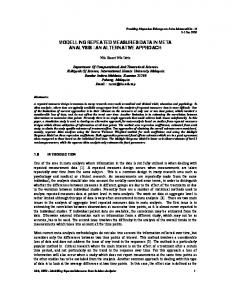
Figure 1. Pairwise Spearman correlation coefficient and ICC measures for triclosan concentrations among 45 pregnant women in the MoBa cohort study.
Overall, 36% of the urine samples (48/135) had detectable total TCS concentrations and 13% of the urines samples (18/135) had detectable free TCS concentrations. Given the low detection of free TCS, these results will not be discussed further. Fifty-six percent of the women had a least one urine sample with a detectable concentration and 27% had detectable TCS concentrations in all three urine samples. The number of women with at least one urine sample with detectable TCS concentrations, as well as the geometric mean of TCS showed some increase with higher maternal education and income (Table 1), but there was no statistically significant difference between the various categories. The geometric mean TCS concentration among women who reported smoking sometimes during pregnancy was higher than for the non-smokers and the daily smokers (Table 1), but the difference was mainly due to one woman with TCS concentrations above the 75th percentile at all three time points. The 95th percentile of TCS concentrations among the 135 urine specimens was 387 mg/l (Table 2) (329 mg/g creatinine). The correlation of creatinine-corrected TCS concentrations in gestational weeks 17 and 23 was rs ¼ 0.61, and the correlation for weeks 17 and 29 was rs ¼ 0.49 (Figure 1). For the three time points, the ICC was 0.49 (95% CI: 0.31, 0.65), indicating moderate reliability. For women with undetectable TCS concentrations in all three urine samples (n ¼ 20), the ICC was 0.22 (P ¼ 0.06) for the creatinine-corrected TCS. DISCUSSION The reliability of TCS concentrations in repeated urine samples from pregnant women was reasonably good (ICC ¼ 0.49). Despite the high proportion of participants with undetectable TCS & 2014 Nature America, Inc.
concentration in our study, the ICC is in line with results from a recent study of TCS reliability in urine samples from pregnant women in Puerto Rico (ICC ¼ 0.47),6 and with TCS measured in repeated first-morning urine samples from Danish men (ICC ¼ 0.56).17 Only 36% of the urine samples from this sample of pregnant Norwegian women had detectable TCS concentrations as compared with 89% of the pregnant women from Puerto Rico6 and 80% of the NHANES 2007–2008 study population (6 years and older)18 (Table 2). The 95th percentile (340 mg/l) was lower than the 95th percentile (571 mg/l) for women in NHANES 2007–20081 and considerably lower than the 944 mg/l among the pregnant women from Puerto Rico.6 In the present study, the number of women with at least one urine sample with detectable TCS concentrations, as well as the geometric mean of TCS was somewhat higher among women with higher maternal education and income, although none of these differences were statistically significant. In the NHANES study urinary TCS concentrations were reported to be highest during the third decade of life (20–30 years of age) and among those with the highest household income.19 Differences in detection frequencies are unlikely to be related to the analytical methodology. The between batch coefficient of variation for TCS at high concentration was 9.6% in the MoBa samples, very close to the reported coefficient of variation for the analyses of NHANES 2009–2010 samples (9.3% at B25 mg/l20), suggesting that instrumental performance unlikely impacted the TCS results, at least at the higher concentrations. Neither is our assessment method for urinary dilution likely to account for any differences in detection frequency. Although creatinine was used to account for urine dilution in the present study, a recently
Journal of Exposure Science and Environmental Epidemiology (2014), 517 – 521
Triclosan reliability Bertelsen et al
520 published paper reporting TCS in urine from pregnant women measured both creatinine and specific gravity, and found no difference in estimates of reliability regardless of the method used to account for urinary dilution.21 That said, one potential concern is the presence of a highly concentrated preservative mixture that was previously found to influence bisphenol-A concentrations measured in urine samples.12 Although we cannot exclude the possibility that the preservative may have negatively impacted the mass spectrometer performance as a whole, the lower detection frequency of TCS among these MoBa samples is more likely to reflect pattern of use rather than poor instrumental performance. Moreover, although field blanks were not collected for this study, the concentration of free TCS relative to the total TCS was low, suggesting little, if any, contamination of the specimens. The lower detection frequency and urinary concentrations of TCS among the Norwegian women are likely due to differences between countries in the regulations and recommended use of TCS-containing consumer products.7–9 We reported a much lower TCS detection frequency in urine from Norwegian 10-year-old children (47%)3 than what was reported by Teitelbaum et al.5 in a population of US minority children of similar age (71%) (Table 2). These studies report TCS concentrations measured using the same method and laboratory. In the EU, the production and use of TCS in consumer products has declined during the last decade,9 whereas there is little indication of a decline in TCS exposure in the US population—according to biomonitoring data from NHANES.18 In particular, owing to the concern about the emergence of antibiotic-resistant bacteria, the Norwegian authorities have encouraged retailers and consumers to avoid routine use of products declared as antibacterial since the year 2000.8 Body burden of TCS is probably influenced most by an individual’s use of TCS-containing products. The same brands of cosmetics and dental products are often used over an extended period of time, and thus, despite the short half-life, a single urine measure of TCS may be informative about longer term average exposure, for example, over the course of a pregnancy, due to consistent patterns of product usage. Compared with nonpersistent chemicals for which the main route of exposure is diet, the relative repeatability of urinary concentrations of the antibacterial agent TCS among pregnant women suggest that the concentrations of TCS in a single-spot urine sample may be adequate to categorize exposure to TCS during pregnancy. In particular, the ICC for TCS was one of the highest ICCs among 19 urinary biomarkers evaluated for the US children,5 and also comparable with the ICC for chemicals from other personal care products (e.g. parabens, benzophenone-3) in the women from Puerto Rico.6 The ICC of 0.22 for the concentrations below the method LOD suggests that the instrumental values do provide data that is not completely random. Using the actual instrumental values for concentrations below the LOD is at least as good as any other solution and may be the best approach.16 Use of substitution methods such as LOD/O2 can result in an underestimate of correlation among measures,22 but in this case lowered the ICC only slightly, to 0.48. Despite the much higher proportion of participants with undetectable TCS concentrations in our study as compared with other studies—which is likely to be due to patterns of use and regulation of TCS-containing products in Norway—the ICC of 0.49 among the pregnant Norwegian women was similar to the ICC (0.47) among Puerto Rican pregnant women.6 Although we cannot exclude the possibility that pregnancy influences the metabolism of TCS, the reliability of TCS urinary concentrations in repeated samples from pregnant women in Norway was reasonably good, suggesting that a single urine sample may be adequate in representing TCS exposure during pregnancy.
CONFLICT OF INTEREST The authors declare no conflict of interest.
ACKNOWLEDGEMENTS The Norwegian Mother and Child Cohort Study is supported by the Norwegian Ministry of Health and the Ministry of Education and Research, NIH/NIEHS (contract no N01-ES-75558), NIH/NINDS (grant no. 1 UO1 NS 047537-01), and the Norwegian Research Council/FUGE (grant no. 151918/S10). This study was supported in part by the grants from the National Institute of Environmental Health Sciences (P30ES010126, R01-ES021777, and K12-ES019852), the Intramural Research Program of the National Institute of Health (NIH), National Institute of Environmental Health Sciences (NIEHS). The involvement of the CDC was determined not to constitute engagement in human subject research. Human subjects committees at NIEHS and at the University of North Carolina also approved this study protocol. We acknowledge X. Ye, X. Zhou, J. Kramer, and T. Jia (CDC) for technical assistance in measuring TCS. We are grateful to all the participating families in Norway who take part in this ongoing cohort study. The findings and conclusions in this report are those of the authors and do not necessarily represent the views of the CDC.
REFERENCES 1 CDC. Fourth National Report on Human Exposure to Environmental Chemicals. Department of Health and Human Services. Centers for Disease Control and Prevention: Atlanta, 2009. 2 Sandborgh-Englund G, Adolfsson-Erici M, Odham G, Ekstrand J. Pharmacokinetics of triclosan following oral ingestion in humans. J Toxicol Environ Health A 2006; 69: 1861–1873. 3 Bertelsen RJ, Longnecker MP, Lovik M, Calafat AM, Carlsen KH, London SJ et al. Triclosan exposure and allergic sensitization in Norwegian children. Allergy 2013; 68: 84–91. 4 Savage JH, Matsui EC, Wood RA, Keet CA. Urinary levels of triclosan and parabens are associated with aeroallergen and food sensitization. J Allergy Clin Immunol 2012; 130: 453–460. 5 Teitelbaum SL, Britton JA, Calafat AM, Ye X, Silva MJ, Reidy JA et al. Temporal variability in urinary concentrations of phthalate metabolites, phytoestrogens and phenols among minority children in the United States. Env Res 2008; 106: 257–269. 6 Meeker JD, Cantonwine DE, Rivera-Gonzalez LO, Ferguson KK, Mukherjee B, Calafat AM et al. Distribution, variability, and predictors of urinary concentrations of phenols and parabens among pregnant women in Puerto Rico. Environ Sci Technol 2013; 47: 3439–3447. 7 Administration FUSFaD. Triclosan: What Consumers Should Know. 2012. 8 Eide AM. Analyse av triklosan i kosmetiske produkter. The Norwegian Food Control Authority: Oslo, 2003. 9 Scientific Committee on Consumer Safety. SCCS. Opinion on Triclosan Antimicrobial Resistance. The European Commission, 2010. Available from http:// ec.europa.eu/health/scientific_committees/consumer_safety/docs/sccs_o_023.pdf. Accessed 18 November 2013. 10 Magnus P, Irgens LM, Haug K, Nystad W, Skjaerven R, Stoltenberg C. Cohort profile: the Norwegian Mother and Child Cohort Study (MoBa). Int J Epidemiol 2006; 35: 1146–1150. 11 Irgens LM. The Medical Birth Registry of Norway. Epidemiological research and surveillance throughout 30 years. Acta Obstet Gynecol Scand 2000; 79: 435–439. 12 Longnecker MP, Harbak K, Kissling GE, Hoppin JA, Eggesbo M, Jusko TA et al. The concentration of bisphenol A in urine is affected by specimen collection, a preservative, and handling. Env Res 2013; 126: 211–214. 13 Ye X, Kuklenyik Z, Needham LL, Calafat AM. Automated on-line column-switching HPLC-MS/MS method with peak focusing for the determination of nine environmental phenols in urine. Anal Chem 2005; 77: 5407–5413. 14 Ye X, Zhou X, Hennings R, Kramer J, Calafat AM. Potential external contamination with bisphenol A and other ubiquitous organic environmental chemicals during biomonitoring analysis: an elusive laboratory challenge. Environ Health Perspect 2013; 121: 283–286. 15 Barr DB, Wilder LC, Caudill SP, Gonzalez AJ, Needham LL, Pirkle JL. Urinary creatinine concentrations in the U.S. population: implications for urinary biologic monitoring measurements. Environ Health Perspect 2005; 113: 192–200. 16 Committee AM. Measurement of near zero concentration: recording and reporting results that fall close to or below the detection limit. Analyst 2001; 126: 256–259. 17 Lassen TH, Frederiksen H, Jensen TK, Petersen JH, Main KM, Skakkebaek NE et al. Temporal variability in urinary excretion of bisphenol A and seven other phenols in spot, morning, and 24-h urine samples. Environ Res 2013; 126: 164–170.
Journal of Exposure Science and Environmental Epidemiology (2014), 517 – 521
& 2014 Nature America, Inc.
Triclosan reliability Bertelsen et al
521 18 CDC. National Health and Nutrition Examination Survey 2007-2008 Data Documentation, Codebook, and Frequencies, Environmental Phenols (EPH_E) 2010. 19 Calafat AM, Ye X, Wong LY, Reidy JA, Needham LL. Urinary concentrations of triclosan in the U.S. population: 2003-2004. Environ Health Perspect 2008; 116: 303–307. 20 CDC. Laboratory Procedure Manual, 2011. Available from http://www.cdc.gov/ nchs/data/nhanes/nhanes_09_10/EPH_F_met_phenols_parabens.pdf. Accessed 18 November 2013.
& 2014 Nature America, Inc.
21 Philippat C, Wolff MS, Calafat AM, Ye X, Bausell R, Meadows M et al. Prenatal exposure to environmental phenols: concentrations in amniotic fluid and variability in urinary concentrations during pregnancy. Environ Health Perspect 2013; 121: 1225–1231. 22 Nie L, Chu H, Liu C, Cole SR, Vexler A, Schisterman EF. Linear regression with an independent variable subject to a detection limit. Epidemiology 2010; 21(Suppl 4): S17–S24.
Journal of Exposure Science and Environmental Epidemiology (2014), 517 – 521