[Channels 3:3, 149-155; May/June 2009]; ©2009 Landes Bioscience Reliability of rebound bursts in deep cerebellum
Article Addendum
Reliability of triggering postinhibitory rebound bursts in deep cerebellar neurons Reza Tadayonnejad, W. Hamish Mehaffey, Dustin Anderson and Ray W. Turner* Hotchkiss Brain Institute; University of Calgary; Calgary AB CA
Abbreviations: aCSF, artificial cerebrospinal fluid; DCN, Deep cerebellar nuclear; DL-AP5, dl-2-amino-5-phosphonopentanoic acid; DNQX, 6,7-dinitroquinoxolinedione; ECl, chloride equilibrium potential; EPSP, excitatory postsynaptic potential; FSL, first spike latency; GABA, gamma aminobutyric acid; GABAA, GABA-A receptors; HEPES, 4-(2-hydroxyethyl)-1-piperazineethanesulfonic acid; IPSP, inhibitory postsynaptic potential; IPSC, inhibitory postsynaptic current; ISI, interspike interval; K-Gluc, potassium gluconate; LVA, low voltage activated; mGluR, metabotropic glutamate receptor Key words: deep cerebellum, rebound burst, T-type calcium channel, first spike latency
Deep cerebellar nuclear (DCN) neurons exhibit distinct phenotypes of rebound discharge following current-evoked membrane hyperpolarizations that arise from specific CaV3 T-type Ca2+ channel isoforms and Ca2+-activated K+ channels. The probability of evoking rebound bursts following a brief train of GABAergic inhibitory synaptic input from cerebellar Purkinje cells was recently questioned for stimulus intensities adjusted to evoke a long post-stimulus pause in spike firing. We revisited this issue to examine the potential for generating rebound bursts in DCN cells in response to synaptic inputs in vitro. Both a Transient and Weak Burst phenotype could be distinguished in on-cell extracellular recordings or whole-cell recordings in response to inhibitory synaptic input. We found that the rebound burst response was a sensitive function of stimulus intensity, such that increasing stimulus intensity significantly raised the probability for evoking bursts while decreasing pause duration. The threshold for reliably generating rebound bursts was ~40 percent of maximum intensity, a level that evokes an IPSC corresponding to only a small number of the inhibitory terminals known to impinge on DCN cells. The probability for evoking rebound bursts is thus very high for moderate levels of stimulation in vitro, leaving the potential for rebound discharge to contribute to signal processing in vivo an open question. *Correspondence to: Ray W. Turner; Department of Cell Biology and Anatomy; Hotchkiss Brain Institute; University of Calgary; 3330 Hospital Dr. N.W.; Calgary, AB T2N 4N1 CA; Email:
[email protected] Submitted: 4/28/09; Accepted: 04/29/09 Previously published online as a Channels E-publication: www.landesbioscience.com/journals/channels/article/8872 Addendum to: Molineux ML, Mehaffey WH, Tadayonnejad R, Anderson D, Tennent AF, Turner RW. Ionic factors governing rebound burst phenotype in rat deep cerebellar neurons. J Neurophysiol 2008; 100:2684–701; PMID: 18768644; DOI: 10.1152/jn.90427.2008.
www.landesbioscience.com
Introduction Deep cerebellar nuclear (DCN) neurons were among the first to be shown to generate rebound bursts following membrane hyperpolarizations,1,2 which are now incorporated into several models of cerebellar function. Rebound bursts are typically evoked in vitro using step membrane hyperpolarizations through direct current injection at the soma,1,3-5 although similar bursts have been reported following synaptic inhibition.2,5-7 We recently examined the properties and ionic basis for rebound burst discharge in DCN cells in vitro in relation to current-evoked membrane hyperpolarizations.4,8 T-type Ca2+ channels of the CaV3 family have long been known to participate in rebound bursts in DCN cells.5,9-11 These channels exhibit significant inactivation during the tonic spike activity found at rest in these cells, with membrane hyperpolarizations serving to make CaV3 channels available again for activation upon release from hyperpolarization. We found a striking correlation between the expression patterns of two CaV3 T-type Ca2+ channel isoforms and the generation of distinct phenotypes of rebound bursts in large diameter cells. One cell type that expresses CaV3.1 protein generates high frequency “Transient Bursts” of up to 450 Hz, while a second “Weak Burst” group expressing CaV3.3 channels responds to the same magnitude of membrane hyperpolarization with less than 140 Hz rebound frequency.8 We showed that the two burst phenotypes are shaped by a differential activation of inward T-type Ca2+ current and the degree of functional coupling between Ca2+ channels and outward Ca2+-activated K+ channels.4 Altogether it is clear that specific patterns of ion channel expression and their interactions are key to generating the intrinsic membrane properties that underlie Transient and Weak Burst phenotypes, at least in relation to current-evoked membrane hyperpolarizations. An important consideration is the extent to which these two phenotypes can be activated by the extensive GABAergic inhibitory synaptic input from Purkinje cells of cerebellar cortex. In this regard, Alvina et al.12 recently used a combination of recordings
Channels
149
Reliability of rebound bursts in deep cerebellum
in the in vitro slice preparation and unit recordings in vivo to examine the ability for synaptic inhibitory inputs to evoke rebound bursts. They found that only a small percentage of DCN cells (15%) were able to generate a rebound burst in response to a 10-pulse, 100 Hz stimulus to Purkinje cell axons in vitro, with an even lower rate of occurrence detected in vivo. Based on their data the authors raised questions regarding the likelihood of DCN cell rebound contributing to cerebellar output. This is an important issue in cerebellar physiology and one that has not been substantially addressed. We therefore extended our previous analyses of Transient and Weak Burst cells to determine the probability for detecting rebound increases in firing rate in relation to inhibitory synaptic activation.
Results Defining rebound bursts. Transient and Weak Burst phenotypes are readily identified in wholecell recordings using direct current injection.4,8 In keeping with the study of Alvina et al.12 we relied extensively on extracellular recordings to avoid Figure 1. Distinguishing Transient and Weak Burst phenotypes during synaptic stimulation. altering cytosolic contents to determine if these Inhibition was evoked by stimulating Purkinje cell axonal inputs with 10 pulses at 100 Hz and 60-70% of the intensity that evoked a maximal IPSC (whole-cell recordings) or rebound phenotypes could be distinguished following frequency (extracellular unit recordings). (A) Representative plots of statistically defined synaptic stimulation, but compared them to rebound bursts evoked by a train of inhibitory stimuli during sequential on-cell then whole-cell established properties of whole-cell recordings. recordings in single Transient and Weak Burst cells. The time of the stimulus train is denoted There are two important considerations when by gray bars and Time 0 marks the resumption of spike firing. Note that rebound bursts are examining rebound burst generation, in partic- equivalent for either recording mode. (B) Histogram plots of rebound burst frequencies evoked by inhibitory synaptic input for whole-cell recordings (white) and separate single unit recordular when using extracellular recordings and ings (red) (bin width 20 Hz). Burst phenotypes were identified in whole-cell recordings using synaptic stimulation. current pulses (500 ms, -80 mV). Weak Burst cells generate rebound bursts between 12–27 First, it is necessary to establish criteria that will Hz above baseline frequency and Transient Burst cells from 34-147 Hz. A very similar distriobjectively identify whether a cell has generated a bution of burst frequencies and proportion of cells exhibiting bursts below 30 Hz are found rebound burst beyond the level of preceding tonic in on-cell unit recordings. Burst frequencies in (B) are plotted as the increase above baseline tonic firing frequency activity. Investigations to date have relied on relatively subjective measures, such as the presence of Second, it is necessary to establish criteria for setting stimulus a transient burst component or a predefined increase in firing rate over the pre-stimulus baseline. To establish a statistical measure we intensity to compare between recording modes and single cells defined rebound bursts according to an increase in post-stimulus recorded in different slice preparations. Unless otherwise indicated, firing rate exceeding twice the standard deviation of the tonic firing stimulus intensity was set to a level ~60–70% of that required to rate for 1 sec preceding the hyperpolarization. Because DCN cells evoke a maximal IPSC during whole-cell recordings. Using this fire tonically with great regularity, this test allows us to observe parameter we found equivalent IPSCs for Transient and Weak even small increases in firing rate over time. Using these criteria Burst cells, evoked with amplitudes of 221 ± 27.4 pA (n = 5) for the increases in firing frequency were much longer (up to 3 secs) Transient Burst cells and 213 ± 34.2 pA (n = 7) for Weak Burst than the initial 100 ms we previously used to define burst pheno- cells. For unit recordings stimulus intensity was increased until types, but not significantly different between Transient and Weak no further increase in rebound frequency was observed, and then Burst cells (Fig. 1A and Table 1). However, the maximum rebound intensity reduced to ~60–70% of the maximum value. To compare frequency still occurred within ~100 ms following hyperpolariza- this intensity to that used for whole-cell recordings we obtained a tions and differed as predicted for Transient vs Weak Burst cells series of sequential on-cell followed by whole-cell recordings, and (Fig. 1A).4,8 A similar long time frame for rebound increases in found that this intensity criteria evoked a comparable IPSC of 214 frequency was reported by Usisaari et al.,13 who referred to this ± 27 pA (n = 12 combined Transient and Weak Burst recordings). To further ensure that the activity of DCN cells was similar extended time in terms of the rate of spike accommodation. We chose to include the entire duration of the elevated period of firing between on-cell recording and whole-cell recording modes we compared several baseline firing characteristics. We found that as part of the rebound burst response. 150
Channels
2009; Vol. 3 Issue 3
Reliability of rebound bursts in deep cerebellum
Table 1
Rebound burst properties in whole-cell and on-cell recordings of large diameter DCN neurons
Tonic Freq. (Hz)
Transient Burst Rebound Freq. Rebound Duration Tonic Freq. (Hz) (s) (Hz)
Weak Burst Rebound Freq. (Hz)
Rebound Duration (s)
On-cell (aCSF)
17.8 ± 3.02 (16)
73.8 ± 9.58
2.5 ± 0.32
18.6 ± 1.8 (12)
13.57 ± 1.95
2.4 ± 0.41
On-cell (K-Gluc.)
18.4 ± 3.13 (5)
69.7 ± 8.83
2.2 ± 0.45
19.2 ± 4.0 (7)
12.3 ± 1.23
2.2 ± 0.45
Whole-cell (K-Gluc.)
17.6 ± 2.16 (5)
58.6 ± 7.83
2.3 ± 0.47
17.8 ± 3.24 (7)
11.7 ± 1.17
2.5 ± 0.43
Mean values of spike output under resting conditions and during rebound bursts following a 100 Hz, 10 stimulus train of Purkinje cell inputs (60–70% of maximal intensity). Rebound burst frequencies reflect the maximum frequency attained beyond baseline tonic firing rates and rebound duration the time required for spike firing to fall back within two standard deviations of the mean of baseline tonic firing. No significant differences were detected between on-cell or whole-cell recordings for tonic or rebound burst properties. Whole-cell recordings were made without applied current. aCSF, artificial cerebrospinal fluid, K-Gluc., potassium gluconate. n values are shown in parentheses.
resting tonic firing frequencies and synaptically evoked rebound burst frequencies (100 Hz, 10 stimuli, 60–70% of maximum intensity) were not statistically different between extracellular unit recordings made with HEPES-aCSF or K-gluconate based electrolyte (Table 1). We also found no difference between these on-cell values and those in the subset of cells in which whole-cell configuration was subsequently formed (n = 12; Table 1). For comparison, when maximum AHP depth was adjusted to ~-61 mV with current injection the mean tonic firing frequency was: Transient Burst cells 13.2 ± 1.27 Hz (n = 24), Weak Burst cells 12.7 ± 1.39 Hz (n = 16). The similarity between on-cell and whole-cell recorded data is particularly apparent on a plot of rebound frequency superimposed in Figure 1A. It is thus clear that data obtained with wholecell recordings using the electrolyte indicated here are entirely equivalent to those obtained with extracellular unit recordings. Nevertheless, the majority of recordings in the present study were collected in the on-cell extracellular recording mode to facilitate eventual comparisons to in vivo recordings. Distinguishing Transient and Weak Burst cells during synaptic stimulation. Figure 1 plots the rebound frequencies evoked in Transient and Weak Burst cells (identified through current injection during whole-cell recordings) by a 10 pulse, 100 Hz stimulus train delivered to Purkinje cell axons (n = 40). Following inhibitory synaptic input Weak Burst cells discharged at peak rebound frequencies 12–27 Hz beyond their initial tonic firing rate (n = 14) and Transient Burst cells over a wider and higher frequency range of 34–147 Hz (n = 26). These frequencies were lower than those typically encountered with direct membrane hyperpolarizations although Transient and Weak Burst cells still differed substantially (~5X) in maximum burst frequency for the same synaptic stimulus (Fig. 1B and Table 1). These data indicate that statistically definable bursts can be recorded in both Transient and Weak Burst phenotypes during whole-cell recordings following repetitive synaptic stimulation. As indicated above, comparisons of IPSC amplitudes between Transient and Weak Burst cells reveal that these differences do not derive from the relative level of inhibition, or the baseline rate of tonic firing. We repeated these tests in a separate set of on-cell unit recordings to determine if these differences could be distinguished (n = 41). Here we found a very similar distribution of rebound frequency increases for unit recordings in response to the same stimulus train (Fig. 1B). Moreover, a similar percentage of the population exhibited rebound frequency increases of less than www.landesbioscience.com
30 Hz above baseline (Fig. 1B), suggesting that rebound frequencies can be used to distinguish burst phenotypes under either recording configuration. Sequential on-cell followed by whole-cell recordings using K-gluconate electrolyte confirmed that burst phenotypes were correctly assigned when applying this distinction to on-cell recordings (n = 12). By comparison, we found that the mean duration of rebound bursts did not differ between Transient and Weak Burst cells in either whole-cell or single unit recording modes (Table 1). We thus used rebound frequencies of less than 30 Hz above baseline firing rate as one criterion for distinguishing Weak Burst phenotypes in on-cell unit recordings. In some cases Transient Burst cells were further identified by the appearance of an initial high frequency component to the rebound burst. The probability of evoking rebound bursts. We next examined the probability of recording synaptically evoked rebound bursts. Alvina et al.12 stimulated Purkinje cell axons within the DCN nuclei and close to the recorded cell with 10 stimuli at 100 Hz. Stimulus intensity was set to evoke a long duration pause in firing (199 ± 9.1 ms including the 100 ms of stimulation) as an indication of substantial inhibition. Using these parameters they indicated a low probability of recording rebound bursts. We stimulated the white matter from a location just dorsal to the DCN (and outside of the nucleus) to avoid any potential activation of interneuron axonal arbors within the nucleus. Using this stimulus location we also found that if we set stimulus intensity to activate long poststimulus pauses in firing (up to 136 ms, not including stimulus duration), rebound bursts were often not evoked. However, we also found that a modest increase in stimulus intensity was able to recruit bursts with much higher probability and a shorter duration pause, potentially giving the impression that inhibition was weaker for stronger stimulus intensities. We thus reexamined rebound responses in relation to the subsequent pause in firing for Transient Burst and Weak Burst cells following inhibitory synaptic input. One consideration is that a pause in spike firing must be measured in relation to the interspike interval (ISI) of tonic firing preceding the stimulus. The use of the term “pause” can also create confusion given its common use in referring to the pause following climbing fiber activation in cerebellar cortical literature. We thus refer to the pause to fire a spike following a stimulus train as a measure of “first spike latency” (FSL). Since FSL can depend on baseline firing rates, we express FSL in relation to the mean ISI (FSL/ISI) during the tonic activity (1 sec) preceding the stimulus.
Channels
151
Reliability of rebound bursts in deep cerebellum
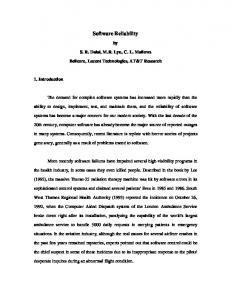
Figure 2. Rebound bursts and post-stimulus first spike latency are sensitive functions of stimulus intensity. (A) Representative traces of rebound spike responses in separate Transient Burst cells following a train of evoked IPSPs (10 pulses, 100 Hz, 20% and 100% intensity) in (i) on-cell recordings or (ii) whole-cell recordings, and (iii) in response to a current-evoked hyperpolarization in a whole-cell recording. Higher intensity synaptic activation, or an increase in hyperpolarization (red traces), evoke a higher rebound spike frequency and shorter post-stimulus FSL (dashed lines). (B) Plots of rebound frequency and the FSL/ISI ratio in extracellular unit recordings in response to increasing stimulus intensity of inhibitory input (10 pulses, 100 Hz; n = 16 Transient, n = 12 Weak Burst cells). Dashed lines indicate a failure of approximately half of the units (in brackets) to exhibit a rebound burst at 20% of maximal intensity, and an associated sharp increase in FSL. Stimulus artifacts and spike amplitudes were truncated in (A). Burst frequencies are plotted as the increase above baseline tonic firing frequency.
A value of less than 1 thus indicates a decrease in FSL in relation to the original tonic firing rate. We found that increasing the intensity of synaptic stimulation or membrane hyperpolarization produced a graded decrease in the latency before the cell resumed spiking. This property was apparent with synaptically evoked inhibition for both on-cell recordings (n = 28) and whole-cell recordings (Fig. 2A and B) (n = 19). We then tested this in whole-cell configuration and confirmed that weak hyperpolarizations gave a long FSL while stronger current pulses shortened the FSL (n = 40) (Fig. 2A). As a result, we find that a stimulus intensity chosen to maximize post-stimulus FSL represents the lowest intensity that will inhibit the cell sufficiently to stop firing during a stimulus train. For our weakest stimulus intensity (20% of maximum) approximately half of the cells failed to show a rebound increase in frequency, at which point FSL also sharply increased (Fig. 2B). Thus at 20% intensity the FSL ranged from 17–57 ms (Transient Burst 40.8 ± 5.8 ms; n = 11; Weak Burst 38.8 ± 5.17 ms; n = 8) and up to 59 ms for those cases that failed to generate a burst (Transient Burst 52.8 ± 3.8 ms; n = 5; Weak Burst 51.2 ± 5.06 ms; n = 4) (Fig. 2B). We note that even small increases in stimulus intensity to 40% or more of maximum intensity shortened FSL and consistently evoked rebound bursts 152
in all cells (Fig. 2B). As stimulus intensity was increased the ability to evoke rebound bursts of higher frequency increased in both Transient and Weak Burst cells. IPSP amplitude is correlated to FSL. It became apparent that the membrane potential during repetitive stimulation at 100 Hz for different stimulus intensities appeared to stabilize (presumed ECl) relatively early on during the stimulus train (Fig. 2A). This could provide the impression that the net inhibition evoked by the different intensities used here was fairly similar, or even that additional factors beyond GABA receptor activation might contribute to generating rebound responses. However, we confirmed that activating synaptic inputs (mossy fiber/climbing fiber) in the presence of picrotoxin to block Cl- channels (see Materials and Methods) produced no rebound increase in firing following a 10 pulse 100 Hz stimulus train (Fig. 3A). Thus the rebounds we observed, even at the highest stimulation intensities, are GABAA receptor mediated, rather than through metabotropic receptors (i.e., mGluRs) or other synaptic inputs (i.e., aminergic) that might be activated from our stimulation sites. In further considering the effects of increasing stimulus intensity, we noted that threshold levels of stimulation evoked a rather large IPSP (4.5–10 mV) (Fig. 2A). This is in keeping with
Channels
2009; Vol. 3 Issue 3
Reliability of rebound bursts in deep cerebellum
established physiological evidence for multiple release sites on synaptic terminals of Purkinje cell axons and a widespread activation of GABA receptors that offsets synaptic depression during high frequency input.14-16 Although smaller amplitude IPSPs have been reported in DCN cells, they were attributed to potential activation of local recurrent inhibitory projections within the nucleus.16 Our stimulation site outside of the nucleus is expected to avoid this problem. We then more closely examined the relationship between stimulus intensity, IPSP amplitude, and FSL. We found that an increase in stimulus intensity was always associated with a measurable and similar change in IPSP amplitude for both Weak and Transient Burst cells, as shown for 19 different cases in Figure 3B. A plot of IPSP amplitude against the corresponding FSL/ ISI ratio for each record further revealed a strong correlation, indicating that FSL is tightly linked to the amplitude of the initial IPSP in an afferent spike train (Fig. 3B). We can thus conclude that our stimulus intensities progressively increased the strength of synaptic inhibition in a manner that closely reflects a change in FSL and the probability of obtaining rebound bursts.
Discussion The cellular properties that underlie rebound discharge and spike output in DCN cells have been examined in several studies using in vitro slice preparations.1,4,5,8-10,12,13 Some evidence exists for the generation of rebound-like bursts in vivo following periods of reduced firing of DCN cells (including presumed Purkinje cellevoked inhibition) or rebound responses in motor control.17-21 Yet the potential for intrinsic Figure 3. (A) Rebound burst responses are GABAA receptor-dependent. Shown are recordings membrane properties of the type assessed in of a train of EPSPs evoked in a representative Weak Burst cell in the presence of picrotoxin vitro to generate rebound bursts in response to using a 10 pulse 100 Hz stimulus train (stimulation shown by grey bars). A plot of mean spike Purkinje cell inhibitory input has not been exten- frequency before and after delivering the EPSP stimulus train shows no evidence for a rebound increase in firing frequency (bin width 200 ms). Average values reflect the combined results for sively studied. Identifying synaptically evoked rebound Transient Burst (n = 5) and Weak Burst cells (n = 4). The period of stimulation is denoted by a grey bar. The frequency change evoked during the stimulus is not plotted, and Time 0 corbursts. The present study demonstrates that responds to the end of the stimulus train. (B) IPSP amplitude and first spike latency are highly rebound bursts are readily evoked in large diam- correlated in Transient (n = 10) and Weak Burst (n = 9) cells. Plots illustrate the amplitude of eter DCN cells following activation of Purkinje the initial IPSP (top row) evoked in a 10 pulse 100 Hz stimulus train over a range of intensicell axonal inputs with a 10 pulse, 100 Hz ties and normalized to the 20% level. Individual cases are shown superimposed. Plots of FSL stimulus train in vitro. Furthermore, we were able vs initial IPSP amplitude (bottom row) for the cases shown above reveal a strong correlation between the initial strength of inhibition and the FSL following the stimulus train. to discriminate the activity of two phenotypes of rebound inherent to DCN cells using a statistical definition of rebound bursts. These differences were apparent not or Weak Burst phenotype in the Interpositus nucleus. These results only in whole-cell recordings, but also in on-cell recordings of unit are also important in demonstrating that DCN cells maintained activity in which cytosolic contents are not disrupted. Indeed, in vitro under our conditions establish a resting potential and Cldata recorded in on-cell or whole-cell modes were not statistically reversal potential that is sufficient to allow synaptic inhibition to different in any respect. We could thus use rebound spike frequency shift the membrane potential past burst threshold. Since this work in on-cell recordings to reliably identify the output of a Transient was conducted in a slice preparation, the results pertain only to the www.landesbioscience.com
Channels
153
Reliability of rebound bursts in deep cerebellum
Purkinje cell axons stimulated dorsal to the DCN nucleus, with no involvement of Purkinje cell activity or cerebellar cortical neurons, as they are disconnected in the preparation of slices. The rebound response evoked under these conditions was entirely dependent on picrotoxin-sensitive (Cl--mediated) GABAergic inhibition, and not the result of activating any glutamatergic or other modulatory inputs. Previous work has also shown that rebound bursts can be recorded beyond the P12–P18 period tested here as currentevoked rebounds have been recorded in animals up to six months of age.22 The generation of rebound bursts is thus not confined to periods of earlier stages of development. The one key difference with previous work is that the maximal frequency of synaptically evoked rebound bursts we record is lower than that reported using large current injections (as reported in ref. 12). This is not entirely unexpected given the relative magnitude of membrane hyperpolarizations applied in either case, and we found that the differences in burst frequency between Transient and Weak burst cells were still apparent following synaptic activation. The data presented here thus establish that several facets of rebound burst discharge established in previous studies employing current injection are reproduced with inhibitory synaptic activation. Probability of evoking rebound bursts. An important issue in cerebellar physiology is the extent to which physiological levels of synaptic input can evoke rebound bursts in DCN cells. A recent study reported a very low probability when using a stimulus intensity set to evoke a long post-stimulus pause (FSL) in spike firing.12 We found that the probability of evoking rebound bursts, and the associated FSL after the stimulus train, was highly sensitive to the intensity of stimulation and the amplitude of the evoked IPSP. We were able to obtain consistent rebound responses in all cells using stimuli set to ~40% of maximum, corresponding to an IPSC of 183 ± 24.2 pA (n = 11). Importantly, a previous estimate of the IPSC amplitude associated with presumed single axon input to DCN cells when recorded under similar conditions was between 50–100 pA.23 Our threshold for reliably evoking bursts at 40% stimulus intensity should then correspond to the synchronous activation of only a small number of Purkinje cell inputs. This is likely a conservative estimate, but it indicates that our stimulation paradigms are well within the range expected to activate a reasonable number of the hundreds of Purkinje cell axon projections onto DCN cells from cerebellar cortex.24,25 Thus we find that rebound bursts are evoked in vitro with high probability using physiological levels of inhibitory activation. Inhibitory synaptic activation of rebound bursts. It was previously reported that delivering inhibitory stimulus trains produced a frequency-dependent depression of the IPSP that resulted in different tonic levels of membrane hyperpolarization.23 We also found this for different stimulus intensities at 100 Hz, but with an apparent common stabilization of membrane potential at the presumed ECl (Fig. 2A). Despite this, rebound discharge intensity continued to increase with stimulus intensity. One explanation for this is an increased activation of inhibitory inputs terminating in dendritic locations of DCN cells, where a substantial number of synaptic terminals are attributed to Purkinje cell input.25,26 Ca2+ imaging has also shown that step commands delivered at the soma invoke a significant portion of LVA-mediated Ca2+ current in 154
proximal dendrites.11,27,28 Indeed, membrane hyperpolarizations at the soma were instead found to be associated with a decrease in internal Ca2+ levels during and shortly after the end of a hyperpolarizing pulse.28 Each of these results suggest that much of the Ca2+ -mediated rebound depolarization is actually generated at dendritic locations. In this respect, Aizenman and Linden 5 found that synaptic inhibition was more effective than somatic current injection at recruiting a rebound burst even when the resulting somatic hyperpolarizations were identical, emphasizing the potential importance of dendritic inhibitory inputs. It has been shown that DCN cells are electrically compact enough for step hyperpolarizations at the soma to control the state of inactivation of LVA Ca2+ channels involved in rebound generation.28 However, membrane filtering during electronic conduction of the synaptic voltage response to the soma may decrease the ability to detect differences in the amplitude of IPSPs generated in dendrites.29 It was further shown that release of GABA at multiple sites from Purkinje cell terminals leads to rapid spillover and potential activation of GABA receptors up to 700 nm away.15 Spillover and diffusion will extend the region of membrane brought under the hyperpolarizing influence of GABA receptor activation and thus the extent of T-type Ca2+ channel recovery from inactivation. The relatively constant hyperpolarization we observe during repetitive stimulation is then predicted from the characteristics of GABA release from Purkinje cell presynaptic terminals. Each of these factors will influence the ability for an inhibitory synaptic input to generate rebound discharge regardless of the apparent state of hyperpolarization recorded at the soma. We thus expect that increasing stimulus intensity acts to synchronously activate more Purkinje cell axons (including those that terminate at dendritic sites), promoting a larger local IPSP and recovery of Ca2+ channels from inactivation, thereby establishing the conditions required for the generation of a rebound burst. In summary, the available data indicates that rebound bursts can invariably be recruited in DCN cells in vitro with moderate levels of inhibition, and to exhibit many of the salient properties of rebound discharge delineated in previous studies. Although rebound increases in DCN cell firing rate have been reported in vivo, the correspondence of these to intrinsic rebound burst mechanisms has not been fully established. Thus the factors that recruit rebound bursts in DCN cells under in vivo conditions remain to be identified.
Materials and Methods In vitro slice preparation. All tests were conducted on P12-P18 male Sprague-Dawley rats (Charles River Canada) maintained according to the Canadian Council for Animal Care. Parasagittal cerebellar slices of 250 µm thickness were maintained for recordings at 32–34°C (as in ref. 8). Recordings focused on large diameter cells in the Interpositus nucleus identified visually through differential interference contrast optics and infrared illumination. External aCSF contained (in mM): 125 NaCl, 3.25 KCl, 1.5 CaCl2, 1.5 MgCl2, 25 NaHCO3 and 25 D-glucose, pH 7.4. Recordings. The internal electrolyte for whole-cell recordings was (in mM): 130 K-gluconate, 0.1 EGTA, 10 HEPES, 7 NaCl, 0.3 MgCl2, with 5 di-tris-creatine phosphate, 2 Tris-ATP and 0.5
Channels
2009; Vol. 3 Issue 3
Reliability of rebound bursts in deep cerebellum
Na-GTP, pH 7.3 with KOH. Using these ion concentrations we established an ECl of -75.7 mV at 34°C, a value close to that for the peak of the IPSP in previous microelectrode recordings that produce minimal disruption of the Cl- gradient.5 To reference whole-cell membrane potentials with the K-gluconate based electrolyte, we subtracted a junction potential of -10.6 mV. Unless otherwise indicated, whole-cell recordings were adjusted through current injection (