Reliable Transmission of Audio Streams in Lossy Channels Using
Recommend Documents
Feb 15, 2005 - alphabet and losing its energy en route, in presence of correlated noise ... communication lines [9], in close analogy to what happen for a wide.
ulty (FIME), Nuevo León Autonomous University (UANL), Pedro de ..... coded Gbit/s digital communications with synchronized chaotic semi- conductor lasers ...
Dec 6, 2007 - NOC 2005, London, UK, July 2005, pp. 68-75. 8. G. Lietaert, âOptical return loss measurementâ, White. Paper JDSU, 2006 â www.jdsu.com.
and compressive oversampling to transmit and correctly recover image data ... than to retransmit lost data. However ... retransmissions of missing/incorrect data.
losses in Wireless Multimedia Sensor Networks (WMSN) using. Compressed Sensing ... correlate, and fuse multimedia streams originated from het- erogeneous ...
Chong Ding1, Douglas White1, Stephen Scearce1,. Yaochao Yang2. Cisco Systems, Inc. 1Research Triangle Park, NC, 2San Jose, CA, USA choding, dbwhite ...
Mar 16, 2009 - 1Dipartimento di Fisica, Universit`a di Camerino, via Madonna delle Carceri 9, I-62032 Camerino, Italy. 2NEST CNR-INFM & Scuola Normale ...
Currently, lossless audio coding has been approached from a signal model ..... Figure 4: PSD of the error signal at 64 kbps and 128 kbps as compared to the ...
Aug 27, 2015 - on the estimation of the packet error rate with periodic acknowl- edgments to ..... 500. 1000. 1500. 2000. 2500. Decoded matrix size (packets).
pled chaotic Nd:YAG lasers in master-slave configuration is numer- ically studied. Encoding ... NOWADAYS, information transmission plays a crucial role, where an .... World Academy of Science, Engineering and Technology 47 2008. 415 ...
Aug 13, 2015 - Abstract: Reliable data transmission over lossy communication link is .... Information acquisition consists of data transmission and signal recovery. ... and extra energy cost, because of waiting for a good link; besides they are.
begin by thanking the people without whom it would not have been possible for me to submit this ... that the proposed approach resize the image in accordance with the measured rate of different ...... stationary wavelet transform are performed using
Prepared for the Banque de France-Université conference, "Financial Cycles and
Growth," Marne- ... 1996 by Frederic S. Mishkin. .... rates at a floor of zero, an
expansion in the money supply (M i) can raise the expected price .... information
pro
stead of the Telegrapher's equation derived from it. First we reduce the mixed problem for the hyperbolic system to an initial value problem for neutral system of ...
As a matter of fact Z and Y may be frequency dependent, but our derivations hold true for any frequency. The solution of the telegrapher's equations is given by.
XOR scheme based on clustered model is presented. For this scheme, the cluster head broadcasts combined packets by XORing lost packets appropriately to ...
(Shannon's separation principle [7]), channel coding strategies which take into ...... The resulting system was shown to deal very effectively with random errors.
Jan 6, 2008 - photon-pair sources (the latter case with the degenerate SPDC process is already .... Pnm = δnm|cn|2, cn being the amplitude of a PNES. This.
Application of wireless audio transmission circuit using laser technology ..... Hecht J. (2010), Short history of laser development, Opt. Eng. 49, 091002. Hermann ...
... long-term fading (shadowing) and path loss. The multi-path phenomenon generates the amplitude variation of transmitted channel signal, namely the. H.263+.
double-soliton units, (ii) uniform triple-soliton units, and (iii) both triple- and .... close proximity strongly interact through their tailing fields (covalent bonding), the ...
geophysics, such as frequencyâmagnitude relation- ships of ... acceleration due to gravity, and h is the depth of stream. .... b, and C in the second formulation of Eq. (13) were ... product of vs and h was set equal to the flow per unit width, q.
Sep 7, 2010 - versus a single point of presentation, 3) dynamic movement ver- sus fixed .... selected from the BBC radio programme 'From our own corres-.
Reliable Transmission of Audio Streams in Lossy Channels Using
redundant information and increase the bandwidth usage at the cost of ... transmission on unreliable channels. The basic ... interpolation adds noise to the quality of the audio. By ... if we wanted to guarantee the reliability of carrier sets, we will ...
JOURNAL OF MULTIMEDIA, VOL. 3, NO. 5, DECEMBER 2008
1
Reliable Transmission of Audio Streams in Lossy Channels Using Application Level Data Hiding Parag Agarwal and B. Prabhakaran University of Texas at Dallas Email: [email protected],[email protected]
Abstract— The paper improves the reliability of audio streams in a lossy channel. The mechanism groups audio data samples into source and carrier sets. The carrier set carry the information about the source set which is encoded using data hiding methodology - quantization index modulation. At the receiver side, a missing source data sample can be reconstructed using the carrier set and the remaining source set. Based on reliability constraints a hybrid design combining interleaving and data hiding is presented. Experiments show an improved reliability as compared to forward error correction and interleaving. Index Terms—audio, streaming, watermarking
I. INTRODUCTION Streaming of multimedia such as audio is gaining importance due to the online availability of multimedia and millions of users daily using them. Streaming applications send compressed audio data in a network using unreliable transport (e.g. UDP) and network protocols (e.g. IP). Due to losses incurred at lower layers of the protocol stack, the data received will be poor in quality since some of the data samples will be missing. The question we try to address is as follows: How do we improve the quality of audio data sent over a lossy network? A. Issues with Related Work Reliability can be achieved by using a reliable transport protocol such as TCP. However, multimedia applications for audio are real time in nature and cannot tolerate delays introduced by such a protocol. So, the basic design generally uses unreliable transport protocol such as UDP. Reliability is implemented at the application layer by using methods [14] such as retransmission, forward error correction codes, and interleaving. During retransmission, we retransmit the lost data samples. This results in extra delay since packets have to be transmitted again. To overcome the problems of delay, we can add redundant information using forward error correction [8]. Lost packets can be recreated using packets (with forward error correction codes) that are received. In both the schemes, we add redundant information and increase the bandwidth usage at the cost of reliability. To overcome this problem, interleaving mechanism [8] have been proposed that interleave data sample and try to spread the error
uniformly. The lost data samples are recovered by applying linear interpolation mechanisms, which in turn reduces the audio quality. In order to come up with a scheme that tries to achieve reliability and quality, we can increase the amount of error concealment information sent and reduce the redundant information. This can be achieved by using data hiding methodology. Data hiding [10] is generally used to embed information (watermark) inside another data set. The watermarks (information represented in bits) define the uniqueness of the data set and can be used in applications such as copyright or tamper proofing. The addition of watermark tries to minimize impact the semantics of the data set, for example the audio quality in our case. Data hiding has an encoding phase, where we embed the watermark, and a decoding phase we decode the watermark. Using data hiding methodology error correction information is represented as a watermark and is hidden in the audio stream without increasing the size of the data samples. The audio data samples received at the receiver side are used to extract the hidden information and to recreate lost samples. Recent advances in applications of data hiding has been solutions for images and video [3, 9, 12, 4, 17, 13, 1] that try to cover the errors induced due to lossy transmission on unreliable channels. The basic idea is to hide the error correction information in the image or in a given video frame. In case of degradation of image or video quality, the error correction information is retrieved from the image or the frame, and improvement can be achieved. These schemes cannot be applied for audio, since it has different representation and each data sample cannot hide its information by itself as the corruption of the data sample means loss of the data sample. So, we need a scheme where corruption of lost data can be compensated by reconstructing this data sample from information hidden in data set that is not corrupted. The scheme proposed in this paper is based on this ideology. An idea similar to our approach is [4, 5], where data hiding is done at packet level in the compression domain. In this method, one packet hides error correction information about another packet. Before encoding the data set, the data samples for each packet are converted into quantized frequency components. As a result, the bits encoded are robust against compression mechanisms. The problem with this approach is that it requires integration with the packetizing protocol and the error correction
2
JOURNAL OF MULTIMEDIA, VOL. 3, NO. 5, DECEMBER 2008
information. The requirement for compression is necessary since frequency domain bit hiding does not offer a great hiding capacity. The encoding requires side information for every audio data set, and this makes the scheme inefficient in terms of storage. Also, we need to exchange this information over the lossy channel and guarantee its reliability as well. Since we encode for each packet, the scheme becomes more packet protocol dependent. In order to avoid the above problems, our scheme is designed to act above any packetizing protocol and does not require extra side information as well. B. Overview and Contributions Our approach is to combine data hiding and interleaving, which results in the following advantages: a) Lower bandwidth usage: The traditional approaches generate forward error correction codes and add them to packets. This results in packet size which utilizes more network bandwidth. To overcome this, problem we resort to data hiding mechanism where the error correction code is hidden and no packet size is increased. This results in reduction in network bandwidth usage. b) Improves quality with lower chances of interpolation: Interpolation has its advantages, for example, gaps resulting from packet loss are reduced since the interleaved packets fill up this gap. However, interpolation adds noise to the quality of the audio. By using data hiding mechanism, we might end up reducing the chances of using interpolation. This comes from the data can be recreated from the received interpolated packets. In order to achieve a hybrid scheme, we propose to encode information of a subset of data samples in another subset of data samples. During loss, this encoded information is used to reconstruct the loss data samples. The paper discusses reliability in terms of constraints, such as inter-sample distance and size of such sets. Based on these constraints, a hybrid design is suggested that combines data hiding and interleaving. Experiments verify the design choices made and we see that the hybrid scheme out performs existing interleaving methods such as forward error correction and interleaving.
maintained across the lossy network. The remaining data samples carry the information (delta) (= Di -Dj), and these remaining data samples forms the carrier set. We quantize and compress the delta information before encoding. The group members that carry the delta information are termed as carriers. In other words, they piggy back the delta information. The hiding is done using a data hiding method such as quantization index modulation [2]. As shown in Figure 1, the encoding phase uses uncompressed audio data samples. Once the encoding is done, the samples are passed onto the lower streaming protocol layer. Here, the samples are subjected to audio compression, grouped into packets and sent across the network. Decoding: In the decoding phase, the data samples in packets are first decompressed (see Figure 1) and then sent to the reliability layer for error correction. Since audio data sample have a sequence, we need the same sequence to play the audio. However, due to loss incurred at lower layers of the protocol stack, some of the data samples will be missing in the sequence. In order to reduce this loss, the group’s data samples that are successfully received will be used to reconstruct the loss samples. Since the encoded information is delta, reconstruction can be Di = Dj + delta or Dj = Di – delta. The encoding phase is as an offline process and decoding is a real-time process at the reciever. We can resort to interpolation or silence padding [11] to handle missing samples that cannot be reconstructed using the above encoding/decoding mechanism. Encoding and decoding can be understood as follows: Example of encoding and decoding: Assume data samples Dx, Dy, Dz are members of a group whose size is chosen as 3 (in general, group size >= 3). We aim to guarantee reliability for data samples Dx and Dy by encoding (Dx – Dy) in Dz. In case, we lose the data sample Dz and we have Dy and Dz with us. We can reconstruct Dx = Dy + (Dx – Dy). In this case, the data sample Dz is encoded with the information (Dx – Dy) and we consider it a carrier of this information.
II. SCHEME DESIGN The protocol stack used for networking is divided into a hierarchy of layers – application layer, transport layer, network layer, MAC layer and physical layer. Reliability can be achieved at different layers. Our system model focuses on reliability at the application level as it tries to make up for the losses in packets incurred at lower layers. The processing is done on a sequence of data samples before they are added to the payload of packets at lower layers of the protocol stack. The basic steps consist of encoding at the sender and decoding at the receiver, explained as follows: Encoding: As a first step, data samples are divided into groups. Each group consists of data samples divided into two unique sets – source and carrier. Source set consists of two samples (say Di and Dj) whose reliability is to be
During decoding, original values of Di or Dj are required in order to reconstruct the data. Therefore, we cannot encode information in the source set data samples. As a result, these cannot be members of a carrier set. So, if we wanted to guarantee the reliability of carrier sets, we will have to hide their delta information in another group’s carrier set. However, this would imply that the carrier sets are source sets. In case, these are lost, the
JOURNAL OF MULTIMEDIA, VOL. 3, NO. 5, DECEMBER 2008
* interval length. This implies that if we were to encode more bit information, we would have to reduce the interval length.
Figure. 2. 2 bit encoding for the absolute value |a| o the data sample (value changes from a to a’ due to modulation)
Embedding Rate Limitation: The audio format sent over the network uses lossy compression (e.g. for formats MP3, AC3, and AAC.), which adds quantization noise to data sample and results in loss of bits encoded using data hiding process. This loss can be minimized by defining the minimum number of bits per data sample. This defines the threshold on embedding rate for robustness against noise. A consequence of this factor, the size of the carrier group that can vary from 1 to n-2, where n is the total number of samples. It can be noted that the size of carrier set influences the size of a group, which as pointed above, depends on embedding rate. The scheme we adopt estimates the embedding rate robust against noise addition during compression stage. These can be determined using experiments and will be discussed more in Section III. After estimating our embedding rate, we find groups of carrier and source set. B. Group Formation Group formation is dependent on factors such as intersample distance and group sizes: B.1 Group Size: Every group consists of two set of data samples – source and carrier. The source set consists of data samples whose reliability will be guaranteed by information hidden in the carrier set data samples. In our design, we assume that the source group consists of two data samples Di and Dj. The size of the carrier set can vary since the number of bits that a data sample can hide is limited due to embedding rate (see Sub-section II.A). Therefore, carrier sets can have more than one data sample and they influence the group size as the source set size is fixed. In order to reconstruct either Di or Dj, we need presence of one such data sample and all the data samples in the carrier set. Larger sized groups have more number of data samples acting as carriers. Loss of a single member will result in loss of the information used to reconstruct the lost data sample in the source set. So, we can conclude that smaller sized groups are more preferable to design a reliable system. In order to maximize our chances that groups of smaller size, we try to reduce the bits representing delta, since we can encode using minimum number of data samples i.e. carrier group size is minimized. This is possible by selecting data samples in the source set such that delta is minimal. The advantage of minimizing difference is that the delta values will lie in a smaller range of numbers. These can be encoded using less number of bits, for example t bits
4
JOURNAL OF MULTIMEDIA, VOL. 3, NO. 5, DECEMBER 2008
can encode numbers in the range [0 2t-1]. Therefore, minimizing the range is important and can be made possible with pairs with minimal difference. The delta can be further reduced in size by using compression mechanism such as quantization. B.2. Inter-Sample Distance: Loss in data samples can be reduced by observing the nature of loss in networks. Since data samples are added to the payload of packets and these can be lost in bursts, we should avoid adding members of the same group to the same packet. To do so, we assume that data samples in different groups have an inter-sample distance defined as follows: Definition 1. Inter-Sample Distance: It defines the number of samples between two given data samples Di and Dj, given by (j – i - 1), where i < j. The inter-sample distance is based on a threshold distance TDis between data samples. Definition 2. Threshold Inter-sample Distance: It defines the threshold distance by which two data sample should be at least be separated, and can be represented as TDis. TDis is larger than a minimum inter-sample distance threshold (Tmin) and less than a maximum inter-sample distance Tmax, as suggested in equation (1) Tmin TDis Tmax
(1)
Tmin helps in defining a threshold that makes inter-sample large enough to avoid losses, wherein group members are present in the same packet. Therefore, we can fix Tmin on the basis of the maximum packet size, assuming we have the knowledge of packet sizes at the lower layer. Also, since data samples are paired in groups, we should not choose data samples which are far away in sequence. An attempt to recover the data sample from its group member would result in a waiting time, which is not tolerable for real time nature of the application. Generally, audio samples are buffered before being played, and we should ensure that the groups of data samples should be present in such a buffer with size BSize. Therefore, we should try to guarantee reliability for data samples that can fit in this buffer. So, when we interleave data sample using an inter-sample distance, it should be with a data sample that is present in this buffer i.e. all group data sample should lie in the same buffer. In order to avoid waiting for the data sample, we should choose an inter-sample distance less than BSize. Therefore, we have a restriction on Tmax, which is dependent on the buffer size BSize. To build a generic scheme, we assume Tmax to be dependent on the minimum buffer size used by audio streaming applications. Network delay will impact the time in which the buffer fills up, but it will not impact the data samples that are needed to fill the buffer. As mentioned above, the real-time constraints will wait for the buffer to be filled up in a given time failing which the reconstruction algorithm will trigger.
To summarize the above discussion, we can say that Tmin is dependent on maximum packet size whereas Tmax is dependent on minimal buffer size. Based on the above discussion, the following discussion gives the steps and problems involved in group formation. B.3 Grouping Scheme and Related Problems: Since we have the constraint in the choice of group formation, where smaller groups are more preferable, we identify smaller groups first. For every group formation, we first find set of data samples separated by a minimum intersample distance such that their delta is minimal. Once the choice is done, we find member of the carrier set that have a minimum inter-sample distance with the data samples of the source group and every other member of the carrier group. In short, all the data samples in a group should be separated by a minimal inter-sample distance. Although this looks like a perfect design, it has the added disadvantage of maintaining information about the occurrence of members in a group. In order to do so, we have to resort to sending additional information or data hiding of some sort. This could result in additional information being generated and scheme becoming more complex. In order to avoid side information and maximize chances of smaller groups while maintaining inter-sample distance criteria, we propose a hybrid mechanism in the next Sub-section. C. Hybrid Mechanism This mechanism is shown in Figure 3, where data hiding and interleaving are combined. During the encoding phase, we choose data sample that are neighbors (example – data sample Di and Di+1), since their difference is comparatively less as compared to data samples separated by inter-samples distance greater than ‘1’. This is necessary since we try to maximize the chances of encoding the bits representing delta in the data samples, in order to form smaller sized groups as observed in Sub-section II.B.
Figure 3. Visualization of hybrid scheme
Once the source group is identified, we increase the inter-sample distance between data sample Di and Di+1. To do so, we interleave either of the data samples with a data sample separated with minimum inter-sample distance i.e. we interleave Di with another data sample say Dj where j = i + TDis. Next, we try to locate the members of the carrier group. The choice of separating the member data samples by inter-samples is unnecessary since loss of either of them is loss of complete information. So, we can choose the data samples related
JOURNAL OF MULTIMEDIA, VOL. 3, NO. 5, DECEMBER 2008
to the carrier set in continuity i.e. for example Dk Dk+1 Dk+2 …. Dk+n. To make the design simple, we assume a fixed embedding rate for each data sample. Also, the number of bits to represent delta is fixed, which implies that the size of the carrier set can be fixed. So, for the hybrid scheme, given a fixed source set, we have to identify a carrier set separated with a minimum intersample distance. For example, we can easily find a carrier set located in between the interleaved source set data samples, such that all the carrier set and the source set data samples are separated by TDis. The order in which we select source sets can depend on the order of occurrence of data samples, and this determines our choice of carrier data samples. So, the idea of fixing the parameters makes our scheme simple and groups can be determined in a pre-determined way.
5
refer the packet loss model in [3], wherein the loss distributed uniformly.
Figure 5. Receiver side Process TABLE I. Audio Clips with encoding rate 16 bits/sample Audio Type Samples Mozart - music 1000000 Matrix Music - music
1000000
Walla – human sound Ravi Shankar - music
200000 1000000
TABLE II. Quality Audio Clips with Embedding rate is 5 bits/sample, scale with number of interval = 29 Audio Type SNR (dB) Mozart - music
95 dB
Matrix Movie - music
106 dB
Walla – human sound Ravi Shankar - music
85 dB 91 dB
The metric that defines the reliability is the data sample loss rate, which is defined as the ratio of the data samples lost to the original number of data samples. In order to measure the quality of audio samples produced at the receiver or after encoding, we use signal to noise ratio (which is measured in decibel, see Equation (2), where higher values indicate better quality of audio. Figure 4. Sender Side Hybrid Process
SNR (D, D’) = 20 Log10 Figure 4 gives an example where eight data samples are grouped, encoded and interleaved. The same data samples (as seen in Figure 5) due to the loss can be retrieved either due to the decoding process or by interpolation. These examples show that we do not add redundant information (for samples D1 to D8) as in FEC. Also, due to loss, although the number of interpolation cases is two (D4 and D7), we have to interpolate for one (D7). This will improve the quality of the received audio signal. III. EXPERIMENTS AND RESULTS The experiments were done in MATLAB using a set up where we assume point to point connection between server and client which download audio files. The loss in data samples is simulated by loss of packets which carry the data samples as payloads. The packet loss was simulated by assigning a loss probability to every packet and the packet is dropped accordingly. The reader can
mean square), D ~ Original audio data samples, D’ ~ audio data samples after processing (2) We use four different types (see Table I) of audio clips (encoding rate 16 bits/sample) such as ‘Walla – self recorded’, and audio clips from music albums of ‘Ravi Shankar music’ ‘Matrix Movie music’ and ‘Mozart music’. The experiments were done by taking converting the data samples into fixed point representation, since this is the representation for sending data samples using standards formats such as MP3, AC3, and AAC. The experiment results are categorized on the basis of impact on quality due to data hiding, design choices for hybrid scheme and finally, we give a comparison for reliability with well established schemes such as forward error correction and interleaving.
6
JOURNAL OF MULTIMEDIA, VOL. 3, NO. 5, DECEMBER 2008
Figure 8 (a) ‘Walla’ audio
Figure 6. Signal to Noise Ratio (SNR in decibels) Vs Varying scale ~ number of intervals (i.e. the interval length). Experiment done for ‘Walla’ audio signal.
A. Distortion Analysis As mentioned before in Sub-section II.A, we can control the distortion added due to modulation by controlling the interval length defined in the scale. Figure 6 shows that for an audio stream we reduce the interval length by varying the number of intervals in which the scale is divided. Therefore, the reduction in interval length reduces the distortion (SNR increases, see Figure 6). Based on this observation, we can fix the scale to control the distortions added during the encoding phase. Table II gives the signal to noise ratio after encoding the audio clips using a scale with number of intervals is 29. Since the SNR is high, the audio quality is preserved after encoding.
Figure 8 (b) ‘Ravi Shankar Music’ music audio
Figure 8 (c) ‘Mozart Music’ audio
TABLE III. Maximum number of bits encoded with changing precision of decimals for audio data encoded with a sampling rate of 16 bits/sample, audio data used is ‘Walla’
Change in Precision
15
13
11
9
7
5
Maximum number of bits
9
7
5
3
1
0
Figure 8 (d) ‘Matrix Movie Music’ music audio Figure 8. Average Absolute difference & Standard deviation Vs InterSample distance for different audio samples
Figure 7. Reliability Analysis of schemes based on Data ample loss rate Vs Probability of packet loss. The curve hiding capacity > delta implies groups sizes are small and hiding capacity < delta implies groups sizes are large
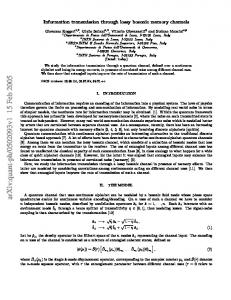
B. Design Choice – Hybrid scheme The following experiment results show the necessity for a hybrid scheme in order to implement our ideas related to application level data hiding for improving reliability of audio streams: B.1 Limitations due to Embedding Rate and Resolution: The embedding rate ( number of bits that can be hidden in the data sample) is limited due to audio compression noise. In such a case, the precision of data sample changes and we see loss of bit information. Table III verifies this limitation and shows that the maximum number of bits that we can encode decreases when the precision is reduced.
As pointed above, due to limitation in the number of bits that can be encoded in a data samples, the size of the carrier set can increase i.e. more data samples are used to hide delta. Increase in group size has an impact on reliability, since the larger groups are more vulnerable. From Figure. 7, the data sample loss can be inferred for cases where hiding capacity is greater or less than delta. It can be observed that larger group formations results in increased data sample loss rate for varying loss rates (probability of packet loss). Therefore, the design should try to minimize cases where hiding capacity is less than delta. This would ultimately improve the reliability as per the above suggestions. In our case this group size is ‘3’. Resolution: To overcome this problem, the paper suggests increasing the chances for forming smaller groups by making sure that the bits representing delta can be encoded using minimum data samples. To do so, we had proposed in Sub-section II.C to use neighboring data samples to define the source set. To prove this fact, we have conducted experiments where for different audio samples (see Figure 8 a – d) we have measured the average absolute difference and the standard deviation by increasing inter-sample distance. It was found that the average absolute difference and the standard deviation are
JOURNAL OF MULTIMEDIA, VOL. 3, NO. 5, DECEMBER 2008
least when the inter-sample distance is minimal. The average absolute difference justifies our choice for considering data samples with minimal difference which results in delta(s) such that their values lie in small range, as indicated by the low standard deviation value. Therefore, the delta(s) can be represented using less number of bits, which in turn will reduce the carrier data set’s size enhancing the reliability of the system.
7
the first identified pairs of data samples are neighbors and interleaved such that the inter-sample criteria is satisfied. So, the design choice leads to a hybrid mechanism that is a combination of interleaving and data hiding.
11 (a) Walla
11 (b) Ravi Shankar Music
Figure 9. Data sample loss rate Vs Probability of packet loss for different inter-sample distances ‘1’ and ‘100’
11 (c) Mozart Music 11 (d) Matrix Movie Music Figure 11. Reliability comparison in terms of Quality (Signal to Noise Ratio – SNR in decibel dB) Vs Probability of packet loss, for hybrid technique (Data hiding DH + Interleaving INT), Forward Error Correction (FEC), and Interleaving (INT)
Figure. 10. Reliability comparison in terms of Data sample loss rate Vs Probability of packet loss for different techniques (Interleaving – INT, forward error correction – FEC, DH + INT - hybrid data hiding and interleaving). Simulation done for 106 data samples with data sample loss rate calculated by varying the inter-sample distance during interleaving
B.2 Reliability Vs Inter-Sample Distance: To understand the impact of inter-sample distance, we measured the data sample loss rate by varying the inter-sample distance. Experimental results in Figure 9 show us that the data sample loss rate is less when the inter-sample distance is ‘100’ as compared to the inter-sample distance ‘1’. This implies that the choice of identifying pairs of data sample separated by larger inter-sample distance resulting in improvement in reliability of audio streams. Therefore, inter-sample distance is important for improving the reliability. The inter-sample distance is greater than a minimum threshold Tmin, which guarantees that data samples in a group lie in different packets. So, Tmin is larger than maximum packet size. However, TDis has an upper bound Tmax, which is dependent on the buffer size. Since we interleave data samples in different packets, a delay is incurred in filling buffers due to the wait time introduced between the arrival times of such packets. As mentioned in Sub-section II.B, Tmax is less than the minimal buffer size to counter such a problem. For simplicity, we test the reliability of the scheme by assuming that the inter-sample distance is within Tmin and Tmax. From the above, we infer that if we minimize the group size and still use larger inter-sample distances between members of the group, we can improve the reliability of the scheme. This can be achieved by using a hybrid scheme as suggested in Sub-section II.C, where
C. Comparative Analysis For comparative analysis, we first analyze the methods on the basis of data sample loss rate for varying probability of packet loss. We ran the experiments with 106 data samples for inter-sample distances greater than the packet size. For the hybrid scheme, we assumed that the size of the carrier set is greater than or equal to ‘1’. This variation in carrier set size was simulated by assuming the embedding rate was not large enough to hide all the bits representing delta. Such a variation was necessary to measure the average behavior of the scheme in the presence of varying group sizes. The forward error correction method implemented assumes replication per packet, wherein replication information is encoded for the ith packet is encoded in the (i+1)th packet. The data sample loss rate was calculated for 100 different runs. As observed in Figure 10, the hybrid scheme has a lower data sample loss rate than interleaving. This can be due to the fact that in the hybrid scheme, the lost samples in the interleaving scheme can be reconstructed by using data hiding scheme. Although FEC implemented in our experiments uses twice the bandwidth than expected amount, the hybrid scheme is more reliable with a lower data sample loss rate. This shows us that we do not use the bandwidth as compared to FEC, and are still able to improve the reliability of the audio streams. Since the hybrid method results in a lower data sample loss rate, it is expected to improve the quality of audio received. To test the quality of audio at the receiver, we conducted experiments for different audio clips (see Figure 11 a-d) given in Table I with quality after encoding as shown in Table II. We measured the audio quality in terms of signal to noise ratio for varying probability of packet loss. Based on these observations, we conclude that the
8
JOURNAL OF MULTIMEDIA, VOL. 3, NO. 5, DECEMBER 2008
proposed methodology is a good choice for improving the reliability of audio streams. IV. CONCLUSION The paper presented a scheme that combines ideas related to interleaving and data hiding to improve the reliability of audio streams in lossy channels. The data samples at sender side are divided into groups defined by source and carrier sets. The difference of the data samples in the source set is encoded using data hiding methodology (quantization index modulation) in the data samples defined in the carrier set. To avoid burst loss in networks, the data samples in these groups are separated by a particular number of data samples. To separate data sample occurring in continuity, interleaving is used to distribute the data samples and avoid such losses. At the receiver side, a missing data sample can be reconstructed using the data samples in the carrier set and the other source data sample, assuming they reach the receiver without any network loss. The scheme work shows improvement in terms of quality of audio received in a lossy network as compared to techniques such as forward error correction, and interleaving. ACKNOWLEDGEMENT The work is supported in part by US Army Research Office grant 48645-MA and National Science Foundation under Grant No. 0237954 for the project CAREER: Animation Databases.
REFERENCES [1] A. Yilamaz, and A.A Alatan. Error concealment of video sequences by data hiding. In Proc. Int. Conf. Image Processing, vol. 3, Sept. 2003, pp. 679-682. [2] B. Chen and G.W. Wornell. Quantization index modulation: A class of provably good methods for digital watermarking and information embedding. In IEEE Trans. on Information Theory, vol 47, pp. 1423 1443, May 2001 [3] C. B. Aadumilli, C. B. Farias.,S.K Mitra, and M. Carli, A robust error concealment technique using data hiding for image and video transmission over lossy channels. In IEEE Transactions on circuits and Systems for video technology, VOL. 15.,NO. 11, Page(s): 1394- 1406, 2005J. Clerk Maxwell, A Treatise on Electricity and Magnetism, 3rd ed., vol. 2. Oxford: Clarendon, 1892, pp.68–73. [4] C.-S. Lu, Wireless multimedia error resilience via a data hiding technique. In Proc. Int. Workshop Multimedia Signal Processing Virgin Islands, Dec. 2002, pp. 316-319. [5] Cheng S., Yu H., and Zixiang Xiong. Error concealment of MPEG-2 AAC audio using modulo watermarks. In Proc. of Circuits and Systems, 2002. ISCAS 2002. IEEE International Symposium, Volume: 2, On page(s): II-261II-264 vol.2. [6] Cheng S, Yu H. H., and Xiong Z. Method and apparatus for audio error concealment using data hiding, United States Patent, No. US 7047187B2, May 2006. [7] Chou J., Ramachandran K., and Ortega A. Next generation techniques for robust and imperceptible audio data hiding. IEEE ICASSP2001, pp. 1349 - 1352 vol.3 [8] C. Perkins., O. Hodson, and V. Hardman, "A survey of packet-loss recovery techniques for streaming audio," IEEE Network Magazine , Sept./Oct. 1998
[9] F. Bartolini, A. Manetti, A. Piva, and M. Barni. A data hiding approach for correcting errors in H.263 video transmitted over a noisy channel. In Proc. IEEE Workshop Multimedia Signal Processing, Oct. 2001, pp. 65-70. [10] I. Cox, M. Miller, J. Bloom, “Digital Watermarking: Principles & Practice” (The Morgan Kaufmann Series in Multimedia and Information Systems) [11] J. SUZUKI, and M. TAKA, Missing packet recovery techniques for low-bit-rate coded speech. IEEE Journal on Selected Areas in Communications, 7(5), June 1989 [12] J. Lee, and C. S. Won, A watermarking sequence using parities of error control coding for image authentication and correction. In IEEE Trans. Consum. Electron., vol. 46, no. 2, pp. 313-317, May 2000. [13] K. Munadi.,M. Kurosaki., and H. Kiya, Error concealment using digital watermarking technique for inter frame video coding/ In Proc. Int. Tech. Conf. Circuits/Systems, Computers, and Communications, Jul. 2002, pp. 599-602. [14] R. Geiger, Y. Yokotani., and G. Schuller. Audio data hiding with high data rates based on Intmdct. IEEE ICASSP2006, pp. V205 – V207. [15] S. Wbaknik, G. Schuller, J. Hirschfeld, and U. Kraemer. Packet loss concealment in predictive audio coding,. Applications of Signal Processing to Audio and Acoustics, 2005. IEEE Workshop on Volume, Issue, 16-19 Oct. 2005 Page(s): 227 - 230. [16] T.M.M. Cedric, Adi R.W., and Mcloughlin I. Data concealment in audio using a nonlinear frequency distribution of PRBS coded data and frequency-domain LSB insertion. TENCON 2000. Proceedings Volume 1, Issue, 2000 Page(s):275 - 278 vol.1. [17] Y. Liu, and Y. Li, Error concealment for digital images using data hiding,. In the 9th DSP Workshop Hunt, TX, Oct. 2000 BIOGRAPHY Dr. P. Agarwal did his B.Tech in Computer Engineering from NIT Calicut (formerly known as REC Calicut) in 1999, and MS in networking from The University of Texas at Dallas in 2002. He received his PhD in computer science from The University of Texas at Dallas in 2007. His research interests include trust building in machines, applied cryptography, digital watermarking, privacy and authentications systems. Currently, he is working with Fairwarning, Inc as a software engineer. Dr. B. Prabhakaran did his B.E in electronics and communication from Madurai Kamraj University India in 1986, and Masters from IIT Chennai India in 1990. He received his PhD in computer science from IIT Chennai India in 1995. Dr. B. Prabhakaran has been working in the area of multimedia systems: animation & multimedia databases, authoring & presentation, resource management, and scalable web-based multimedia presentation servers. Currently, he is with the faculty of Computer Science Department, University of Texas at Dallas. He has served as a visiting research faculty with the Department of Computer Science, University of Maryland, College Park. He also served as a faculty in the Department of Computer Science, National University of Singapore as well as in the Indian Institute of Technology, Madras, India. Dr. Prabhakaran has served as an Associate Chair of the ACM Multimedia Conferences in 2003 (Berekeley, CA), 2000 (Los Angeles, CA) and in 1999 (Orlando, FL) Dr. Prabhakaran received the prestigious National Science Foundation (NSF) CAREER Award in 2003 for his proposal on Animation Databases. He has published several research papers in various refereed conferences and journals in this area.