Earlier in April 2014, Moody's affirmed Bangladesh's government ratings at ... (Moody's Report, 2014). In May ..... Moody's Investor Service Moody's Corporation,.
現代社会文化研究 No.62 2016 年 3 月
Remittance Inflows and Its Contribution to the Economic Growth of Bangladesh Shirin Akter 要
旨 南アジアの発展途上国であるバングラデシュは、多くの海外労働移民と、多額の海外労
働者による送金で知られている。それら海外労働者送金は、2014-15 年には 153.1 億ドルと 驚異的な水準に達し、これはバングラデシュの GDP の 7.9%にもあたる。過去 10 年間、海 外労働者送金は海外資金の主要な源泉となっており、バングラデシュが受け入れる海外直 接投資(FDI)や公的開発援助(ODA)を上回っている。本論文は、海外労働者送金がバ ングラデシュの経済成長に与える影響を研究するため、1990-2013 年(24 年間)の時系列 データを用いて分析する。相関および回帰モデルを用い、海外労働者送金とバングラデシ ュの経済成長との関係を明らかにしようと試みた。結果、海外労働者送金とバングラデシ ュの経済成長との有意かつ正の相関関係が示された。
Keywords: Remittances, Economic growth, GDP, Bangladesh
1. Introduction
Remittance most commonly refers to the funds expatriates send to their country of origin via wire, mail, or online transfer. These peer to peer transfers of funds across boarders are economically significant for many developing countries. Remittances have been playing an important role on the economy of developing countries. In 2014, some US$ 435 billion were remitted to developing countries. The growth of remittances is expected to moderate to 4.4 percent in 2015, raising flows to US$ 454 billion. Remittances are an essential source of external funds for developing countries. These flows were three times larger than official development assistance (ODA) in 2013, and are steadier than both private debt and portfolio equity flows. Remittance flows are significantly larger than total foreign direct investment (FDI) to developing countries. They also help sustain the balance of payments (BOP) by bringing in foreign currency (World Bank, 2014).
- 215 -
Remittance Inflows and Its Contribution to the Economic Growth of Bangladesh (Shirin Akter)
Bangladesh is one of the largest remittance recipient countries through the export of its labor forces mainly to the Middle East and the Southeast Asian countries since the early 1970s. Job openings in the Middle-east and the establishment of an overseas recruitment system in the mid-1970s, pave the way open for Bangladeshi workers to go abroad for employment. Economic globalization in the 1980s and 1990s brought about a rise in the demand for migrant workers globally. This external demand opened up scope for a large number of Bangladeshis (mostly semi-skilled and less skilled) to go abroad as migrant workers. The migration of Bangladeshis took place owing to several pull factors (e.g., demand for labor abroad, kinship with other Bangladeshis living abroad, etc.) and push factors (e.g., poverty, unemployment, under development in rural areas etc. ) (ILO, 2014). During the last decade, remittances had become a major source of external fund, surpassing the volume of FDI and ODA that the country received. For the year 2014-2015, workers' remittance is 9 times higher than FDI and 25 times higher than Portfolio Investment and 4 times higher than ODA in Bangladesh [Annexure-I]. So, workers' remittance is a major source of foreign exchange earnings and these large inflows of remittances have enormous effects to the Bangladeshi economy. According to World Bank Estimates of 2013, Bangladesh is the 5th top emigration country with 7.76 million. Up to 2015 May, Bangladesh has sent more than 9.34 million (BMET, 2015) workers to 142 countries (BBS, 2013). Due to this mass movement of temporary migrant workers, the remittance transfers received from these migrant workers have reached a level of 15.31 billion US dollars in 2014-2015, approximately 7.9% of GDP in Bangladesh which was 14.23 billion US dollars in the year 2013-2014 (Bangladesh Bank, 2015). From 1976-2014, annual migration from Bangladesh is about 0.2-0.3 million i.e., every year about 200,000 or more Bangladeshis leave the country to work overseas (BMET, 2015). Most of these migrants send part of their earnings home regularly or irregular basis. Bangladesh receives 2.6 per cent of global remittance flow. This share was 3.5 per cent among developing countries and accounted for 12.8 per cent of the official remittances flowing into South Asia in 2014. The country ranked the 8th among developing countries and 10th globally as a remittance receiving country in 2013 with a remittance earning of US$13.86 billion. Bangladesh has been maintaining position within top 10 remittance recipient countries since last 15 years from 2004 to 2014[Annexure-II & III].Bangladesh is a country of surplus manpower resources with a combination of professional, skilled, semi-skilled and less-skilled labor force. Almost two million young people are added to the labor force every year (BBS, 2013).But the country lacks the ability to create jobs to absorb them. As a result, the outflow of Bangladeshi workers will continue in the foreseeable future. Migration plays a vital role in the national
- 216 -
現代社会文化研究 No.62 2016 年 3 月
economy mainly in two major ways: firstly by reducing unemployment and secondly, by providing remittance inflows for the country. The steady growth of emigration from Bangladesh over the years is favorable to the development of Bangladesh; as inflow of remittance has increased every year. The links between migration and remittances are obvious. Both have a strong co-relation to poverty reduction in home countries. Remittance has become an important aspect for the developing countries like Bangladesh for socioeconomic advancement. This study would like to identify the relationship between workers’ remittances and economic growth, and to investigate the impact of workers’ remittances on economic growth of Bangladesh by analyzing time series data of twenty four years (1990 to 2013). This paper consists of seven parts following introduction, part two consist of theoretical and empirical review of past literatures. Part three of the paper gives an overview of Bangladesh economy. Part four provides some facts and figures and the trends of remittance and migrant workers and illustrates impacts of remittances inflow on Bangladesh economy. Part five deals with modeling framework for estimation, part six consists of results and interpretation of estimation. Part seven concludes on the basis of analysis.
2. Literature Review
This section reviews some theoretical and cross country as well as time series empirical studies especially in the context of developing countries. There are many studies in remittance literature that has analyzed the relationship between workers’ remittances and economic growth. Studies that examined the relationship between remittances and GDP growth show mixed results. Majority of the existing studies illustrate the positive, direct and indirect, growth effect of remittances especially for the developing countries employing cross country data. However, some studies show a negative relationship between workers’ remittances and economic growth. Giuliano and Ruiz-Arranz (2005) conducted a study with International Monetary Fund (IMF) on the impact of remittance to growth. The study analyzed over 100 countries data. This paper analyzed the relationship between remittances and growth and its interaction with the financial development of the recipient country. The study was conducted by using a Generalized Method of Moments (GMM) approach independent of the particular measure of financial sector development. The study used a newly constructed cross-country data series for remittances covering 73 developing countries over the period 1975-2002. It was
- 217 -
Remittance Inflows and Its Contribution to the Economic Growth of Bangladesh (Shirin Akter)
found that remittances have promoted growth in less financially developed countries. The results suggest that remittances help to alleviate credit constraints on the poor, substitute for the lack of financial development, improve capital allocation, and therefore accelerate economic growth. The findings suggest that remittances can promote growth. Ratha and Mohapatra, (2007) prepared a note for “G8 outreach event on remittance” to identify the macro-economic impact of remittances on development and concluded that remittances are the most important source of finance. In many developing countries, they are the biggest source of external financing and they also help in reducing poverty as well as they can increase standards of leaving of the people Rao and Hassan (2012) conducted a study on 40 high remittance recipient countries using a System GMM panel data analysis. This paper analyzed the direct growth effects of remittances and the growth effects of the channels through which remittances may affect growth by treating as conditioning variables. It is found that while the evidence supports the indirect effects of remittances, the direct growth effects of remittances seem to be insignificant. The study finds that remittances indirectly facilitate economic growth by increasing the ratio of Broad Money (M2) to GDP. Siddique, Selvanathan and Selvanathan (2012) conducted a study on remittance and economic growth on major South Asian countries (i.e., Bangladesh, India and Sri Lanka). This article investigated the causal link between remittances and economic growth by employing the Granger causality test under a Vector Auto Regression (VAR) framework using time series data over a 25-year period from 1980-2005.
The empirical
analysis identifies that remittances have a mixed response with the economic growth. The study finds no causal relationship between remittance and economic growth in the case of Bangladesh and India. But for Sri Lanka, a two way causal relationship is found between remittance and economic growth. Das and Chowdhury (2011) investigated long run relationship between remittances and GDP of 11 top remittance-recipient developing countries including Bangladesh. They applied latest developed econometric techniques, i.e., panel co- integration and pooled mean group (PMG) approach. The results support a positive long run relationship between remittances and GDP. However, the magnitude of the remittance-GDP coefficient is quite small. Their result also implies that developing countries should formulate policies to divert this external resource into more productive sectors. Paul and Das (2011) conducted a study on Bangladesh (from 1979 to 2009, a relatively liberalized regime) to examine the remittance-GDP interaction in both the long run and short run with a comprehensive approach by applying unit root tests, co integration tests and specially the vector error correction (VEC)
- 218 -
現代社会文化研究 No.62 2016 年 3 月
model to get the estimates on the co-integrating vector and short-run dynamics. The Study finds a long run positive relationship between remittances and GDP. Jawaid and Raza (2014) is a study conducted by International Organization for Migration (IOM) on the effect of workers’ remittances and its volatility on economic growth of five South Asian countries. This study investigated the effect of workers’ remittances and its volatility on economic growth of five South Asian countries by employing long time series data from 1975 to 2009. The Study applied time series econometric techniques namely- unit root tests, co-integration test and sensitivity analysis by adding other variables into the model and finds mixed results for different countries. The results confirm a significant positive long run relationship between remittances and economic growth in India, Bangladesh, Sri Lanka and Nepal, but a significant negative relationship in Pakistan. Study on Bangladesh by Datta and Sarkar (2014), attempted to analyze the impact of remittances on economic growth, using time series econometric techniques, specifically, the auto regressive distributed lag (ARDL) framework taking only two variables remittance and GDP under consideration. The study suggests that while remittances can foster growth and development as well as prevent balance of payment crises, they can also have a negative impact on growth if used for conspicuous consumption or unproductive purpose. The findings of this study show that there is a possibility of a long-run relationship between remittances and GDP, but there is no predictive causal relationship, neither in the short-run nor in long-run. Negative relationship between remittance and economic growth was predicted by Chami et al. (2003). They rather finds a negative effect of remittances on economic growth as it reduces the incentive to work by the migrant family members. This Paper provides a new systematic theoretical analysis and robust empirical estimation (using a complete set of conditional variable for remittances) using the most accurate and comprehensive remittances data available. The study used database encompassing 84 recipient countries and annual observations for the 1970–2004 period. The results demonstrate that remittances have had, at best, no impact on economic growth.
3. Overview of Bangladesh Economy
Bangladesh a developing economy in South Asia has a total land area of 147,570 square kilometers (56,977 square miles) geographically bounded by India to the west, north and north-east, by Myanmar to the South-east, and by the Bay of Bengal to the south. According to World Bank data, 2014 Bangladesh falls under
- 219 -
Remittance Inflows and Its Contribution to the Economic Growth of Bangladesh (Shirin Akter)
the category of middle income country with GDP of US$ 173.8 billion(GDP at current US$).
Table 1: Key Macroeconomic Indicators* Indicators 2009-10 2010-11 Real Sector GDP at current prices (USD 115921.4 132345.2 million) GDP in constant market price
87731.2
90778.1
2011-12
2012-13
2013-14
2014-15P
148202.8
151570.5
169076.3
194550.1
87040.5
91351.7
99683.4
105980.7
Growth rate of GDP at constant price (%) Population (million)
5.57
6.46
6.52
6.01
6.12
6.51
147.8
149.7
151.6
153.7
155.8
157.9
Inflation rate (12 month average)
7.6
9.39
12.3
7.6
6.82
6.46
Sectoral share (as % of GDP) Agriculture Manufacturing
17.81 26.14
17.71 26.39
17.09 26.74
16.28 27.64
16.11 15.59
15.59 27.98
Services
56.05
55.9
56.16
56.09
27.98
56.42
Exports (as % of GDP) Imports (as % of GDP)
14.1 18.6
17.6 25.3
18 25
17.7 22.4
17.2 21.2
7.5 10.3
Trade balance(as % of GDP)
-4.5
-7.7
-7
-4.7
-3.9
-2.7
3.2
-1.3
-0.3
1.7
0.9
-0.7
9.5
8.8
8.7
9.5
8.4
7.9
10987
11513
12734
14338
14115
9835
10750
10912
10364
15315
21508
24141
External sector
Current account balance (as % of GDP) Workers' Remittance (as % of GDP) Workers’ remittances (USD million) Foreign exchange reserve (USD million)
Investment and savings (as % of GDP) Gross investment
26.2
27.4
28.3
28.4
28.6
29
Public investment
4.7
5.3
5.8
6.6
6.5
6.9
Private Investment
21.6
22.2
22.5
21.7
22
22.1
Gross domestic savings
20.9
20.7
21.2
22
22.1
22.3
Gross national savings
29.5
29
29.9
30.5
29.2
29
* All GDP figures are calculated taking Fiscal year 2005-06 as base year.
P= Provisional
Source: Compiled from Bangladesh Bureau of Statistics (BBS) and Ministry of Finance (MoF) data
The total population of Bangladesh is 160 million. Bangladesh is one of the most densely populated countries in the world, with 1222.08 people living in per square kilometer land area, and approximately 26%
- 220 -
現代社会文化研究 No.62 2016 年 3 月
of the population lives in the urban area1. Bangladesh has achieved significant development progress, making the transition from the mid-1980s from being an inward-looking socialist economy to a liberalized economy, under the auspices of major donors. The economy has attained an average annual growth rate of 6% in the 2000s.Economic growth has stabilized since the 1990s.Increased GDP and lower population growth have resulted in higher per capita income, up to USD 1,044 in 2013 from only USD 90 in 1973 (BBS, various issues). Higher income was coupled with lower income poverty as the share of population living below the poverty line has fallen from more than 80% in the early 1970s to 31.5% in 2010 (BBS, 2015). Bangladesh has been utilizing a mixed system of public and private development, which operates on free-market principles. Due to the liberalization policies followed since the mid-1970s, more than 60% of the economy of Bangladesh is integrated with the global economy through exports, imports, remittances, ODA and FDI. The share of exports, imports and remittances as a percentage of GDP has been on the rise since the 1990s (CPD, 2014).The above table-1 shows the overall economic progress of Bangladesh economy for the last 6 fiscal year starting from year 2009-10 to 2014-15.
4. Remittance Dynamics in Bangladesh
4.1. Emigration Pattern of Bangladesh International remittances come to Bangladesh mainly from three large, but distinct types of migrants. Firstly, well-educated, high or middle income earners diasporas2 of Bangladeshi origin living in USA and UK. Secondly, low-income or unemployed segments of the population in USA and UK and other industrialized countries. Thirdly, a major group of migrant laborers residing in Middle Eastern, South East Asian and some industrialized countries for a specific period (IOM, 2005).The estimated diaspora population living permanently in the industrialized west is about 1.2 million (ILO , 2014). The origins of migration to industrialized countries mainly to the UK and the USA can be traced back to the colonial period from the eighteenth century onwards as sailors or even stowaways originating from the south- eastern part of Bangladesh (Siddiqui, 2003). During the 1950s and 1960s, Bangladeshi workers migrated abroad, especially to the UK and obtained British citizenship by naturalization after staying four to five years. Also a limited number of Bangladeshi workers had taken up employment in Saudi Arabia and Qatar mostly by individual initiatives during 1960s (Das and Chowdhury, 2011). After the independence of Bangladesh in 1971, pattern of workers' migration changed drastically.
- 221 -
Remittance Inflows and Its Contribution to the Economic Growth of Bangladesh (Shirin Akter)
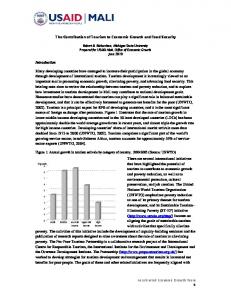
Bangladesh has emerged as one of the major manpower exporting countries in the South Asia from the early 1990s.Over the last 39 years, the number of Bangladeshi labor migrants gradually increased from around 6,000 in 1976 to more than 200,000 in 2014s. According to BMET data up to May of 2015, the number of total migrant population is 9.35 million. This latest figure represents about 12.04 per cent of the total workforce (Figure 4.1).
16000.00 14000.00 12000.00 10000.00 8000.00 6000.00 4000.00 2000.00 0.00 1976 1978 1980 1982 1984 1986 1988 1990 1992 1994 1996 1998 2000 2002 2004 2006 2008 2010 2012 2014
Remittance Received
Figure 4.1: Total Number of Bangladeshi Labor Migrants from 1976 to May 2015
Year Source: Bureau of Manpower, Employment & Training (BMET) & Government of the People’s Republic of Bangladesh Data of June, 2015 (http://www.bmet.org.bd/Flow-Migration.htm)
An analysis of the migration data since 1976 reveals that around 80% of all labor migration from Bangladesh is directed towards Middle Eastern countries. Most popular destination in the Middle East is Saudi Arabia (with 2.6 million migrants). Saudi Arabia is followed by the UAE (with about 2.34 million migrants) and Kuwait (more than 4.89 million migrants). In South-east Asia, Malaysia has been the main destination with officially more than 711,000 Bangladeshi migrants during the same period. Singapore and South Korea receive a significant number of labor migrants as well (Figure 4.2 and 4.3).
- 222 -
現代社会文化研究 No.62 2016 年 3 月
Figure 4.2: Overseas Employment of Bangladeshi Labor Migrants from 1976 to May 2015 Singapore Others Malayasia 6% 6% 8%
Libya 1% Jordan 1% Lebanon 1% Bahrain 3%
UAE 25%
Qatar 4%
Oman 11%
KSA 29%
Kuwait 5%
Source: BMET Data at June, 2015 (http://www.bmet.org.bd/Flow-Migration.htm)
Destination country
Figure 4.3: No. of Bangladeshi Labor Migrants to Destination Country (1976 to May, 2015) Japan UK Egypt IRAQ S.Korea Mauritius Brunei Italy jordan Libya lebanon Others Bahrain Qatar Kuwait Singapore Malayasia Oman U.A.E. K.S.A.
1 10 21 29 32 42 49 55 94 121 122 192 306 399 489 566 711 992 2340 2649 0
500
1000
1500
2000
2500
3000
Number of officially recorded labour migrants ('000)
Source: BMET data of June, 2015 (http://www.bmet.org.bd/Flow-Migration.htm)
- 223 -
Remittance Inflows and Its Contribution to the Economic Growth of Bangladesh (Shirin Akter)
20000.00 15000.00 10000.00 5000.00 0.00 1976 1978 1980 1982 1984 1986 1988 1990 1992 1994 1996 1998 2000 2002 2004 2006 2008 2010 2012 2014
Remittance Received in Million US$
Figure 4.4: Evolution of Remittance Inflow to Bangladesh from 1976 to May, 2015
Year Source:
BMET Figure of June, 2015 (http://www.bmet.org.bd/Flow-Migration.htm)
Source Country/Region
Figure 4.5: Remittance Inflow to Bangladesh from Fiscal Year 1999 to May, 2015 Iran Hongkong Libya Germany Australia Japan S.Korea Italy Singapore Bahrain Qatar Others Oman Malaysia U.K. Kuwait U.S.A. U.A.E. K.S.A.
22.97 160.35 196.37 273.58 304.01 306.88 352.69 2095.37 2641.61 2790.13 3528.56 4255.73 4837.72 6162.51 9631.34 11644.47 18315.55 20422.8 36810.33
0
10000
20000
30000
40000
Remittance from Bangladeshi Migrants (in million US $)
Source: Bangladesh Bank, Economic data (https://www.bb.org.bd/econdata/wageremitance.php)
According to official data of the Bangladesh Bank and BMET, Bangladesh received about a total of
- 224 -
現代社会文化研究 No.62 2016 年 3 月
US$ 13.38 billion in remittances between 1976 and 2014 and US$ 14.94 billion for the year 2014.Figure 4.4 shows that the official flow of remittances to Bangladesh has increased dramatically in last 39 years. Most of the international remittances come to Bangladesh from the Middle East. Saudi Arabia alone accounts for about 30 per cent of the official remittance inflow. UAE accounts for 16% and Kuwait accounts for 9% of total remittance flow (Figure 4.5).An important share of remittances comes therefore from temporary migrant laborers of Middle East. However, the importance of the diaspora should not be underestimated. Over the years, the USA has become the third largest remittance sending country. The UK, another important country for long-term Bangladeshi migrants, accounts for 7 per cent of the remittance flow. According to “The Migration and Development Brief, 23” of World Bank in 2014, Bangladesh is the th
8 largest remittance receiving country in the world. According to World Bank Data, Bangladesh receives 2.6 per cent of global remittance flow. This share is 3.5 per cent among developing countries and accounts for 12.8 per cent of the official remittances flowing into South Asia in 2014, holding 3rd position. The figure 4.6 shows that Saudi Arabia, UAE and Kuwait are top listed among the Middle-east countries. But among the industrialized countries U.S.A and UK holds position among top 5 remittance sending countries.
Figure 4.6: Country-wise Remittance Inflow to Bangladesh (1999 to May, 2015) Qatar Bahrain Singapore Italy Others 1% 2% 3% Others 2% 2% 3% Oman K.S.A. 4% Malaysia 30% 5% U.K. 8% U.A.E. U.S.A. 16% 15% Kuwait 9%
Source: Bangladesh Bank Economic data (https://www.bb.org.bd/econdata/wageremitance.php)
- 225 -
Remittance Inflows and Its Contribution to the Economic Growth of Bangladesh (Shirin Akter)
Figure 4.7: Category-wise Overseas Employment from 1976 to 2015 Others
1.17%
2.42% Professional
Less killed 50%
Skilled 31.35%
Semi skilled 15.07%
Source:
Professional Skilled Semi skilled Les skilled Others
BMET Figure of June, 2015 (http://www.bmet.org.bd/Flow-Migration.htm)
Figure 4.8: Growth Rate Comparison of Remittance and Migrant Workers (1976-2915) 200 150 100 50 0 -50 -100 Growth of Remittance
Growth of Migrant Workers
Source: Bangladesh Ministry of Finance (MoF) Data, 2015 (http://www.mof.gov.bd/)
So, there is an important observation that though a large number of Labor migrants are going to Middle-east countries, they are not earning enough money to remit as compared to diaspora population in the USA and the UK. Two main reasons behind this is the lack of skill composition of workers and the low wage rate of Bangladeshi labor migrants. The above figure 4.7 about skill composition of Bangladeshi workers and figure 4.8 about comparison of growth rate of remittance and Growth of Migrant workers are also evident of such findings.
4.2 Remittances and the Macro-Economy Remittance inflows can help to improve a country’s development prospects, maintain macroeconomic stability and mitigate the impact of adverse shocks. Remittance is a steadily growing external financial source for developing countries. It can generate substantial welfare gains for migrants and thereby could play an important role in reducing poverty. Migration generates a relatively stable source of income that contributes
- 226 -
現代社会文化研究 No.62 2016 年 3 月
to the support of migrant workers’ family members back home, enabling them to invest in education, health and housing, thus improving household living conditions and reducing vulnerability of family members, especially women and children. Remittances therefore constitute a steady source of poverty reduction (IOM, 2009).In comparison of remittance flow and ODA; it appears that remittances are larger than ODA, FDI, and portfolio investment flows in many developing countries (Ratha and Mohapatra, 2007). A study of World Bank (2008) finds that migrant remittances impact positively on the balance of payments in many developing countries. Remittances do augment consumption and increase the diversity of consumption and investment and thereby have an important role in stimulating the economy. Remittances augment savings which the recipients store in land and saving deposits. Remittances can be used for investment which further stimulates demand for goods and services, as well as contribute to financial development. So, remittances have multiplier effect on economy.
4.2.1 Remittance Reduces Poverty At present, remittances play a crucial role in the economy of Bangladesh. It has emerged as a key driver of economic growth and poverty reduction. Bangladesh earns around US$14 billion a year as remittances from nearly 8.0 million expatriate workers across the globe mainly in the Middle East and the Gulf regions. In Bangladesh just 13 per cent of households that receive remittances from abroad are below the poverty line, compared to 34 per cent of non-remittance-receiving households, according to an updated data of the UN (UN, 2011). According to the survey conducted by Bangladesh Bureau of Statistics (BBS) on the use of remittance, remittances constitute 78 percent of income of the receiving households. On average, RRHs (Remittance Receiving Household) receive BDT3205,642 per annum in remittances—more than two times the per capita annual GDP in FY14. Non-remittance income on average constitutes 21.4 percent of total income of RRHs. The survey does bring home the reality that migration continues to be a rewarding transition to higher income for the migrants and their families relative to opportunities in the domestic economy. So it helps to alleviate poverty and also improve the standard of living of the RRHs (BBS, 2013). 4.2.2 Remittance as Important Source of External Funds Remittance is an important source of foreign exchange earnings in Bangladesh. At the macro level, it helps to relieve our foreign exchange constraint, stabilize the exchange rate fluctuation, and improve the balance of payments. Besides, remittances are used to pay for imports and to repay foreign debt. At micro level,
- 227 -
Remittance Inflows and Its Contribution to the Economic Growth of Bangladesh (Shirin Akter)
remittance has a good impact on household consumption, poverty reduction and self employment. It also improves country’s creditworthiness. However, it has been more stable source of foreign earnings than both FDI and foreign aid (Bangladesh Bank, 2014).Remittances now represent the 2nd largest source of external finance after FDI for Bangladesh, and the tentative impacts on macroeconomic development cannot be ignored. Figure-4.9 gives us a clear view on the growing importance of remittances. The critical factor is the relative rise of remittances against external debt and imports. Bangladesh has remained a trade deficit country in most of the years since independence, but, after 2000s, it has been continuously posting current account surplus mainly because of remittance income.
Figure 4.9: Comparison of Source of External Funds with Remittance 20000.00
3500 3000 2500 2000 1500 1000 500 0 -500
15000.00 10000.00 5000.00 0.00
Workers Remittance Portfolio Investment Net
Foreign Direct Investmen Net Net Overseas Development Assistance
Source: Bangladesh Bank Annual Report and Bangladesh Economic Review Data
4.2.3 Strong External Liquidity Position Large remittance inflows to Bangladesh have also bettered its international credit rating. The importance of remittances to Bangladesh is further underscored by explicit inclusion in assessments by credit ratings agencies (World Bank, 2014). Earlier in April 2014, Moody’s affirmed Bangladesh’s government ratings at Ba3 with a stable outlook. According to Moody’s statement, the country’s external liquidity position is comfortable, with foreign reserves providing ample cushion to meet maturing debt obligations (Moody’s Report, 2014). In May 30, 2014, the Standard & Poor’s (S&P) assigned Bangladesh its rating for the first time BB- for long term international credit and a B for short term credit. Bangladesh's strong external liquidity position and declining external leverage support the ratings. Remittance inflows to Bangladesh, averaging 11% of GDP over the past three years generally ensures current account surpluses. Foreign exchange reserves (as of end April) stood at US$20.4 billion, equivalent to an estimated 5.5 months of current
- 228 -
現代社会文化研究 No.62 2016 年 3 月
account payments. These all are the positive outcomes of large remittance inflow from migrant workers’ (Standard & Poors’ Report, 2014).
5. Empirical Model and Data
After reviewing the empirical studies, the models to examine the relationship between workers’ remittances and economic growth has been developed through a simple regression model as follows: GDP t = β 0 + β 1 GFCF t + β 2 ELF t + β 3 WR t + Ɛ t ………………(i) Where, GDP t is the real gross domestic production, GFCF t is the gross fixed capital stock, ELF t is the total employed labor force, and WR t represents the workers’ remittances and ɛ t is the error term at time t. The same model has been used by Iqbal and Sattar (2005), Waheed and Aleem (2008), Jawaid and Raza (2012), and Jawaid and Raza (2014). In this study, time series data have been used for the period of 24 years (1990 to 2013) [Annexure-IV].All data has been gathered from the official database of World Bank (available at http://data.worldbank.org/indicator).
6. Estimation and Results
Table 6.1: Correlation Matrix GDP
GFCF
ELF
WR
1
0.999**
0.985**
0.984**
GFCF
0.999**
1
.963**
0.981**
ELF
0.958**
0.963**
1
0.946**
WR
0.984**
0.981**
0.946**
1
GDP
**
Correlation is significant at the 0.01 level (2-tailed).
- 229 -
Remittance Inflows and Its Contribution to the Economic Growth of Bangladesh (Shirin Akter)
Table 6.2: Results of Regression Model* Dependent Variable: Growth Rate of GDP; Method: Least Squares Sample: 1991-2013; Included Observations: 23 Variable
Coefficient
Standard Error
t-Statistics
Probabilities
C
-3.395
2.265
-1.499
0.150
GFCF
0.821
0068
12.131
0.000
ELF
1.095
0.994
1.102
0.284
WR
0.030
0.046
0.652
0.522
R
0.944
R-squared
0.891
Adjusted R-squared
0.874
Sum squared Residual
77.773
Standard error of regression
2.02320
F-statistics
51.814
Probability (f-statistics)
0.000
*Calculated based on the growth rate of GDP, GFCF, ELF & WR.
Pearson Correlation test has been used to examine and measure the co-relation of the concerned variables. The above table 6.1 shows strong positive relationship among all the variables with each other. In the above table 6.2, the results of regression model has been shown. The model is best fit as the adjusted R2 value is very close to 1 (i.e. 0.891). The t-statistic shows the positive figure 0.652. The R-squared Value is very high in this case. But the R-square value simply show that all variables shows only rising trend; they do not necessarily account for a close relation between the variables. So, it is necessary to get rid of trend effect by using some appropriate method for reducing the trend effect.
- 230 -
現代社会文化研究 No.62 2016 年 3 月
200,000
50,000
150,000
40,000 30,000
100,000
20,000
50,000
10,000
0
0
Year GDP
GFCF
Source: Constructed based on the data on Annexure-IV
Amount in Million
Figure 6.2: Trend analysis of GDP & ELF 200,000
60.00 50.00 40.00 30.00 20.00 10.00 0.00
150,000 100,000 50,000 0
Year GDP
ELF
Source: Constructed based on the data on Annexure-IV
Figure 6.3: Trend analysis of GDP and WR
Amount in Million
Amount in Million
Figure 6.1: Trend analysis of GDP & GFCF
200,000
15,000.00
150,000
10,000.00
100,000 5,000.00
50,000 0
0.00
Year GDP
WR
Source: Constructed based on the data on Annexure-IV
- 231 -
Remittance Inflows and Its Contribution to the Economic Growth of Bangladesh (Shirin Akter)
Figure 6.4: GDP and GFCF Growth Rate
Growth Rate
40.00 30.00 20.00 10.00 0.00 -10.00 199119931995199719992001200320052007200920112013 Year Growth Rate of GDP
Growth Rate of GFCF
Source: Constructed based on the data on Annexure-IV
Figure 6.5: GDP and ELF Growth Rate
3.00
20.00
2.00
10.00
1.00
-10.00
1991 1992 1993 1994 1995 1996 1997 1998 1999 2000 2001 2002 2003 2004 2005 2006 2007 2008 2009 2010 2011 2012 2013
0.00
0.00
Year Growth Rate of GDP
Growth Rate of ELF
Source: Constructed based on the data on Annexure-IV
Figure 6.6: GDP and WR Growth Rate 40.00 30.00 20.00 10.00 0.00 -10.00
1991 1992 1993 1994 1995 1996 1997 1998 1999 2000 2001 2002 2003 2004 2005 2006 2007 2008 2009 2010 2011 2012 2013
Growth Rate
Growth Rate
30.00
Year Growth Rate of GDP
Growth Rate of WR
Source: Constructed based on the data on Annexure-IV
- 232 -
現代社会文化研究 No.62 2016 年 3 月
Now, the above graphs with absolute figure and growth rate of variable GDP, GFCF, ELF and WR, indicate a very strong relation between GDP and GFCF. But as for GDP and WR, it is doubtful that there is such a strong relation between them. Same is true for GDP and ELF. In order to determine the significance of each dependent variable (GFCF, ELF and WR) with GDP, regression analysis has been conducted individually for dependent variable (GDP) with each independent variable (GFCF, ELF and WR respectively). Table 6.3: Individual Regression Analysis of GFCF, ELF and WR with GDP* GDP & GFCF Variable
GDP & ELF
GDP & WR
Co-efficient t-statistics Variable Co-efficient t statistics Variable Co-efficient t statistics
Constant
13191.352
17.368
-133005.293 -10612
Constant 33160.174
17.595
WR
17.709
Constant GFCF
3.259
66.126
ELF
4484.955
15.322
6.914
R
0.998
R
0.962
R
0.971
R2
0.996
R2
0.925
R2
0.943
Adjusted R2
0.995
Adjusted R2
0.921
Adjusted R2
0.940
F-statistics
4372.692
F-statistics
234.772
F-statistics
313.611
(probability)
(0.000)
(probability)
(0.000)
(probability)
(0.000)
*Based on absolute figure of each variable.
Table 6.4: Individual Regression Analysis of GFCF, ELF and WR with GDP* GDP & GFCF Variable
GDP & ELF
Co-efficient t-statistics
GDP & WR
Variable Co-efficient t statistics Variable Co-efficient t statistics
Constant
-0.647
-0.853
Constant
11.711
20195 Constant
6.476
3.009
GFCF
0.800
12.426
ELF
-2.310
-0.867
0.053
0.409
WR
R
0.938
R
0.186
R
0.089
R2
0.880
R2
0.035
R2
0.008
Adjusted R2
0.875
Adjusted R2
-0.11
Adjusted R2
-0.039
F-statistics
154.411
F-statistics
0.751
F-statistics
0.167
(probability)
(0.000)
(probability)
(0.396)
*Calculated based on growth rate data of each variable.
- 233 -
(probability)
(0.687)
Remittance Inflows and Its Contribution to the Economic Growth of Bangladesh (Shirin Akter)
According to the results presented in table 6.3 and table 6.4, R2 of absolute figure of GDP and WR is extremely high (0.968), but R2 of growth rates of GDP and WR is positive (0.008) but very low. So, the difference is only on the ground of trend effect. To obtain result closer to the real world situation, de-trending of data is required. Firstly, logarithms of variables have been taken to linearize the data. However, to get rid of the trend effect, linear trend has been taken into consideration for calculating the predictive value of GDP (logY) & WR (logR). The equations for GDP & WR are as follows;
Y t (GDP)
= α+β 1 ×t
t:time 1, 2, 3, 4, ・・, 24
R t (WR)
= α+β 1 ×t
t:time 1, 2, 3, 4, ・・, 24 ………...(iii)
……..…(ii)
By regression analysis, value of α and β 1 are determined. By substituting the value of α and β 1 and time t into the equation no. (ii) and (iii), logY' and logR' respectively have been calculated (by subtracting the predictive value from real value of each variable)[Annexure-V].Moreover, regression with time series variables sometimes involve time lag between variables. One variable can influence another with a time lag. Again in this case the following figure of logy’ and logR’ represents that there is a time lag between this two variables. Figure 6.7: Comparison of GDP and WR after Detrending
0.15 0.10 0.05 logY' 0.00 logR' -0.05 -0.10 -0.15 Source: Constructed based on the data on Annexure-V
Because as WR increases, effective consumption demand increases, and also investment for raising productive capacity of consumption goods for their future increases. As for time lag, a single year WR rise does not stimulate consumption. It could take a few years for the WR to fuel the spending for consumption. The lag length is considered 2 years in this case. The graph of logY’ and logR’ lagged for 2 years (figure 6.8)
- 234 -
現代社会文化研究 No.62 2016 年 3 月
demonstrate strong relation with GDP and WR,
Figure 6.8: Comparison of GDP and WR after Detrending (with WR lagged 2 years) 0.15 0.10 0.05 logY'
0.00
logR-2
1992 1993 1994 1995 1996 1997 1998 1999 2000 2001 2002 2003 2004 2005 2006 2007 2008 2009 2010 2011 2012 2013
-0.05 -0.10 -0.15
Source: Constructed based on the data on Annexure-VI
Table 6.5: Individual Regression Analysis of GDP & WR after removing trend effect (Based on Data of Annexure-V & VI) With linear trends
With linear trends (WR lagged 2 years)
Variable
Co-efficient
t-statistics
Constant
0.001
0.107
WR
0.200
1.772
Variable
Co-efficient
t statistics
Constant
-0.002
-0.409
WR
0.354
3.791
R
0.353
R
0.647
R2
0.125
R2
0.419
0.085
Adjusted
Adjusted
R2
F-statistics(prob)
3.141(0.090)
R2
F-statistics(prob)
0.390 14.414(0.001)
This time, R2 of GDP and WR provides value 0.085 (for linear) and 0.419 (for linear with 2 periods lag for WR). So, it can be concluded that there is strong positive relationship between workers’ remittances and GDP. Therefore, WR is an important factor in the economic development of Bangladesh.
- 235 -
Remittance Inflows and Its Contribution to the Economic Growth of Bangladesh (Shirin Akter)
7. Conclusion
This paper investigated the impact of workers’ remittance on economic growth through time series empirical regression and correlation analysis. From the result, we can probably conclude that workers’ remittances is an important factor in the economic development of Bangladesh and there exists a significant positive relationship between workers’ remittances and economic growth. Remittance is an important source of private capital flow. These flows could potentially become an important tool for economic development. Because, inflows of remittances have multiplier effect on different macro-economic indicators such as, poverty alleviation, mobilization of savings, boosting up investment. Capital accumulation and so on.
End Notes 1. The information about Bangladesh has been collected from Bangladesh National Information Window, Ministry of Information-Government of the People’s Republic of Bangladesh (http://www.moi.gov.bd/). 2. The term “diaspora” conveys the idea of transnational populations who may live in one place but still maintain relations with their homelands. According to the definition of Cambridge Advanced Learner’s Dictionary & Thesaurus, “diaspora” means the spreading of people from one original country to other countries. In Bangladesh, the term “diaspora” usually refers to long-term Bangladeshi expatriate populations abroad and people of Bangladeshi descent who are born abroad. 3. Currency symbol of Bangladesh is BDT (Bangladesh Taka).
- 236 -
現代社会文化研究 No.62 2016 年 3 月
Annexures Annexure-I Comparison of Source of External Funds of Bangladesh Million USD
Year Remittance
FDI
ODA
Portfolio Investment
FY-1998
1975.00
249
1057.7
3
FY-1999
1706.00
198
1192.1
-6
FY-2000
1949.00
194
1241.3
0
FY-2001
1882.10
174
1023.5
0
FY-2002
2501.10
391
1091.7
-6
FY-2003
3062.00
376
1310.5
2
FY-2004
3372.00
276
1470.7
6
FY-2005
3848.30
800
1554.4
0
FY-2006
4801.90
743
1182.1
32
FY-2007
5978.50
760
1240.5
106
FY-2008
7914.80
748
1583.8
47
FY-2009
9689.30
961
1716.0
-159
FY-2010
10987.40
913
2182.8
-117
FY-2011
11650.30
775
1605.7
109
FY-2012
12843.40
1191
1872.5
240
FY-2013
14461.20
1726
2451.9
368
FY-2014
14228.30
1550
2619.3
937
FY-2015p
15317.00
1700
3470.5
618
P=Provisional Source: Constructed from Bangladesh Bank Annual Report, BOP Data different Years
- 237 -
Remittance Inflows and Its Contribution to the Economic Growth of Bangladesh (Shirin Akter)
Annexure-II Top 10 Remittance Recipient Countries in Developing World (2004-2014)* Region/
Remittance inflow in (billion USD)
Country
2004
World
2005 2006
2007
2008
234
266
303
337
457
163
194
226
251
29
33
40
44
2009 2010
2011
2012
2013
2014e
436
453
507
531
551
582
303
333
373
400
414
435
75
82
96
108
111
117
Developing 324
World South Asia
72
India
18.75 22.13 28.33 37.22
49.98 49.20 53.48
62.50
68.82
69.97
71.00
China
6.64
47.74 41.60 52.46
61.58
57.99
59.49
64.14
15.50 16.44
18.85 19.96
21.56
23.05
24.61
26.70
28.38
23.63 27.57 38.40
Philippine 11.47 13.73 Mexico
19.83 22.74
26.54 26.88
26.04 22.08
22.08
23.59
23.37
23.02
24.23
Nigeria
2.27 14.64
16.93 18.01
19.21 18.37
19.82
20.62
20.63
20.89
21.29
Egypt
3.34 5.02
5.33
7.66
8.69
7.15
12.45
14.32
19.24
17.83
18.00
Pakistan
3.94
4.28
5.12
6.00
7.04
8.72
9.69
12.26
14.01
14.63
17.06
Bangladesh
3.58
4.64
5.67
7.26
9.22 10.74
11.28
12.96
14.24
13.86
15.05
Vietnam**
2.31
3.15
3.80
6.18
6.81
6.02
8.26
8.60
10.00
11.00
11.40
Ukraine
0.41
2.41
3.10
5.29
6.78
5.94
6.54
7.82
8.45
9.67
9.00
Indonesia
1.87
5.42
5.72
6.17
6.79
6.79
6.92
6.92
7.21
7.62
8.35
Poland
4.72
6.47
8.49
10.47 10.41
8.09
7.58
7.64
6.94
6.98
7.96
Morocco
4.22
4.59
5.45
6.73
6.89
6.27
6.42
7.26
6.51
6.88
6.82
Romania
0.13
4.71
6.67
8.46
9.29
4.88
3.88
3.89
3.67
3.52
3.63
*Data in this table are arranged according to top countries of remittance recipients in the year 2013 **Data for Vietnam in the year 2004 is collected from Annual Report, 2004 of The State Bank of Vietnam, The central bank of Vietnam.
e= Estimated value
Source: The official database of World Bank (http://data.worldbank.org/indicator).
- 238 -
現代社会文化研究 No.62 2016 年 3 月
Annexure-III Top remittance recipient countries around the world* SL
Country
No.
Remittance inflow in (billion US$) 2004
2005
2006
2007
2008
2009 2010
2011
2012 2013 2014
1.
India
18.75 22.13
28.33
37.22
49.77 49.20 53.48 62.50 68.82 69.97 71.00
2.
China
6.64
23.63
27.57
38.40
47,74 41.60 52.46 61.58 57.99 59.49 64.14
3.
Philippines
11.47 13.73
15.50
16.44
18,85 19.96 21.56 23.05 24.61 26.70 28.38
4.
France
12.26 11.95
13.03
14.45
16,28 16.06 19.46 22.56 22.05 23.34 24.73
5.
Mexico
19.83 22.74
26.54
26.88
26,04 22.08 22.08 23.59 23.37 23.02 24.23
6.
Nigeria
2.27
14.64
16.93
18.01
19,21 18.37 19.82 20.62 20.63 20.89 21.29
7.
Egypt
3.34
5.02
5.33
7.66
8.69
8.
Germany
6.58
6.87
7.48
9.77
10,97 12.34 12.79 14.52 15.14 15.20 15.99
9.
Pakistan
3.94
4.28
5.12
6.00
7.04
8.72
10. Bangladesh
3.58
4.64
5.67
7.26
9,22
10.74 11.28 12.96 14.24 13.86 15.05
11. Belgium
6.87
6.89
7.27
8.99
10,42 10.44 10.29 10.98 10.16 11.11 11.54
12. Vietnam
-
3.15
3.80
6.18
6.81
6.02
8.26
8.60 10.00 11.00 11.40
13. Spain
7.54
6.66
7.58
9.30
10.15
8.95
9.10
9.92
9.66
9.58
9.67
14. Ukraine
0.41
2.41
3.10
5.29
6.78
5.94
6.54
7.82
8.45
9.67
9.00
15. Indonesia
1.87
5.42
5.72
6.17
6.79
6.79
6.92
6.92
7.21
7.62
8.35
16. Poland
4.72
6.47
8.49
10.47
10.41
8.09
7.58
7.64
6.94
6.98
7.96
17. Morocco
4.22
4.59
5.45
6.73
6.89
6.27
6.42
7.26
6.51
6.88
6.82
18. Romania
0.132
4.71
6.67
8.46
9.29
4.88
3.88
3.90
3.67
3.52
3.63
19. UK
5.92
1.77
1.73
1.97
1.94
1.83
1.70
1.80
1.78
1.71
1.91
7.15 12.45 14.32 19.24 17.83 18.00
9.69 12.26 14.01 14.63 17.06
*country data has been arranged according to the ranking based on the year, 2014. Source: The official database of World Bank (http://data.worldbank.org/indicator).
- 239 -
Remittance Inflows and Its Contribution to the Economic Growth of Bangladesh (Shirin Akter)
Annexure-IV Empirical Data Year
GDP
GFCF
Million USD Million USD
ELF In Millions
WR
Yearly Growth Rate of
Million USD GDP
GFCF
ELF
WR
1990
31,219
5,138
35.11
778.87
-
-
-
-
1991
30,957
5,231
36.09
769.37
-0.84
1.81
2.79
-1.22
1992
31,709
5,487
36.70
911.76
2.43
4.89
1.69
18.51
1993
33,167
5,952
37.24
1,007.38
4.60
8.47
1.47
10.49
1994
33,769
6,214
37.78
1,050.88
1.82
4.40
1.45
4.32
1995
37,940
7,254
38.42
1,201.66
12.35
16.74
1.69
14.35
1996
46,438
9,627
38.97
1,344.66
22.40
32.71
1.43
11.90
1997
48,244
10,525
39.51
1,526.50
3.89
9.33
1.39
13.52
1998
49,985
11,057
40.15
1,606.08
3.61
5.05
1.62
5.21
1999
51,271
11,649
40.68
1,806.79
2.57
5.35
1.32
12.50
2000
53,370
12,707
41.29
1,967.53
4.09
9.08
1.50
8.90
2001
53,991
13,052
42.41
2,104.55
1.16
2.72
2.71
6.96
2002
54,724
13,321
43.53
2,858.06
1.36
2.06
2.64
35.80
2003
60,159
14,847
44.65
3,191.66
9.93
11.46
2.57
11.67
2004
65,108
16,272
45.75
3,583.82
8.23
9.60
2.46
12.29
2005
69,443
17,937
46.81
4,642.39
6.66
10.23
2.32
29.54
2006
71,819
18,776
47.77
5,667.36
3.42
4.68
2.05
22.08
2007
79,612
20,841
48.69
7,262.50
10.85
11.00
1.93
28.15
2008
91,631
24,009
49.59
9,222.94
15.10
15.20
1.85
26.99
2009
102,478
26,855
50.50
10,378.69
11.84
11.85
1.84
12.53
2010
115,279
30,257
51.44
11,281.69
12.49
12.67
1.86
8.70
2011
128,638
35,274
52.63
12,960.35
11.59
16.58
2.31
14.88
2012
133,356
37,689
53.68
14,236.41
3.67
6.85
2.00
9.85
2013
149,991
42,582
54.75
13,857.13
12.47
12.98
1.99
-2.66
Source: The official database of World Bank (http://data.worldbank.org/indicator)
- 240 -
現代社会文化研究 No.62 2016 年 3 月
Annexure-V Calculation for Avoiding Trend Effect of Data (Linear trend) Year Y(GDP) R(WR)
Time
Calculation Y t and Rt
logY' logR'
logY
logR
t
Y t (logY)=α+β 1 ×t*
R t (logR)=α+β 1 ×t**
1990
4.49
2.89
1
4.44
2.78
0.05
0.11
1991
4.49
2.89
2
4.47
2.84
0.02
0.05
1992
4.50
2.96
3
4.50
2.90
0.00
0.06
1993
4.52
3.00
4
4.53
2.96
-0.01
0.04
1994
4.53
3.02
5
4.56
3.02
-0.03
0.00
1995
4.58
3.08
6
4.59
3.08
-0.01
0.00
1996
4.67
3.13
7
4.62
3.14
0.05
-0.01
1997
4.68
3.18
8
4.65
3.20
0.04
-0.02
1998
4.70
3.21
9
4.68
3.26
0.02
-0.06
1999
4.71
3.26
10
4.70
3.33
0.01
-0.07
2000
4.73
3.29
11
4.73
3.39
-0.01
-0.09
2001
4.73
3.32
12
4.76
3.45
-0.03
-0.12
2002
4.74
3.46
13
4.79
3.51
-0.05
-0.05
2003
4.78
3.50
14
4.82
3.57
-0.04
-0.07
2004
4.81
3.55
15
4.85
3.63
-0.04
-0.08
2005
4.84
3.67
16
4.88
3.69
-0.04
-0.02
2006
4.86
3.75
17
4.91
3.75
-0.05
0.00
2007
4.90
3.86
18
4.94
3.81
-0.04
0.05
2008
4.96
3.96
19
4.97
3.87
-0.01
0.09
2009
5.01
4.02
20
5.00
3.94
0.01
0.08
2010
5.06
4.05
21
5.03
4.00
0.03
0.06
2011
5.11
4.11
22
5.06
4.06
0.05
0.06
2012
5.13
4.15
23
5.09
4.12
0.04
0.04
2013
5.18
4.14
24
5.12
4.18
0.06
-0.04
*α=4.411, β 1 =0.029; **α=2.716, β 1 =0.061
- 241 -
Remittance Inflows and Its Contribution to the Economic Growth of Bangladesh (Shirin Akter)
Annexure-VI Calculation for Avoiding Trend Effect of Data with 2 years’ time lag for WR Year
logY'(GDP)
logR'(WR) lagged 2 years
1992
0.00
0.11
1993
-0.01
0.05
1994
-0.03
0.06
1995
-0.01
0.04
1996
0.05
0.00
1997
0.04
0.00
1998
0.02
-0.01
1999
0.01
-0.02
2000
-0.01
-0.06
2001
-0.03
-0.07
2002
-0.05
-0.09
2003
-0.04
-0.12
2004
-0.04
-0.05
2005
-0.04
-0.07
2006
-0.05
-0.08
2007
-0.04
-0.02
2008
-0.01
0.00
2009
0.01
0.05
2010
0.03
0.09
2011
0.05
0.08
2012
0.04
0.06
2013
0.06
0.06
- 242 -
現代社会文化研究 No.62 2016 年 3 月
RFERENCES Abu Siddique, E. A., Selvanathan & Saroja Selvanathan., (2012). “Remittances and Economic Growth: Empirical Evidence from Bangladesh, India and Sri Lanka”, The Journal of Development Studies, 48(8), 1045-1062. BMET, (2015). Statistical Reports, BMET (Bureau of Manpower, Employment and Training). Ministry of Expatriates Welfare and Overseas Employment
Government
of the People’s Republic of Bangladesh. Retrived
from http://www.bmet.gov.bd/BMET/Statistical DataAction (Accessed on 15-03-2015). Bangladesh Bank, (2014).Quarterly Report on Remittance Earnings October-December 2014. Bangladesh Bank, Research Department,
External
Economics
Division.
Retrieved
from
https://www.bb.org.bd/pub/quaterly/remittance
earnings/oct dec2014.pdf (Accessed on 24-05-2015). Bangladesh Bank, (2015). Various Issues, The Central Bank of Bangladesh, Government of the People's Republic of Bangladesh, Dhaka. Retrieved from http://www.bangladesh-Bank.org/econdata/Wageremittance (Accessed on 04-02-2015). BBS, (2013). Report on Survey on the Use of Remittance (SUR) 2013, BBS (Bangladesh Bureau of Statistics), SID (Statistics and Information Division), Ministry of Planning. Retrieved from http://www.bbs.gov.bd/WebTestApplication //userfiles/Image/LatestReports/SUR_2013.pdf. Chami, R., Fullenkamp, C., Jahjah, S., (2003). “Are immigrant remittance flows a source of capital for development?”, IMF Working Paper 03/189. IMF, Washington. CPD, (2014), Country Illustration Report: Bangladesh. Centre for Policy Dialogue (CPD), Bangladesh. European Report on Development, 2014: Counry Illustration Workshop. Retrived from http://cpd.org.bd/index.php/erd-countryworkshop-erd-on-development-2014/(Accessed on 30-07-2014 ) Das, A., and Chowdhury, A., (2011). “Remittances and GDP Dynamics in 11 Developing Countries: Evidence from Panel Cointegration and PMG Technique”, Romanian Economic Journal, 14, 3–24. Datta, K.,
and
Sarkar, B., (2014). “Relationship between Remittances and Economic Growth in Bangladesh: An
Econometric Study”, Bangladesh Development Research Working Paper Series.BDRWPS-19. Bangladesh Development Research Center (BDRC) Bangladesh. http://www. Bangladeshstudies.org/wps/. Giuliano, P., & Ruiz-Arranz, M., (2005). “Remittances, Financial Development and growth”, IMF Working Paper, WP/05/234.http://www.imf.org/external/pubs/ft/wp/2005/wp05234.pdf(Accessed on 15-06-2015) GoB, (2013).
Flow of External Resources into Bangladesh. Government of Bangladesh (GoB), Dhaka: Economic
Relations Division (ERD), Ministry of Finance, Government of Bangladesh.
- 243 -
Remittance Inflows and Its Contribution to the Economic Growth of Bangladesh (Shirin Akter)
ILO, (2014).
Reinforcing Ties: Enhancing Contributions from Bangladeshi Diaspora Members, International Labour
Organization, ILO Country Office for Bangladesh. – Dhaka. Retrived from http://www.ilo.org/wcmsp5/groups/public/ ---asia/---ro-bangkok/---ilo-dhaka/documents/publication/wcms_308803.pdf (Accessed on 31-12-2014 ). IOM, (2005). “Dynamics of Remittance Utilization in Bangladesh”, IOM Migration Research Series.No.18 International organization
for
Migration,
Geneva,
Switzerland.
Retrived
from
http://publications.iom.int/bookstore/ free/MRS_18.pdf. IOM, (2009). IOM and Remittances, International Organization for Migration. Retrieved from http://publications.iom.int /systemem/files/pdf/iom/files/pdf/iom_and_remittances.pdf. Iqbal, Z., & Sattar, A., (2005). The Contribution of Workers’ Remittances to Economic Growth in Pakistan, Research Report, Pakistan Institute of Development Economics. Retrived from http://www.pide.org.pk/Research/Report187.pdf. Jawaid, S. T., & Raza, S. A., (2012). “Workers' remittances and economic growth in China and Korea: an empirical analysis”. Journal of Chinese Economic and Foreign Trade Studies, 5(3), 185–193. Jawaid, S. T. and Raza, S. A., (2014). “Effects of Workers' Remittances and its Volatility on Economic Growth in South Asia”, International Migration. (http://onlinelibrary.wiley.com/doi/10.1111/imig.12151/epdf). Moody’s Report, (2014).Credit analysis Bangladesh Government of. Moody’s Investor Service Moody’s Corporation, Moody’s Investors Service, Inc., Moody’s Analytics. (https://www.bb.org.bd/openpdf.php) Paul, B.P., and Das, A., (2011). “The Remittances Remittance-GDP Relationship in the Liberalized Regime of Bangladesh: Cointegration and Innovation Accounting”, Theoretical and Applied Economics, 18(9): 41–60. Rao, B. B. and Hassan, G. M., 2012. “Are the Direct and Indirect Growth Effects of Remittances Significant?”, World Economy, 35, 351–372. Ratha, D., & Mohapatra, S., 2007. Increasing Marco Economic Impact of Remittances on Development. Development Prospect Group, The World Bank. (http://dilipratha.com/index_files/G8Berlin.pdf) Siddiqui, T., 2003. Migration as a Livelihood Strategy of the Poor: the Bangladesh Case, Paper presented at the Conference on Migration, Development and Pro-poor Policy Choices in Asia, Dhaka, 22-24, June. Retrieved from http://livelihoods.org/hot_topics/docs/Dhaka_CP_5pdf. Standard & Poors’ Report, (2014). Research Update: Ratings On Bangladesh Affirmed At 'BB-/B', Outlook Stable 2014. Standard & Poor's Financial Services LLC, a part of McGraw Hill Financial. (https://www.bb.org.bd/openpdf.php). UN. (2011), Impact of Remittances in Poverty in Developing Countries. United Nations Conference on Trade and Development. Retrieved from (http://unctad.org/en/Docs/ditctncd20108_en.pdf) Waheed, A., & Aleem, A., (2008). “Workers’ remittances and economic growth: empirical evidence from Pakistan”,
- 244 -
現代社会文化研究 No.62 2016 年 3 月 Journal of Social Science and Humanities, 47(1), 1–12. World Bank, (2014). The World Bank Migration and Development Brief. 23, Migration and Remittances Team, Development Prospects Group. Retrieved from http://sitesources.worldbank.org/INTPROSPECTS/Resources. World Bank, (2015). World Tables. Various Issues. Washington, DC. Retrived from http:// data.worldbank.org .(Assessed on June 2015). 主指導教員(佐藤芳行教授)、副指導教員(石川耕三准教授・厳成男准教授)
- 245 -