J. Appl. Environ. Biol. Sci., 4(2)316-326, 2014
ISSN: 2090-4274
© 2014, TextRoad Publication
Journal of Applied Environmental and Biological Sciences www.textroad.com
Removal of Lead Ions from Aqueous Solution Using Multi-Walled Carbon Nanotubes: The Effect of Functionalization Mohammad Saber Tehrani1 , Parviz Abroomand Azar1, Parvin Ehsani namin1* , Shahram Moradi Dehaghi2 1
Department of Chemistry, Faculty of Basic Sciences, Science and Research Branch, Islamic Azad University, P.O. Box 1415-775, Tehran, Iran 2 Faculty of Chemistry, Tehran North Branch, Islamic Azad University, Tehran, Iran Received: December 23 2013 Accepted: January 18 2014
ABSTRACT This study evaluates the lead adsorption efficiency of pristine multi walled carbon nanotubes (raw-MWCNTs), oxidized multi-walled carbon nanotubes (o-MWCNTs) and functionalized multi-walled carbon nanotubes with Tris (2-aminoethyl) amine ( MWCNTs- TAA) from aqueous solution. Functionalization reactions were accomplished using acid treatment. MWCNTs- TAA and o-MWCNTs were characterized using scanning electron microscopy (SEM), Fourier transform infrared (FTIR), Raman spectroscopies, and thermal gravimetric analyzer (TGA). The results indicated that the oxidation and functionalization reactions successfully occurred. The adsorption of Pb(II), onto nano particles were investigated using batch equilibrium adsorption experiments and determined by the flame atomic absorption spectrometry (FAAS). The effects of pH, contact time, initial Pb(II) ions concentration, and adsorbent dosage on the adsorption process were studied. The obtained results revealed that removal of Pb(II) ions from water strongly depends on the pH of the sample solution. Maximum adsorption capacities of Pb(II) ions under the optimal conditions were 6.7, 27.8, 71 mg/g for raw- MWCNTs, oMWCNTs and MWCNTs-TAA respectively. This means that oxidation and functionalization reactions leads to higher adsorption capacity in comparison to raw- MWCNTs. Regarding to desorption experimental, regenerated MWCNTs can be reused over four times without considerable loss of adsorption capacity. The obtained data were fitted with the Langmuir and Freundlich isotherm adsorption models. It was found that the Langmuir equation can satisfactorily explain the experimental data obtained for Pb(II) for all of the used sorbents. KEYWORDS: Oxidized multi-walled carbon nanotubes; functionalized multi-walled carbon nanotubes; Adsorption isotherm models; Flame atomic absorption spectrometry. 1. INTRODUCTION Lead is the most pollutant entering human life through industrial waste water and causes different illness. The main source of lead pollution in the water is originated from industrial process. Since this pollutant is nonbiodegradable, it remains in the environment and causes serious illness such as nervous system damage, kidney disease, mental retardation and cancer[1-3]. There are various methods including chemical precipitation, ion exchange, membrane filtration and adsorption for lead removal from waste water [4-7]. Due to the simplicity, efficiency, and widespread application; adsorption process has been considered by scientists [8]. In addition, adsorption process is sometimes reversible and adsorbents can be regenerated using proper desorption process. Many attempts have been done for application of nanoparticles such as carbon nano tubes in adsorption processes [9-11]. Because of unique properties such as high ratio of surface to volume, light weight, strength, large external surface area, internal sites nanotubes, and capability of π-π electrostatic interaction; these materials can be good candidates for adsorption process [12]. However, performance of these nanoparticles is limited because of their agglomeration and poor dispersion, which result from the van der Waals bonds among the graphene sheets. This drawback can be overcome by surface functionalization [13-15]. Different methods for functionalization of carbon nanotube have reported in the literature such as non-covalent functionalization [16], covalent functionalization [17], and defect functionalization [18]. The most common and the simplest method is defect functionalization. In this method, under the oxidized treatment by various reagents (e.g.,nitric acid, sulfuric acid , ammonium hydroxide and hydrogen peroxide), functional containing oxygen groups such as carboxylic, carbonyl,and hydroxyl are created on the surface of the nanoparticles [19-20]. Many researchers have been reported defect functionalization of carbon nanotubes for uptake of pollutants such as cadmium [21], zinc [22], hexavalent chromium [23], nickel [24], lead [25], copper [26], herbicide [27], and phenols [28]. Regarding to above reports, the o-MWCNTs can be a good sorbent for organic and inorganic pollutants.
*Corresponding Author: Parvin Ehsani namin, Department of Chemistry, Faculty of Basic Sciences, Science and Research Branch, Islamic Azad University, P.O. Box 1415-775, Tehran, Iran. Email:
[email protected] 316
Tehrani et al., 2014
Another technique to enhance dispersion of carbon nanotubes is covalent functionalization, which generates functional groups on the surface of nano particles. In general, defect modifications on the surface of carbon nanotubes are firstly made by strong acid and further modifications are accomplished by various molecules that can be grafted through creation of amide, ester, and amine bonds. 1-(2-pyridylazo)-2-naphtol [29], thiosemicarbazide [30], 2-aminobenzothiazole [31], phenyl-iminodiaceticacid [32],ethyenediamine[33], diethylenetriamine,triethylenetetrami [34], poly(2-aminothiophenol) [35], and tris(2-aminoethyl)amine [36] are the typical molecules which have reported in the literature as functionalization agents. The main goal of this study is the assessment of lead adsorption efficiency of raw-MWCNTs, oMWCNTs and MWCNTs-TAA from aqueous solution. The oxidation and functionalization reactions were monitored using SEM, FTIR, Raman spectroscopies and TGA analyzer. FAAS was used to determine lead concentration in samples. The effects of pH value, sorbent dosage, and contact time on the adsorption process were studied. Adsorption capacity was measured via the batch method. Adsorption mechanism was also studied for three types of sorbent. To better understanding the adsorption process, the obtained data were simulated by Langmuir and Freundlich isotherm models. 2. EXPERIMENTAL 2.1. Materials High purity reagents from Sigma Aldrich and Merk were used for the preparation of all solutions.MWCNTs was purcheased from Cheaptubes Inc. (USA) with 10-20 nm in outer diameter, 30 nm in length, and >95% purity. Other reagents including concentrated HNO3, thionyl chloride (SOCl2), dimethyl formamide (DMF), dichloromethane (DCM), triethylamine, and tris(2-aminoethyl) amine were from Sigma Aldrich. Lead stock solution (1000 mgL-1) was prepared by dissolving its an appropriate amount nitrate salt (analytical grade) in deionized water. The solution was then diluted to the required concentrations for the sorption measurements. Laboratory glassware used were repeatedly washed with 5% v/v HNO3 and rinsed with deionized water. 2.2. Instruments and apparatus The morphology of MWCNTs was observed by Tescan VEGA-II scanning electron microscope. A Varian Model spectra AA.200 atomic absorption spectrometer equipped with single element hollow cathode (HCL) lamps, deuterium background correction, and air-acetylene was used for Pb(II) measurements. Lead HCL was used as the radiation sources at the wavelength of 217nm. The instrumental parameter adjustments were those recommended by the manufacturer. TGA thermograms were obtained by a TGA-7HT from Perkin Elmer (USA) under N2 and in the range of 25-700 °C by ramp of 10 °C/min. The functional groups on the surface of carbon nanotubes were detected by an EQUINOX 55 FTIR spectrometer. The pH values were adjusted with a Metrohm digital pH meter. The structural information of nano particles was evaluated by a Raman Spectrometer; Model Almega Thermo Nicolet Dispersive Raman Spectrometer. 2.3. Sorbents preparation The MWCNTs and 250 mL HNO3 were dispersed for 45 min in an ultrasonic bath (35 KHz, 70 W). The reaction flask equipped with a reflux condenser, a magnetic stirrer and a thermometer was mounted in the oil bath. The suspension was stirred at 110 °C for 48 h and 50 mL of sulfuric acid and hydrogen peroxide mixture were then added to the solution and sonicated for 10 min. The mixture was cooled to the room temperature and was vacuum filtered. The mixture was then washed with deionized water until a neutral pH of the filtrate was reached. The o- MWCNTs were dried in a vacuum oven at 105 °C overnight. In the next steps, the 300 mg of obtained o-MWCNTs was suspended in 20 mL thionyl chloride and stirred at 70 °C for 24 h. Using DCM, the mixture was diluted and filtered under vacuum condition. Washing by DCM was continued until the filtrate became colorless. The obtained solid filtrate (MWCNTs-COCl) was dried in a vacuum oven at 40 °C. The dried MWCNTs-COCl was dispersed into 50 mL anhydrous DMF, and then 15 mL tris(2-aminoethyl) amine and 3 mL triethylamine were added. The mixture left to stir at 50°C for 36 h. The mixture was filtered through an appropriate filter. To eliminate of the unreacted materials, the filtrate was washed by DMF until the colorless DMF was observed. Finally, the filtrate was rinsed using ethanol and put under vacuum oven at 80 °C for 12 h [19,36]. In all aforesaid processes due to applied mild conditions, the structure of MWCNTs was not changed. 2.4. Procedure The adsorption experiments were performed in the polyethylene test tubes using batch method. A portion of the sample solutions (10 mL) including Pb(II) ions, transferred into tubes. The desired pH values were adjusted with addition of HNO3 or NaOH (0.1-0.01 mol L-1 concentration). 10 mg of the adsorbent was then added to the solution and the mixture was shaken at 160 rpm for 45 min. To separate of the adsorbent, after centrifuge at 1600 rpm for 15 min the mixture was filtered using 0.45 µm membrane filters. The concentration
317
J. Appl. Environ. Biol. Sci., 4(2)316-326, 2014
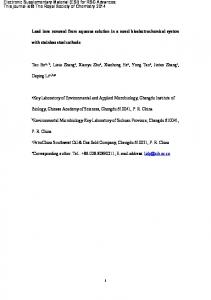
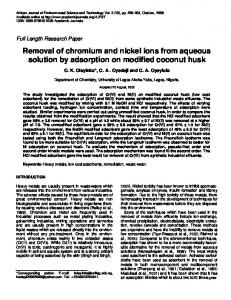
of Pb(II) ions in the solution was determined by FAAS.The percentage of removed Pb(II) ions (R) was determined as follows [27,37]: (1) % R = (C 0 - C t )/C 0 × 100 where C0 is the initial concentration of Pb(II) ions in mg L-1, Ct is the concentration of Pb(II) ions at time t in mg L-1. 3. RESULTS AND DISCUSSIONS 3.1. Characterization of functionalized MWCNTs SEM micrographs of raw- MWCNTs and o- MWCNTs are demonstrated in Figure 1. It is obvious that the separated carbon nanotubes have cylindrical shape with the external diameters in the range of 20-30 nm. Some aggregations can be detected in this micrograph because of intermolecular forces among the MWCNTs with different shapes and directions. It seems the acidic treatment has no significant effect on the shape and size of MWCNTs and only a smoother surface is obtained.
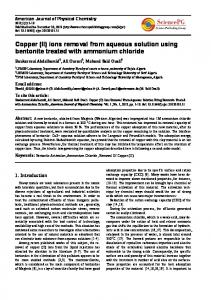
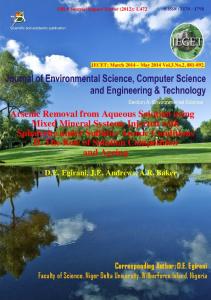
Figure1: SEM micrographs of a) raw-MWCNT b) O-MWCNT The FTIR spectra of raw- MWCNTs, o-MWCNTs and MWCNTs–TAA are compared in Figure 2. In the FTIR spectrum of o-MWCNTs, the bands at 1400 and1710cm-1 can be attributed to the stretching vibrations of O-H and C=O bending of carboxyl groups, while the band at 1080 cm-1 is assigned to the – CO - stretching vibration of ester group. Moreover, existence of broad peak in 3450 cm-1 implies to OH group, which means that oxidation of the MWCNTs have induced functional groups such as carboxyl and hydroxyl on the surface of nano particles. In the FTIR spectrum of MWCNT-TAA a peak appears at 1580 cm-1, which is originated from C-N stretching and N –H bending vibration [36]. Presence of this bond indicates grafting of TAA on the surface of o-MWCNTs.
318
Tehrani et al., 2014
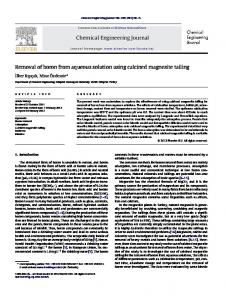
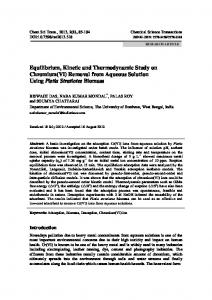
Figure 2: FTIR spectra of the samples TGA analysis present useful information about the functionalization reactions due to thermal instability of organic groups in the samples. Thermograms of the samples are shown in Figure 3. As can be seen, rawMWCNTs is stable and hardly decompose below 700°C while the weight of o-MWCNTs and MWCNTs-TAA decrease. Decomposition of o-MWCNTs occurs gradually in the applied range of test. The first weight loss about 100°C was related to elimination of physically adsorbed water. The further weight loss (6%) in the thermogram was related to organic functional groups which is an confirmation for oxidation reaction. The trend of weight loss for MWCNTs-TAA is moderate and faster than that of o-MWCNTs up to 450 °C due to decomposition of TAA. Above 450 °C, the decomposition rate of MWCNTs-TAA is slow and may be attributed to degradation of unreacted - COOH groups. Residuals of the o-MWCNTs and MWCNTs-TAA at 450 °C were 6 and 9 wt. %, respectively.
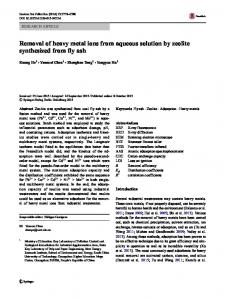
Figure 3: TGA thermograms of the samples Another method for assessment of functionalization reaction is Raman spectroscopy.[38-39]. Figure 4 shows the Raman spectra of the samples. Two main peaks in the Raman spectra were appeared in the samples at 1339 and 1580 cm-1 which are known as D and G bonds, respectively. D band is related to disordered carbon atoms of MWCNTs corresponding to sp3-hybridized and G band shows the sp2-hybridized of carbon atoms in
319
J. Appl. Environ. Biol. Sci., 4(2)316-326, 2014
the graphene sheets. Area ratio of the D to G bands (ID/IG) can be used to assess the amount of defects in nano particles structure. This ratio was decreased for o-MWCNTs (ID/IG =1.27) in comparison to raw- MWCNTs (ID/IG =1.46) because of elimination of amorphous carbon during acid treatment. In other words, ID/IG is balanced by two factors which the functionalization reaction leads to higher ID/IG ratio while the purification in oxidation reaction lowers this ratio. ID/IG ratio was increased for MWCNT-TAA (ID/IG=1.5) which approves the successful conversion of o-MWCNTs to MWCNTs-TAA. In the absence of amorphous carbon, the increase of ID is related to increase of carbon containing sp3-hybridized and implies to successful functionalization reaction.
Figure 4: Raman spectra of the samples 3.2. Evaluation of adsorption The adsorption behavior of Pb(II) on raw- MWCNTs, o-MWCNTs and MWCNTs–TAA was studied at pH values in the range of 2-11 using either NaOH (0.01-0.1mol L-1) or HNO3 (0.01- 0.1mol L-1) for pH adjustment and is shown in figure 5.
Figure 5: Adsorption capacity of lead ions at various pH values There are four probable forms of lead at different pH values: Pb2+, Pb(OH)+1, Pb(OH)2, and Pb(OH)3- [40]. At pH