Table 1. Dyes, their supplier, type, formulae and code used in this study. ... Chemical â Azo ..... El-Geundi, M.S., Color removal from textile effluents by adsorption ...
Environmental Technology, Vol. 24. pp 821-829 Selper Ltd, 2003
REMOVAL OF TEXTILE DYES FROM AQUEOUS SOLUTIONS BY ADSORPTION ON BIODEGRADABLE WASTES
MARÍA P. ELIZALDE-GONZÁLEZ*, ALEJANDRA A. PELÁEZ-CID
Centro de Química. Instituto de Ciencias. Universidad Autónoma de Puebla. Apdo. Postal J-55. Puebla, Pue. 72571, México
(Received 20 May 2002; Accepted 19 December 2002)
ABSTRACT The adsorption of the textile dyes Basic Blue 41, Aniline Blue, Reactive Black 5 and Mariposa Blue was studied from model solutions prepared in distilled water in the concentration range up to 2 g⋅ l-1. Biodegradable wastes were used and are proposed here as adsorbents due to their abundance and inexpensiveness in the authors’ country. The influence of the particle size, pH, presence of an electrolyte in the dye solution, adsorbent activation and competition in ternary dyes mixtures was determined in this study. Adsorption capacity of the adsorbents designated as HOMAP and POMAP with particle diameter less than 3 mm for the Basic Blue 41 dye was found to be 164 and 77 mg⋅ g-1, respectively. The efficiency of the prepared adsorbents for removing basic, acid and reactive dyes with concentration 400 mg⋅ l-1 was examined. A comparison of the adsorption capacity and desorption feasibility of the adsorbents was made. The basic dye was adsorbed with efficiencies varying from 87 - 98%, the reactive dye was removed in the range 60 - 98% and the acid dye, 60 – 70% by three of the four adsorbents tested in this study. The determination of adsorption equilibrium concentrations was followed by HPLC with diode array detection.
Keywords: Adsorption, textile dye removal, biodegradable wastes, corncob waste, coconut waste
an effective method for color removal from aqueous streams [7, 8], whereby activated carbon is the most widely used adsorbent in this process. Due to its high cost, carbon is now prepared from digested sewage and wastes [9-12]. In fact, research has been aimed at other non-conventional materials for color removal [13]. Some characteristics of these materials are: effectiveness, easy acquisition and low cost [14]. One may find today the use of agro-industrial byproducts or wastes such as orange peel [15], palm fruit particles [16-18], sunflower stalks [19], sugar bagasse [14], barley husk [20] and corncobs [14, 20]. None of the cobs tested in [14, 20] were subject to any form of pretreatment prior to use and the cobs taken by authors in [20] were regarded as waste, while in [14] there is no indication whether entire cobs or cob wastes after threshing were used. The aim of the present study was to assess the feasibility of some low-cost adsorbents before and after activation to adsorb dyes of regional concern.
INTRODUCTION Dyes are chemical compounds produced in large quantities and are used in many industries such as textile, alimentary, cosmetics, paper, etc. The textile industry is the largest consumer of these products, which accounts for more than 50% of the world’s dyestuff market [1, 2]. Actual dyeing techniques and the fixation degree have improved in the last ten years. However, recent estimates indicate that at least 12% of the synthetic textile dyes used annually are lost in waste processing operations. Approximately 20% of these losses enter the environment through effluents from wastewater treatment plants [3]. Discharge of colored wastes into natural bodies of water is undesirable for several reasons. For example, the aesthetic quality of the water is diminished. Furthermore the effect of this discharge can be devastating to the health of its consumers, since many manufacturing precursors and degradation products have proven to be toxic or carcinogenic [4, 5]. Dyes do not belong to one group of chemical compounds. For this reason, color removal from textile wastewaters is a serious environmental problem, due to the complexity of treating such waters by conventional methods of wastewater treatment [1]. Therefore, it is necessary to implement tertiary treatments to remove color before discharging the textile wastewater into natural streams [6]. The adsorption method has shown to be
MATERIALS AND METHODS Materials Dyes The dyes researched in this study were chosen on the basis of their extended regional use. Some of their
821
Environmental Technology, Vol. 24. pp 821-829 Selper Ltd, 2003
globular particles had a diameter greater than 3 mm. FICAP1 and FICAP2 were not sieved because of their fibrous texture.
characteristics and the designation we used are shown in Table 1. They were used without prior purification and according to the chromatographic analysis we performed, their purity varied from 70% (ANB dye) to 95% (CNB dye).
Methods Adsorbents The biodegradable wastes used as adsorbents were collected in Puebla, a central state of Mexico. The adsorbents used were given the following names: HOMAP, POMAP, CASCAP, FICAP1 and, FICAP2. HOMAP and POMAP have corncob waste in common and differ on the activation process. CASCAP, FICAP1 and FICAP2 were prepared by using coconut waste as raw material. They were collected, dried, ground, activated [21, 22] and washed gently with deionized water. Activation comprises immersion into a warm bath containing a mixture of cleaning fluids [22]. The adsorbent FICAP2 was not activated, only washed. Drying was accomplished at room temperature for a couple of days and then in an oven at 50°C for 24 hours. Finally, they were sieved and classified. The particles of HOMAP and POMAP were flake-like and were used with a particle size less than 3 mm and greater. The CASCAP
Adsorption isotherms were measured with the static method at a room temperature (25 °C). A determined amount of adsorbent was introduced into polycarbonate cylindrical cells with a lid, and placed in contact with a measured volume of the aqueous dye solutions of a known concentration, between 200-2000 mg⋅l-1. Adsorption equilibrium was then reached. The dye solution that resulted from the adsorption equilibrium was then separated from the exhausted adsorbent and analyzed by high performance liquid chromatography (HPLC) at the wavelength of maximum absorbance (λmax) for each dye. The pH of the dye solutions was regulated with a phosphate buffer and with tetraborate buffer solutions. Solutions of NaCl, Na2SO4 and Na2PO4 0.1 M solutions were used as electrolytes.
Table 1. Dyes, their supplier, type, formulae and code used in this study. Name and Code Sandocryl Blue (SAB)
Color Index Basic Blue 41
Molecular Weight
Structural Formulae
Classification
Supplier
S H3CO C
N
N
CH3
N
450.5
OCH3
CH3
11154
Chemical – Monoazo
CH2CHCH2OCH3 Cl
N
Clariant Textile – Basic
C21H27O3N4SCl NHC2H2SO3-
Aniline Blue (ANB)
C
42755
SO3Na
SO3Na
749
Chemical – Triarylmethane
Monterrey
NH
NH
Textile – Acid C33H25O9N3Na2S3 O O + Na O S O (CH2)2 S
Cibacron Navy Blue (CNB)
O
N N
- + SO3 Na
O HO
Reactive Black 5
991
H2N O
O
+ Na O S O (CH2)2 S O O
N N
Chemical – Azo Sulfonated
Ciba
Textile – Reactive
+ SO3- Na
C26H21O19N5Na4S6 Mariposa Blue* (MAB) *Lacking technical information
822
Colorim
Environmental Technology, Vol. 24. pp 821-829 Selper Ltd, 2003
Milli-Q reagent grade water system. Phosphate buffer was prepared using reagent grade salts from J.T. Baker.
Desorption was measured by immersing an exhausted and dry adsorbent into a water-methanol mixture (1:1) in a mass to volume relation m/V = 0.02 g⋅ ml-1. The mixture was shaken for one hour and the concentration of the released dye was measured using HPLC.
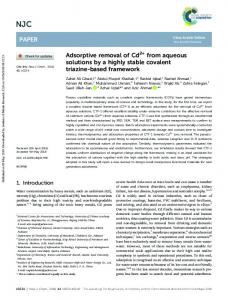
RESULTS AND DISCUSSION Kinetics, particle size, activation and pH The unrelated adsorbents HOMAP and CASCAP were chosen to determine the contact time needed in order to reach the adsorption equilibrium between the prepared solids and a dye in solution. It was necessary to determine the contact time, since at this moment the adsorption efficiency of an adsorbent is at it’s maximum. By using the SAB dye at a concentration 300 mg⋅l-1, the adsorption kinetics was followed and is shown in Figure 1. On CASCAP total adsorption (92%) was reached after 50 hours of contact, while on HOMAP 99.7% adsorption remained constant after 10 hours. In contrast, in the case of the corncob residues reported in [21], equilibrium was obtained after 48 hours. Considering that the adsorption process is faster for HOMAP than for CASCAP, contact times of 72 hours and 24 hours were established for CASCAP and for the similar adsorbents HOMAP, POMAP and FICAP respectively. In addition we studied the effect of particle size as a definitive factor in all adsorption processes, since particle diameter determines indirectly the magnitude of the specific surface area of the solid and hence the adsorbed quantity. The inset in Figure 1 depicts adsorption isotherms of the dye SAB on HOMAP with a particle size less than 3 mm and greater.
Chromatographic analysis The chromatographic system consisted of a Model Constametric I pump (LDC/Milton Roy), a Model 7125 syringe loading sample injector (Rheodyne) with a 20 µl loop and a Model 994 programmable photodiode array detector (Waters) operated at λmax for each dye. The analysis [23] was performed on Beckman columns with 5 µm packings: Ultrapore Octyl (7.5 cm x 4.6 mm I.D.) for the individual dye solutions and Ultrasphere Octyl (15 cm x 4.6 mm I.D.) for the three-component mixture. The equilibrium concentrations of adsorption were determined by interpolating in the following calibration curves: CSAB = Ap / 0.0023 (R2 = 0.9994), CMAB = Ap / 0.0002 (R2 = 0.9761), CCNB = Ap / 0.5231 (R2 = 0.9981), where C is the concentration of the corresponding dye solution, Ap is the area of the chromatographic peak and R2 is the correlation coefficient of the adjusted calibration curve. Mobile phase composition was Methanol-Buffer (1:1). The mobile phase was prepared by mixing equal volumes of methanol and buffer solution KH2PO4 - Na2HPO4 with pH 5. The HPLC-grade methanol acquired from Fermont. Water was obtained by using a
100 100 -1
75
a, mg g
% Adsorption
75
50
50
25 0
25
0
100
0 0 Figure 1.
24
48
72 Time, hr
200 300 -1 Ceq, mg l
96
120
400
144
Adsorption kinetic curves of the dye SAB by the adsorbents HOMAP (!) and CASCAP (!). Inset: Adsorption isotherms of SAB by adsorbents with different particle size: HOMAP < 3 mm ("), HOMAP > 3 mm (#) and POMAP < 3 mm ($). Mass to volume relation 1 : 10.
822
Environmental Technology, Vol. 24. pp 821-829 Selper Ltd, 2003
The results clearly show that the smaller HOMAP particles adsorbed almost twice the quantity that was adsorbed by the larger ones for a given dye concentration, for example 100 mg⋅ l-1. When comparing POMAP and HOMAP in the inset in Figure 1, the same particle diameter was used and prepared by utilizing the same raw material, the activation procedure however differed. We were therefore able to find evidence of the effect of activation on the production of different porosities. HOMAP < 3 mm was probably more porous than POMAP < 3 mm due to the distinct activation and therefore, could adsorb a greater amount of the dye SAB. In the case of the adsorption from solutions, the discussion of the adsorption isotherms can focus on the twoparameter Langmuir (i) and Freundlich (ii) adsorption equations,
a=
K L a m C eq
The Freundlich model does not consider that the coverage must approach a constant value corresponding to one complete monolayer, but implies that the energy distribution for the adsorption sites is exponential. Highly energetic sites bind the adsorbed solute strongly, whereas the less energetic ones bind weakly. Here the parameter 1/n can be considered a descriptor of the heterogeneity of the surface energy distribution. The adsorption-desorption rate varies according to the energy of the sites, which leads to the possibility of more than one monomolecular layer and to a different shape of the adsorption isotherm. Deviations of 1/n from the unity yield concave (1/n < 1 or n > 1) or convex (1/n > 1 or n < 1) isotherms, when 1/n = 1 the isotherm is linear. From the Freundlich equation (ii) one can see that the KF values correspond to the adsorption magnitude at an equilibrium concentration Ceq = 1. The values of the adsorption parameters KL, am, KF and n are presented in Table 2. At Ceq = 1 mg⋅ l-1 for the same particle size (< 3 mm) POMAP adsorbs 0.0101 g⋅g-1 which means it can adsorb the SAB dye in an amount equal to 1.0% of its own weight. In contrast, HOMAP adsorbed 0.0039 g⋅g-1 or 0.4 wt % SAB. Although all three adsorption isotherms in Figure 1 were of the L type, according to the Giles classification [24], they present different curvature and some intersections indicating a different adsorption mechanism, a different orientation of the adsorbed molecules, or both occurrences. Therefore even if all three adsorption isotherms indicated that the proposed adsorbents have a high affinity for the SAB dye, both textural and chemical characteristics of the surface determine the adsorptive features of HOMAP and POMAP upon a solute, which is subject to more specific interactions with the surface than gas molecules conventionally used in gas adsorption. At high SAB concentrations the adsorption capacity expressed as am is smaller for POMAP than for HOMAP, whereby greater particle sizes present larger am values. POMAP having the largest n parameter value presents probably the most heterogeneous surface. From the values reported in Table 2, we can conclude that particle size of the prepared adsorbents exhibited a greater
(i)
1 + K L C eq
a = KFCeq1/n
(ii)
where parameters can be evaluated by fitting the data: equilibrium concentration Ceq and adsorbed amount a, by linear regression. The Langmuir isotherm refers to the ideal case adsorption on a homogeneous surface, but the real surfaces are heterogeneous. Furthermore, the Langmuir theory assumes that adsorption occurs at definite localized “sites” on the surface. In addition because the number of sites per unit weight of the adsorbent is finite, adsorption can take place until every site is occupied. This situation may correspond to the condition of one monomolecular layer of coverage of the adsorbed molecules on the surface denoted as am. Physically, the Langmuir constant KL represents the ratio of the adsorption and desorption of kinetic constants.
Table 2. Adsorption constants of the dye SAB obtained by the application of Langmuir and Freundlich adsorption isotherm equations on HOMAP and POMAP adsorbents. Adsorbent
am, mg⋅ g-1 76.9 163.9 285.7 water (without 78.6
POMAP < 3mm HOMAP < 3mm HOMAP > 3mm POMAP / in electrolyte) POMAP / in NaCl solution POMAP / in Na2SO4 solution POMAP / in Na2PO4 solution
62.1 89.3 85.5
Langmuir KL, l g-1 0.035 0.012 0.002 0.034
R2 0.9798 0.9805 0.9992 9.9202
n 2.94 1.43 1.14 2.82
Freundlich KF 10.15 3.92 0.67 9.66
R2 0.9888 0.9676 0.9988 0.9937
0.007 0.004 0.011
0.9905 0.9551 0.9947
1.96 1.70 1.86
2.01 1.51 2.72
0.9300 0.8942 0.9562
821
Environmental Technology, Vol. 24. pp 821-829 Selper Ltd, 2003
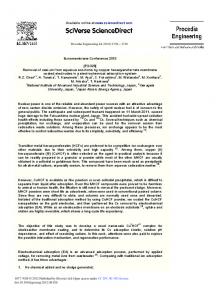
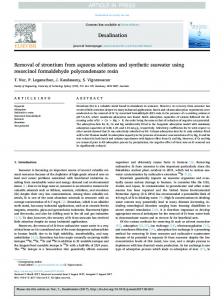
but a smaller slope indicated a different isotherm curvature. Therefore distinct kinetics occurred, which were influenced by diffusional processes due to the lack of activation in FICAP2. The results obtained by varying the mass to volume relation highlighted the effect of activation in this particular case. Besides that, we were able to interpret that when the volume of dye solution is fixed and the adsorbent mass is not, a smaller amount of activated FICAP1 can be used to obtain the same adsorption efficiency, which in turn leads to optimization of the adsorbent mass and economy. In the textile industry, the use of salts that improve the cloth’s dyeing is common. As a result, the wastewater is a complex mixture of several chemicals in addition to the dyes. To determine the influence on adsorption when an electrolyte was present in the dye solution, the adsorption isotherms of SAB by POMAP at three different pH values and in presence of two different electrolytes were constructed and are shown in Figure 3. The graph in Figure 3A showed evidence of the anionic character of the POMAP surface, since the basic dye SAB was adsorbed to a greater extent in a basic medium (pH 9.5). The set of adsorption isotherms depicted in Figure 3B indicated that the presence of the electrolytes inhibited the adsorption of SAB on POMAP in the following order: Cl- > SO42- > PO42,- which is exactly the inverse tendency observed for acid dyes [25]. In the case of a basic dye, chloride had the opposite effect when adsorption was studied on activated clay [26]. This fact appeared to show not merely the
effect on adsorption than that observed for palm-fruit particles [16]. In the case of our adsorbents it is also possible to regulate the size in order to achieve the desired results. When comparing the maximum adsorption capacity of HOMAP with any particle size against the basic dye Basic blue 41 versus the basic dye Maxilon red in regards to the capacity of corn cob and bagasse pith reported in [14], values were much higher for the Maxilon red dye. However, when using palm-fruit particles [16] a comparable amount of dye was adsorbed by the HOMAP > 3 mm particles. For further analysis of the influence of activation in several other adsorbent samples obtained from the same raw material with (FICAP 1) and without activation treatment (FICAP 2), we measured the adsorption isotherms of the dye SAB presented in Figure 2 in logarithmic scale. The graph shows two different relationships of adsorbent mass per volume of dye solution (m/V), where a > b. Lines (triangles) are close to each other and run parallel when the (m/V)a relation was used indicating very similar adsorption isotherms and thus adsorption constants. When the mass of the FICAP1 and FICAP2 adsorbents was kept constant and the volume of the SAB solution in contact with it was five times greater in the second mass to volume relation (m/V)b two different curves (circles) were obtained. Here FICAP2 in (m/V)b exhibits a smaller slope, but higher values than FICAP2 in (m/V)a,. FICAP1 in (m/V)b presents a similar slope and larger adsorption values than FICAP1 in (m/V)a. Larger adsorbed amounts can simply be explained by the fact that there was more adsorbable dye in a larger volume,
2.0
log a
1.5 1.0 0.5
0.5
1.0
1.5
2.0
log Ceq Figure 2.
Effect of the activation procedure of the adsorbents of the series FICAP on the adsorption of SAB, for two different mass to volume relationships (m/V). FICAP1 ($) and FICAP2 (!) for the relation (m / V)a. FICAP1 (") and FICAP2 (#) for (m / V)b.
822
Environmental Technology, Vol. 24. pp 821-829 Selper Ltd, 2003
100
B
A
a, mg g
-1
75 50 25 0 0
250
500
750
1000 0
250
500
750
1000
-1
Ceq, mg l
Adsorption isotherms of SAB on POMAP at three pH values (A): 9.5 (%), 4.5 (!) and 7 (&); and on HOMAP in presence of two electrolytes in the dye solution (B): without electrolyte (!), with NaCl (!), with Na2SO4 (#) and with Na2PO4 (&). Mass to volume relation 1 : 10. Adsorption of mixtures
effect of size on the inorganic anion, but the action of the chloride slowing down dye dissociation and thus specific interaction with the surface. In the case of the bivalent anions, their competition for secondary ionic sites on the surface is similar and affected the adsorption of SAB on POMAP to a lesser degree in comparison with the chloride ion. The decrease in the adsorption constants KL, KF and n after the addition of electrolytes in relation to the adsorption of SAB by POMAP in pure water can be appreciated in Table 2.
B
A
SAB
2.0
0.5
60
ANB (b)
1.0
100 80
ANB ANB (a)
CNB
1.5
ANB
Detector response, au
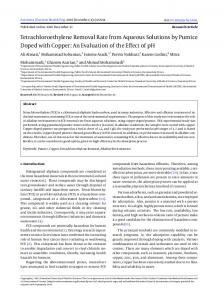
Textile wastewater is commonly a complex mixture of several dyes. To determine whether competition of the dyes in solution affected their adsorptive behavior, a mixture of three model dyes was prepared: SAB, ANB and CNB each at a concentration of 400 mg⋅l-1. Their adsorption by POMAP was studied from a single component solution and from a ternary mixture. Figure 4A shows the chromatograms of the dyes mixture, before (dotted line) and after (continuous line) contact with POMAP.
40
Removal efficiency, %
Figure 3.
20
0.0 0 0
Figure 4.
10
20 Time, min
SAB
30
ANB(a) ANB(b)
CNB
Dye
Model mixture chromatograms (A) of the dyes SAB, ANB (a, b) and CNB at concentration 400 mg l-1 of each dye, before (thin line), and after (thick line) adsorption on POMAP and its removal efficiency (B) upon the dyes in one component solutions (black bars) and in ternary mixtures (white bars). Mass to volume relation 1 : 10. Octyl Beckman Ultrasphere column (4.6 x 150 mm). Mobile phase: methanol- phosphate buffer (pH 5) gradient regime. Room temperature. Detection at 590 nm.
822
Environmental Technology, Vol. 24. pp 821-829 Selper Ltd, 2003
POMAP removed only 60%. The efficiency of CASCAP was very low (15%) for MAB and for the acid dye ANB, which was the dye, which generally was adsorbed less by the studied adsorbents. On the contrary, when we compared desorption of the four dyes from POMAP, the highest desorption degree (24%) was observed for ANB. Very low desorption (9%) of a direct dye has been reported for other wastes like Fe/Cr wastewater mud [27] and depends on the pH for coir pith [28], but not for similar adsorbents such as those we tested in this study.
From previous chromatograms of individual dyes, the purity of each dye was evaluated. In the ternary mixture studied here, we observed more than three peaks, whereby the ANB dye presented several components noted as ANB, ANB(a) and ANB(b) in the figure. Evaluation of the adsorbed ANB considered the integration of all of the peak components. After adsorption occurs, the intensity of the chromatographic peaks (continuous line) decreased considerably or disappeared completely. On the right side we present the removal efficiency achieved by adsorption as single component or as part of a ternary mixture. A difference of 2 - 5% in adsorption efficiency of POMAP upon the studied dyes was obtained in the described trials. Figure 4B also showed that removal efficiency by POMAP decreased for the dyes: SAB > ANB > CNB, which in regards to the chemical nature of the dye corresponded to the series: basic dye > acid dye > reactive dye. We did not find any literature reports that discussed the adsorption efficiency of adsorbents upon dyes as mixtures or even more as a mixture of different dye types.
CONCLUSIONS
The experimental results proved that the biodegradable wastes used as adsorbents have considerable potential for the removal of textile dyes in laboratory scale batch experiments, over a wide range of concentrations and can be considered for wastewater treatment at a larger scale in textile facilities. Adsorption of dyes takes place faster on the surface of the corncob adsorbents than on the coconut wastes. Small particles favored adsorption in the medium concentration range. The presence of three different electrolytes in the aqueous solution of SAB inhibited the adsorption process by POMAP. The competition of several dyes in mixture did not considerably affect their adsorption at the concentration of 400 mg⋅ l-1. The dye SAB was almost completely removed by HOMAP and POMAP and as much as 83% by CASCAP. The maximum desorption efficiency achieved was 24% from POMAP for the acid dye ANB.
Comparative adsorption and desorption Adsorption efficiency for all dyes at a single concentration of 400 mg⋅l-1 by the three different adsorbents prepared in this study, CASCAP, HOMAP, POMAP and by activated carbon was calculated and the results are presented in Figure 5. Desorption of the dyes from POMAP was also calculated. The basic dye SAB was adsorbed to a lesser extent by CASCAP, while HOMAP and CASCAP adsorbed a comparable amount (98%) to activated carbon. CASCAP and HOMAP removed the reactive dye CNB very well, but
100
Efficiency, %
80 60 40 20 0 SAB
Figure 5.
CNB
MAB
ANB
Comparative removal efficiency of the adsorbents activated Carbon ( ≡ bar), CASCAP (white bars), HOMAP (o bars) and POMAP (black bars) for the dyes SAB, MAB, CNB and ANB with concentration 400 mg⋅ l-1 (mass to volume relation 1 : 10) and desorption grade (' bars) from POMAP using methanol-water (1:1) solution.
821
Environmental Technology, Vol. 24. pp 821-829 Selper Ltd, 2003
We gratefully acknowledge the German Society for Technical Cooperation (GTZ) for the donation of the Waters photodiode detector (Project 9224).
ACKNOWLEDGEMENTS
A.A. P.-C. thanks the Consejo Nacional de Ciencia y Tecnología (CONACyT-Mexico) for a fellowship (134282).
REFERENCES
1. 2. 3. 4. 5. 6. 7. 8. 9. 10. 11. 12. 13. 14. 15. 16. 17. 18. 19. 20. 21. 22. 23.
24. 25. 26.
Riu, J., Schönsee, I., Barceló, D., and Ràfols, C., Determination of sulfonated azo dyes in water and wastewater, TrAC, 16, 405-19 (1997). Venkata-Rao, B. and Sastry, C.A., Removal of dyes from water and wastewater by adsorption, Indian J. Environ. Prot., 7, 363-71 (1987). Morais, L.C., Freitas, O.M., Gonçalves, E.P., Vasconcelos, L.T. and González-Beca, C.G., Reactive dyes removal from wastewaters by adsorption on eucalyptus bark: Variables that define the process, Wat. Res., 33, 979-88 (1999). Liversidge, R.M., Lloyd, G.J., Wase, D.A. and Forster, C.F., Removal of Basic Blue 41 dye from aqueous solution by linseed cake, Process Biochem., 32, 473-7 (1997). Claxton, L.D., Houk, V.S. and Hughes T.J., Genotoxicity of industrial wastes and effluents, Mutat. Res., 410, 237-43 (1998). O’Neill, C., Hawkes F.R., Hawkes, D.L., Lourenço, N.D., Pinheiro H.M. and Delée W., Color in textile effluents-sources, measurements, discharge consents and simulation: A review. J. Chem. Technol. Biotechnol., 74, 1009-18 (1999). El-Geundi, M.S., Color removal from textile effluents by adsorption techniques, Wat. Res., 25, 271-3 (1991). Sankar, M., Sekaran, G., Sadulla, S. And Ramasami T., Removal of diazo and triphenylmethane dyes from aqueous solutions trough and adsorption process, J. Chem. Technol. Biotechnol., 74, 337-44 (1999). Graham, N., Chen, X.G., Jayaseelan S., The potential application of activated carbon from sewage sludge to organic dyes removal, Water Sci. Technol., 43, 245-52 (2001). Tay, J.H., Chen, X.G., Jeyaseelan, S. And Grahem N., Optimizing the preparation of activated carbon from digested sewage sludge and coconut husk, Chemosphere, 44, 45-51 (2001). Wu, F.C., Tseng, R.L. and Juang R.S., Adsorption of dyes and phenols from water on the activated carbon prepared from corncob wastes, Environ. Technol., 22, 205-13. (2001). Juang, R.S., Wu, F.C. and Tseng, R.L., mechanism of adsorption of dyes and phenols from water using activated carbons prepared from plum kernels, J. Colloid, Interf. Sci., 227, 437-44 (2000). Ramakrishna, K.R. and Viraraghavan T., Dye removal using low cost adsorbents, Wat. Sci. Technol., 36 189-96 (1997). Nassar, M.M. and El-Geundi, M.S., Comparative cost of color removal from textile effluents using natural adsorbents, J. Chem. Technol. Biotechnol., 50, 257-64 (1991). Sivaraj, R., Namasivayam, C. and Kadirvelu K., Orange peel as an adsorbent in the removal of acid violet 17 (acid dye) from aqueous solutions, Waste Manage., 21, 105-10 (2001). Nassar, M.M., Hamoda, M.F. and Radwn G.H., Adsorption equilibria of basic dyestuffs onto palm-fruit bunch particles, Wat. Sci. Technol., 32, 27-32 (1995). Nassar, M.M., Magdy, Y.H., Removal of different dyes from aqueous solutions by adsorption on palm-fruit bunch particles, Chem. Eng. J., 66, 223-6 (1997). Nassar, M.M., Intraparticle diffusion of Basic red and basic yellow dyes on palm fruit bunch, Wat. Sci. Technol., 40, 133-9 (1999). Sun, G. and Xu, X., Sunflower stalks as adsorbents for color removal from textile water, Ind. & Eng. Chem. Res., 36, 808-12 (1997). Robinson, T., Chandran, B. and Nigam, P., Removal of dyes from an artificial textile dye effluent by two agricultural waste residues, corncob and barley husk, Environ. Int., 28, 29-33 (2002). Peláez-Cid, A.A., Thesis, Universidad Autónoma de Puebla, México, 2000. Dávila-Jiménez, M.M., Elizalde-González, M.P. and Peláez-Cid, A.A., Patent in preparation, 2002. Dávila-Jiménez, M.M., Elizalde-González, M.P., Gutiérrez-González, A. and Peláez-Cid, A.A., Electrochemical treatment of textile dyes and their analysis by high-performance liquid chromatography with diode array detection., J. Chromatogr., 889, 253-9 (2000). Oscik, J., Adsorption at the Solid/Liquid Interface. In: Adsorption, Polish Scientific Publishers, Warsawa, pp. 109 - 175 (1982). Giles C.H , Adsorption of Dyes. In: Adsorption from Solution at the Solid/Liquid Interface, Parfitt, G.D., Rochester C.H., (eds.), Academic Press, London, pp. 321 - 376 (1983). Hsu, Y.-Ch., Chiang, Ch.-Ch. And Yu, M.,F., Adsorption behavior of basic dyes on activated clay, Sep. Sci. & Technol., 32, 2513-34 (1997).
821
Environmental Technology, Vol. 24. pp 821-829 Selper Ltd, 2003
27. Namasivayam, C., Jeyakumar R. and Yamuna, R.T., Dye removal from wastewater by adsorption on “waste” Fe(III)/Cr(III) hydroxide, Waste Manage., 14, 643-8 (1994). 28. Namasivayam, C., Radhika R. and Suba S., Uptake of dyes by a promising locally available agricultural solid waste: coir pith, Waste Manage., 21, 381-7 (2001).
822