RESEARCH ARTICLE NEUROPHYSIOLOGY
The supramammillary nucleus and the claustrum activate the cortex during REM sleep
2015 © The Authors, some rights reserved; exclusive licensee American Association for the Advancement of Science. Distributed under a Creative Commons Attribution NonCommercial License 4.0 (CC BY-NC). 10.1126/sciadv.1400177
Leslie Renouard,1,2 Francesca Billwiller,1 Keiko Ogawa,1 Olivier Clément,1 Nutabi Camargo,1 Mouaadh Abdelkarim,1 Nadine Gay,1 Céline Scoté-Blachon,1 Rouguy Touré,1 Paul-Antoine Libourel,1 Pascal Ravassard,1 Denise Salvert,1 Christelle Peyron,1 Bruno Claustrat,3 Lucienne Léger,1 Paul Salin,1 Gael Malleret,1 Patrice Fort,1 Pierre-Hervé Luppi1* Evidence in humans suggests that limbic cortices are more active during rapid eye movement (REM or paradoxical) sleep than during waking, a phenomenon fitting with the presence of vivid dreaming during this state. In that context, it seemed essential to determine which populations of cortical neurons are activated during REM sleep. Our aim in the present study is to fill this gap by combining gene expression analysis, functional neuroanatomy, and neurochemical lesions in rats. We find in rats that, during REM sleep hypersomnia compared to control and REM sleep deprivation, the dentate gyrus, claustrum, cortical amygdaloid nucleus, and medial entorhinal and retrosplenial cortices are the only cortical structures containing neurons with an increased expression of Bdnf, FOS, and ARC, known markers of activation and/or synaptic plasticity. Further, the dentate gyrus is the only cortical structure containing more FOS-labeled neurons during REM sleep hypersomnia than during waking. Combining FOS staining, retrograde labeling, and neurochemical lesion, we then provide evidence that FOS overexpression occurring in the cortex during REM sleep hypersomnia is due to projections from the supramammillary nucleus and the claustrum. Our results strongly suggest that only a subset of cortical and hippocampal neurons are activated and display plasticity during REM sleep by means of ascending projections from the claustrum and the supramammillary nucleus. Our results pave the way for future studies to identify the function of REM sleep with regard to dreaming and emotional memory processing.
INTRODUCTION It is well accepted that during rapid eye movement (REM) sleep [also called paradoxical sleep (PS)], characterized by vivid dreaming, the cortical activity is closer to that occurring during waking (W) than during non-REM (NREM) sleep (or slow-wave sleep) (1). Indeed, spectral analysis of electroencephalogram (EEG) recordings revealed that both REM sleep and W are characterized by the presence of q and fast g oscillations, in contrast to NREM sleep during which s (spindles) and slow d oscillations predominate (2). Further, global brain metabolism is in a similar range during W and REM sleep, whereas it strongly decreases during NREM sleep (3). Unit recordings confirmed that the discharge rate of neocortical neurons is higher both during REM sleep and W than during NREM sleep (4, 5). However, a number of studies indicate that cortical activity and the subcortical pathways at its origin are not strictly identical during W and REM sleep. Indeed, a significant increase in cerebral blood flow has been found in humans in specific brain areas including thalamic nuclei, limbic and paralimbic areas, and posterior cortices during REM sleep compared to quiet W (3, 6, 7). In contrast, the inferior and dorsolateral prefrontal cortices were found deactivated (3, 6, 7). So far, a few studies have examined the state of the cortex during REM sleep in animals. It was first confirmed in cats, using [14C]deoxyglucose or FOS immunohistochemistry, that the cingulate cortex, hippocampus, and amygdala are more active during REM sleep than W (8, 9). In addition, an increase in cyclic adenosine 1 UMR 5292 CNRS/U1028 INSERM, Centre de Recherche en Neurosciences de Lyon (CRNL), Team “Physiopathologie des réseaux neuronaux responsables du cycle veille-sommeil,” Université Claude Bernard Lyon 1, Faculté de Médecine RTH Laennec, 7 Rue Guillaume Paradin, 69372 Lyon Cedex 08, France. 2College of Medical Sciences, Washington State University, 412 E. Spokane Falls Boulevard, PBS230, Spokane, WA 99202, USA. 3Service de Radioanalyse, Centre de Médecine nucléaire, 59 Boulevard Pinel, 69677 Bron Cedex, France. *Corresponding author. E-mail:
[email protected]
Renouard et al. Sci. Adv. 2015;1:e1400177
3 April 2015
monophosphate (cAMP), phospho–mitogen-activated protein kinase (pMAPK), and phospho–cAMP response element–binding protein (pCREB), which are required for consolidation of hippocampusdependent memory, has been observed in CA1 and the dentate gyrus during REM sleep compared to W and NREM sleep (10). It has also been reported that the expression of zif-268, a synaptic plasticity– related gene, was increased in the cerebral cortex and hippocampus during REM sleep after exposure to an enriched environment (11). Finally, the induction of hippocampal long-term potentiation (LTP) during W in rats leads to an up-regulation of zif-268 gene expression in the amygdala, entorhinal, and auditory cerebral cortices during the first REM sleep episodes after LTP induction and reaches somatosensory and motor cerebral cortices as REM sleep recurs (12). Besides, the mechanisms responsible for the cortical and hippocampal activation during REM sleep are not well known. The current hypothesis is that cortical activation during REM sleep is induced by direct projections of the cholinergic neurons in the basal forebrain as well as by indirect projections of the cholinergic neurons in the laterodorsal and pedunculopontine nuclei and the glutamatergic neurons in the sublaterodorsal tegmental nucleus via the intralaminar thalamic nuclei (13). In contrast, the mechanisms responsible for cortical activation during W are quite well accepted. It has indeed been shown that the activation of the cortex during W is conjointly due to the cortical and thalamic projections of the basal forebrain and tegmental cholinergic neurons and those of the noradrenergic, serotonergic, histaminergic, and hypocretin neurons (13, 14). In summary, although a number of studies indicate that cortical activity during REM sleep is different from that occurring during W owing to differential regional activation and functional connectivity (3), the identification of the populations of cortical neurons involved and of the subcortical pathways responsible remain to be elucidated. 1 of 14
RESEARCH ARTICLE To fill this gap, we first combined the study of gene expression in the cortex and the hippocampus using complementary DNA (cDNA) microarrays and quantitative real-time polymerase chain reaction (PCR) in control, REM sleep–deprived, and REM sleep hypersomniac rats. We then mapped, at the cellular level, the distribution of the product (mRNA or protein) of four genes with an increased expression during REM sleep hypersomnia compared to REM sleep A deprivation and control, using immunohistochemistry and in situ hybridization. Finally, combining retrograde tracing and neurochemical lesion, we identified the subcortical structures potentially responsible for the increased expression of these genes in the cortex and hippocampus during REM sleep hypersomnia.
tures. In the hippocampus, most of the transcripts displayed an increased expression after REM sleep hypersomnia, compared to control and/or REM sleep deprivation conditions (table S1). In contrast, in the cortex, most of them displayed an increase in expression after REM sleep deprivation compared to the control condition (table S1).
E
B
F
C
G
D
H
RESULTS Cortical gene expression modified by REM sleep deprivation and hypersomnia We first compared global gene expression in rats subjected to 78 hours of REM sleep deprivation, rats allowed to recover for 6 hours after such deprivation, and control rats sleeping normally (Fig. 1H) (n = 12 rats per condition). In the 6 hours preceding euthanasia, REM sleep quantities were significantly different between conditions (P < 0.0001, RSC versus RSD and RSD versus RSR; P = 0.0094, RSC versus RSR, Mann-Whitney). REM sleep constituted 2.7 ± 2.6% of the total time in the RSD group, 29.6 ± 1.8% in the RSR group, and 15.5 ± 2% in the RSC group. There was also a significant difference in the time spent in W in RSD (65.8 ± 0.5%) as compared to RSC (39.7 ± 1.6%) and RSR (28.9 ± 1.8%) rats (P < 0.0001, RSC versus RSD; P = 0.0094, RSC versus RSR; P < 0.0001, RSD versus RSR, Mann-Whitney). NREM sleep amounts were marginally modified among conditions (RSD: 31.5 ± 2.8%, RSR: 41.6 ± 1.7%, and RSC: 44.8 ± 1.8%) (P = 0.013, RSC versus RSD; P = 0.3263, RSC versus RSR; P = 0.0495, RSD versus RSR). The comparison of the gene expression level among the three experimental conditions revealed that the expression of 103 [68 identified genes and 35 expressed sequence tags (ESTs)] and 75 (51 genes and 24 ESTs) transcripts was modified by the experimental protocol in the hippocampus and cortex, respectively (see table S1). Only 23 of the 178 modified transcripts were common between the two brain strucRenouard et al. Sci. Adv. 2015;1:e1400177
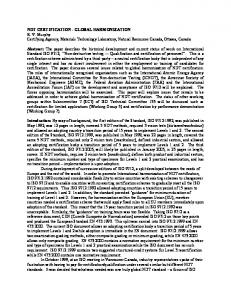
Fig. 1. Expression level of plasticity-related genes and REM sleep amounts as quantified in the microarrays. (A to G) Histograms showing Bdnf, Arc, Fos, and Cox2 expression levels in the hippocampus (A to D) and the cortex (E to G) in RSC (blue), RSD (red), and RSR (green) rats. For all conditions, the bar on the left shows the mean (±SEM) expression level of each gene measured by qPCR relative to the RSC condition (six rats per group). The other two bars show the expression level relative to the RSC condition measured by the two microarrays in two independent groups (six rats per condition). Kruskal-Wallis followed by Mann-Whitney, RSD versus RSC or RSR versus RSC: **P < 0.01, *P < 0.05; RSD versus RSR: ##P < 0.01, #P < 0.05. The graphs show the correlations between the REM sleep amounts (in minutes) during the last 6 hours of the protocol and the expression levels of Bdnf, Arc, Fos, and Cox2 measured by qPCR (six rats per condition; Spearman test: *P < 0.05, **P < 0.01). (H) Histogram showing the vigilance state amount in minutes during the last 6 hours of the protocol (H) in RSC, RSD, and RSR animals (12 rats per condition). Kruskal-Wallis followed by Mann-Whitney, RSD versus RSR versus RSC: ***P < 0.0001, **P < 0.001, *P < 0.05; RSR versus RSD: ###P < 0.0001, ##P < 0.001, #P < 0.5. Bdnf (A), Arc (B), Fos (C), and Cox2 (D) mRNA expression levels are significantly increased in the hippocampus in RSR rats compared to RSC and RSD rats, and Bdnf, Arc, and Cox2 expression is positively correlated with REM sleep quantities. In the cortex, Bdnf (E) mRNA expression is increased in RSR rats compared to the other two conditions and is positively correlated with REM sleep amounts, whereas Arc (F) and Fos (G) mRNA levels are increased after REM sleep deprivation and Arc expression level is negatively correlated with REM sleep amounts.
3 April 2015
2 of 14
RESEARCH ARTICLE The microarray results were confirmed for nine genes (Bdnf, Arc, Fos, Cox2, Homer1a, Gpd1, Sgk, Zif-268, and Sult1a1) by quantitative realtime PCR run on hippocampal and cortical RNA extracts of 18 rats (6 per condition) from the first series of experiments (Fig. 1 and fig. S1). Because our aim was to identify the genes positively linked with REM sleep, we then focused our analysis on the functional role of the genes with an increased expression during REM sleep hypersomnia using Gene Ontology (GO) database (15), DAVID (the database for annotation, visualization, and integration discovery; http://david.abcc. ncifcrf.gov/), and an extensive literature search. This analysis shows that a large number of the genes with an increased expression during REM sleep hypersomnia in the hippocampus and the cerebral cortex are involved in synaptic plasticity, nervous system development, signal transduction, and transcription regulation. The expression of 11 and 4 genes involved in synaptic plasticity and LTP is increased during REM sleep hypersomnia in the hippocampus and the cortex, respectively. The genes with an increased expression in the hippoA campus were brain-derived neurotrophic factor (Bdnf ) (Fig. 1A), activity-regulated cytoskeleton-associated protein (Arc) (Fig. 1B), FBJ osteosarcoma oncogene (Fos) (Fig. 1C), cyclooxygenase 2 (Cox2) (Fig. 1D), early growth response (Egr1 or Zif-268), Homer1a (see fig. S1), Egr2, Klf10 (Tieg), Nr4a1 (Nur77), Rgs2, Dusp1, Dusp6, and D neuronal pentraxin II (Nptx2) (16–18). Of these genes, only Bdnf (Fig. 1E) and Nptx2 also showed increased expression in the cortex during REM sleep hypersomnia. On the contrary, five other genes including Arc (Fig. 1F), Fos (Fig. 1G), and Homer1a (table S1 and fig. S1) displayed an increased expression in the cortex during REM sleep G deprivation. Finally, the expression of Cox2 is increased during REM sleep hypersomnia only in the hippocampal formation. We further showed that the expression of Bdnf, Arc, Cox2 (Fig. 1, A, B, and D), and Zif-268 (fig. S1) in the hippocampus and the cortical expression of Bdnf (Fig. 1E) were positively correlated with the REM J sleep amounts during the 6 hours preceding euthanasia. Distribution of Bdnf, ARC, FOS, and COX2 in cortical and hippocampal structures after REM sleep deprivation and hypersomnia On the basis of the above findings and to identify the cortical and hippocampal populations of neurons activated and displaying plasticity during REM sleep hypersomnia, we examined, using in situ hybridization or immunohistochemistry, the regional expression of the products (mRNA or proteins) of three well-known related plasticity genes, namely, Bdnf, Arc, Renouard et al. Sci. Adv. 2015;1:e1400177
and Cox2, and one gene known to be involved in both plasticity and neuronal activation, Fos. In the hippocampus, Bdnf (Fig. 2, A to C, and table S2A), ARC (Fig. 2, D to F, and table S2B), FOS (Fig. 2, G to I, and table S3), and COX2 (Fig. 2, J to L, and table S2C) labeling was strongly increased during REM sleep hypersomnia as compared to REM sleep deprivation and control conditions, specifically in the granule cells of dentate gyrus (Fig. 2). Bdnf, ARC, FOS, and COX2 expression was not modified between control and REM sleep deprivation. In addition, Bdnf and COX2, but not FOS and ARC, labeling was increased in CA3 after REM sleep hypersomnia compared to control and REM sleep deprivation (Fig. 2). No modification was observed in CA1 for all four markers (Fig. 2, C, F, I, and L, and fig. S2). The results are more heterogeneous in the cortex. First, the expression of ARC (Fig. 3H and table S2B) and FOS (Fig. 3L, fig. S2, and
B
C
E
F
H
I
K
L
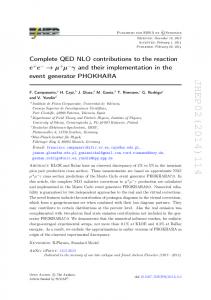
Fig. 2. The expression of plasticity-related markers is increased in the granule layer of the dentate gyrus during REM sleep hypersomnia. (A to L) Photomicrographs and histograms showing the in situ hybridization of Bdnf (A to C) and the immunohistochemistry of ARC (D to F), FOS (G to I), and COX2 (J to L) in the dentate gyrus (DG), CA3, and CA1 in RSD (A, D, G, and J) and RSR (B, E, H, and K) rats. The photomicrographs show that the numbers of Bdnf-, ARC-, FOS-, and COX2-stained neurons are increased in the dentate gyrus in RSR rats compared to RSD rats. The histograms also show an increase of Bdnf and COX2 staining in CA3. In contrast, there is no change in CA1 among conditions for any marker. Scale bar, 50 mm. Kruskal-Wallis followed by Mann-Whitney: **P < 0.02, *P < 0.05, RSD versus RSC or RSC versus RSR; ##P < 0.02, #P < 0.05, RSD versus RSR.
3 April 2015
3 of 14
RESEARCH ARTICLE
I
B
F
J
C
G
K
D
H
L Number of FOS+ neurons
E
Number of ARC+ neurons
A
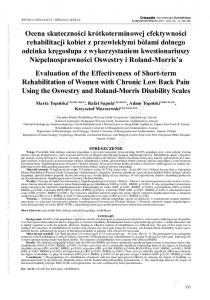
Fig. 3. The expression of plasticity-related markers is increased in a subset of cortical neurons during REM sleep hypersomnia. (A to L) Photomicrographs and histograms showing the in situ hybridization of Bdnf (A to D) and the immunostaining of ARC (E to H) and FOS (I to K) in the anterior cingulate (ACA) (A, E, and I) and retrosplenial cortices (RSP) (B, F, and J) and in the claustrum (CLA) (C, G, and K) of RSD and RSR representative rats. In (D), the histograms show the mean intensity (±SEM) of Bdnf labeling in six cortical areas in the RSD and RSR groups relative to the RSC group. The other two histograms show the mean number (±SEM) of ARC+ (H) and FOS+ (L) cells in the same cortical areas and same experimental conditions. Bdnf labeling (A to D) is significantly increased in RSR rats compared to the other two groups in the anterior cingulate (A) and the medial entorhinal and retrosplenial (B) cortices, the claustrum (C), and the cor-
tical amygdaloid nucleus. The retrosplenial cortex (F) and the claustrum (G) contained a significantly higher number of ARC + cells not only in RSR but also in RSD rats compared to the RSC group. (H) The cortical amygdaloid nucleus and, to a minor extent, the medial entorhinal cortex contained a significantly increased number of ARC+ neurons only during REM sleep hypersomnia compared to the control group. The auditory cortex contained a significantly higher number of ARC+ cells in RSD rats. The number of FOS+ cells is increased in the medial entorhinal and retrosplenial cortices (J), the claustrum (K), and the cortical amygdaloid nucleus in the RSR group compared to the other two groups. Scale bars, 200 mm (A, B, E, F, I, and J); 25 mm (C, G, and K). Kruskal-Wallis followed by Mann-Whitney: **P < 0.02, *P < 0.05, RSD versus RSC or RSC versus RSR; ##P < 0.02, #P < 0.05, RSD versus RSR (see also fig. S2 and table S3 for the complete quantification).
table S3), but not that of Bdnf (Fig. 3D and table S2A), was increased in the neocortex (auditory, motor, somatosensory, and visual) and in the piriform cortex during REM sleep deprivation compared to the two other conditions. These results suggest that neurons in the sensorimotor neocortical areas are activated and express some of the plasticity proteins during REM sleep deprivation and, conversely, might be deactivated during REM sleep hypersomnia. Second, in a few cortical limbic structures, namely, the retrosplenial (Fig. 3, B, F, and J) and medial entorhinal cortices, claustrum (Fig. 3, C, G, and K), and
cortical amygdaloid nucleus, Bdnf, ARC, and FOS [Fig. 3 (D, H, and L), fig. S2, and tables S2 and S3], expression was significantly higher in REM sleep hypersomniac rats compared to control and higher than or similar to REM sleep–deprived rats. The results are more heterogeneous in the anterior cingulate cortex than in the other cortices. Indeed, Bdnf labeling (Fig. 3A) was increased in the REM sleep hypersomniac group compared to the other two groups, and FOS labeling was increased in both the RSD and RSR groups compared to control rats (Fig. 3I). Finally, ARC labeling (Fig. 3E)
Renouard et al. Sci. Adv. 2015;1:e1400177
3 April 2015
4 of 14
RESEARCH ARTICLE was increased specifically during REM sleep deprivation compared to REM sleep hypersomnia and control [Fig. 3 (D, H, and I), fig. S3, and tables S2 and S3]. Together, these results indicate for the first time that the expression of genes and related proteins classically involved in neuronal activation and plasticity is increased only in a few limbic cortical structures during REM sleep hypersomnia. Cortical distribution of FOS+ neurons during W compared to REM sleep hypersomnia To determine whether cortical structures are similarly activated during W and REM sleep, as current hypotheses suggest (see Introduction), we then mapped out FOS+ cells in the cortex in an additional group of rats awake during 3 hours (n = 4) and compared the results with those obtained in the REM sleep–deprived and hypersomniac groups. In line with a previous report (19), nearly all cortical and hippocampal structures contained a very large number of FOS+ neurons after W. FOS+ cell numbers were significantly above those counted after REM sleep deprivation and hypersomnia in most cortical structures, in particular the sensorimotor cortices (Fig. 4, fig. S2, and table S3). The dentate gy-
A
rus was the only cortical structure containing significantly more FOS+ neurons during REM sleep hypersomnia than during W, in sharp contrast with the CA1 and CA3 fields (Fig. 4, A and D). In addition, the number of FOS+ neurons was similar during REM sleep hypersomnia and W in the cortical amygdaloid nucleus (Fig. 4C), claustrum, and medial entorhinal cortex (Fig. 4, D to F, fig. S2, and table S3). Together, these results strongly suggest that cortical activation during REM sleep hypersomnia is limited to very few limbic cortical structures compared to W. Subcortical structures activating the cortex during REM sleep We then labeled the neurons projecting to the limbic cortical structures and expressing FOS during REM sleep hypersomnia. To this aim, we injected two retrograde tracers, fluorogold (FG) or cholera toxin B subunit (CTb), in three cortical limbic structures, namely, the dentate gyrus and retrosplenial and anterior cingulate cortices (n = 4 for each), and subjected all rats to REM sleep deprivation followed by REM sleep hypersomnia. After CTb injection into the dentate gyrus
D
E
B
F
C
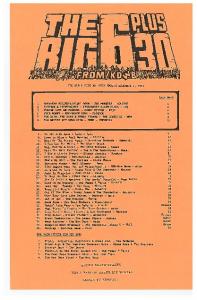
Fig. 4. A restricted number of cortical structures are active during REM sleep hypersomnia compared to W. (A to C) Photomicrographs showing FOS immunostaining in the hippocampus (A), auditory cortex (B), and cortical amygdaloid nucleus (C) of RSR and W rats. Scale bars, 200 mm. (D and E) The histograms show the mean number (±SEM) of FOS+ cells in the hippocampal formation and in six cortical areas (n = 4 rats per condition). (F) The drawings illustrate the distribution of FOS+ cells on coronal sections located at −7.10 mm relative to bregma in RSR and W rats. The dentate gyrus (DG) (A and D), medial entorhinal cortex (ENTm) (E and F), claustrum (CLA), and cortical amygdaloid nucleus (COA) (C and E) are the only structures in which the number of FOS+ cells is similar in RSR and W rats. Renouard et al. Sci. Adv. 2015;1:e1400177
3 April 2015
The dorsal CA1, known to contain place cells, displays a large number of FOS-labeled cells only after W (A and D). The auditory (AUD) (B and E) and visual (VIS) (F) cortices contain a very large number of FOS-labeled neurons in W and, in contrast, only a small number of FOS-labeled cells during REM sleep recovery. The medial entorhinal and retrosplenial (RSP) cortices (E and F) and the anterior cingulate (ACA) (E) cortices are activated during REM sleep hypersomnia, but to a lower extent than during W. Scale bars, 200 mm (A to C). Kruskal-Wallis followed by Mann-Whitney: **P < 0.02, *P < 0.05, RSR versus W (see also fig. S2 and table S4). ECT, ectorhinal area; ENTl, entorhinal area, lateral part; PAR, parasubiculum; POST, postsubiculum; PRE, presubiculum; SUB, subiculum; TEA, temporal association areas. 5 of 14
RESEARCH ARTICLE
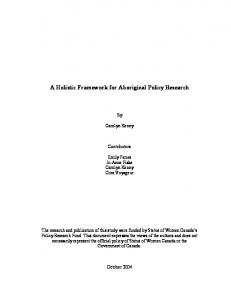
Fig. 5. The dentate gyrus and the anterior cingulate and retrosplenial cortices receive projections from the SUML and the claustrum active during REM sleep hypersomnia. (A to I) Photomicrographs showing double-labeled cells in RSR rats with a black FOS-labeled nucleus and a brown cytoplasm (retrogradely labeled). Scale bars, 200 mm; 25 mm (inset). (J) The histogram shows the mean number (±SEM) of FOS/CTb+ or FOS/FG+ cells contained in the major areas projecting to the dentate gyrus (DG), anterior cingulate cortex (ACA), and retrosplenial cortex (RSP) (four rats per structure, three sections quantified for the SUM; details given in tables S4 and S5). After CTb injection in the dentate gyrus (A), the SUML (B) is the only region containing FOS/CTb+ cells; the large number of CTb+ neurons in the medial septum (C) does not express the FOS protein. After FG injection in the anterior cingulate cortex (D), a large number of doublelabeled cells are seen in the claustrum (CLA) (F and J), a small number are observed in the SUML (E and J), and only a few in the thalamic nuclei (TH) (H and J). After CTb injection in the retrosplenial cortex (G), FOS/CTb+ cells are observed only in the claustrum (I and J). The large number of CTb+ cells located in the thalamic nuclei (H) does not express the FOS protein (J). (K) A large number of anterogradely labeled fibers (in brown) are seen in close proximity to FOS+ neurons (in black) in the dentate gyrus of an RSR rat after a CTb injection in the SUML (inset). Scale bars, 50 mm; 500 mm (inset). AC, anterior commissure; CP, caudate putamen; f, fornix; PAG, periaqueductal gray; pm, principal mammillary tract; VIS, visual cortex.
(Fig. 5A), the only structure displaying a substantial number of doublelabeled cells (10.6 ± 4.80 CTb+/FOS+) was the lateral part of the supramammillary nucleus (SUML) (Fig. 5, B and J, and table S4), suggesting that neurons in this nucleus projecting to the dentate gyrus are actiRenouard et al. Sci. Adv. 2015;1:e1400177
3 April 2015
vated during REM sleep. After FG injection in the anterior cingulate cortex (Fig. 5D), a large number of double-labeled cells were observed in the claustrum (71.0 ± 23.5 CTb+/FOS+), and a small number in the SUML (7.6 ± 1.90 CTb+/FOS+) [Fig. 5 (E, F, and J) and table S5]. After CTb injection in the retrosplenial cortex (Fig. 5G), a substantial number of doublelabeled cells were only observed in the claustrum (18.5 ± 4.1 CTb+/FOS+) (Fig. 5, I and J, and table S5). After all tracer injections, the thalamic nuclei, basal forebrain, lateral hypothalamic area, and laterodorsal and pedunculopontine nuclei, previously thought to be responsible for cortical activation during REM sleep (13), contained retrogradely labeled cells, but surprisingly, none or only a few of them were also FOS+ (Fig. 5, C, H, and J). These findings suggest that the neurons responsible for limbic cortical activation during REM sleep hypersomnia are located in the SUML and the claustrum. In addition, we found that the SUML contained twice as many FOS+ neurons during REM sleep hypersomnia than after 3 hours of W (table S6). In contrast, the medial part of the supramammillary nucleus (SUM) contained a lower number of FOS neurons not significantly different between the RSR and W groups (table S6). In addition, in agreement with a previous study (20), a large number of anterogradely labeled fibers were observed in the dentate gyrus in close proximity to FOS+ neurons after CTb injection in the SUML in REM sleep hypersomniac rats (Fig. 5K). Moreover, the basal forebrain and intralaminar thalamic nuclei contained only a few FOS+ neurons after REM sleep hypersomnia, whereas they contained a large number of such cells after 3 hours of W (table S6). Together, these results strongly suggest that, during REM sleep, neurons in the SUML activate and induce plasticity in a subpopulation of dentate gyrus granule cells. The SUML would only partly contribute to the activation and plasticity of the neurons of the anterior cingulate cortex and not of those of the retrosplenial cortex. Rather, the claustrum would be the main subcortical structure activating these two cortices during REM sleep.
Effect of the lesion of the SUM on cortical activation during REM sleep To test the hypothesis of a key role of the SUML in the dentate gyrus activation and plasticity occurring during REM sleep hypersomnia, we 6 of 14
RESEARCH ARTICLE
In the present study, we report that the expression of a large number of genes involved in neuronal activation and plasticity are increased in B
C
SUM
E
REM hypersomnia
Vigilance state amounts (min)
A
Sham
Fig. 6. Lesion of the SUM alters dentate gyrus activation during REM sleep hypersomnia. (A) Series of schematic transverse sections modified from the Swanson atlas depicting the extent of each lesion of the SUM (one color per animal). (B) Illustration of a representative neurotoxic lesion of the SUML in a section immunostained with NeuN. (C) Histogram illustrating the quantities of each vigilance state in lesioned and sham rats (n = 4 per group) during the 6 hours preceding euthanasia (Kruskal-Wallis followed by Mann-Whitney). (D) Graph showing the mean spectral power of the EEG during REM sleep hypersomnia 3 April 2015
Sham
Lesion
REM NREM Lesion
DG
Renouard et al. Sci. Adv. 2015;1:e1400177
Methodological considerations To determine the modifications of gene expression occurring in the cortex during REM sleep and the subcortical pathways responsible, we manipulated REM sleep quantities using the flowerpot method. This deprivation method has been extensively and successfully used in the past to induce a quite specific and complete suppression of REM sleep and to obtain a strong rebound in REM sleep (21–37). However, it also induces chronic stress and deprivation of deep NREM sleep, and REM sleep is only present one-third of the time during the recovery. It is therefore likely that some of the results obtained are not specifically linked to the state of REM sleep per se and do not reflect what occurs during basal REM sleep, but rather are due to other physiological modifications induced by the protocol. Therefore, our results need to be confirmed in the future by other approaches. Nevertheless, we believe that they reveal for the first time a network of cortical neurons likely displaying D
Power spectrum during REM hypersomnia
Relative power in lesion
DISCUSSION
a restricted number of limbic cortical structures during REM sleep hypersomnia. We further show that the dentate gyrus is the only cortical structure containing more FOS-labeled cells during REM sleep hypersomnia than during W. By combining retrograde tracing with FOS staining after REM sleep hypersomnia, we additionally demonstrated that the activation of limbic cortical structures during REM sleep hypersomnia might be induced by projections from the SUML and the claustrum (Fig. 7). The neurotoxic lesion of the SUML confirmed that this nucleus is responsible for the increased FOS expression in granule cells of the dentate gyrus during REM sleep hypersomnia.
1
W
7
13 20 26 33 39 45 Frequency (Hz)
F Number of FOS+ neurons in RSR
compared the sleep-wake cycle, EEG power spectrum, and distribution of the FOS+ neurons in the cortex of rats subjected to REM sleep deprivation and hypersomnia after bilateral iontophoretic injections of ibotenic acid or control NaCl injections in the SUM (n = 4 for each condition). The SUM was left intact in the control animals, whereas it was entirely lesioned in those injected with ibotenic acid (Fig. 6, A and B). The amounts of W, NREM, and REM sleep were not significantly different between the two groups of rats during baseline recording (fig. S3A) and the 6 hours of REM sleep hypersomnia (Fig. 6C). EEG power spectrum analysis revealed that q and s power during REM sleep episodes were slightly but significantly decreased and increased in the lesioned rats, respectively, compared to the sham-operated rats (Fig. 6D and fig. S3B). In contrast, no modification was seen in the EEG during W and NREM sleep (fig. S3, C and D). The number of FOS+ neurons was strongly decreased in the dentate gyrus during REM sleep hypersomnia in the lesioned rats compared to sham rats. In contrast, the number of FOS+ neurons in the other limbic structures with an increased number of FOS+ neurons was not significantly modified after lesion (Fig. 6, E and F, and table S7). These observations strongly suggest that neurons localized in the SUML are specifically responsible for the activation of granule neurons of the dentate gyrus during REM sleep hypersomnia.
Sham Lesion
in the lesioned rats (±SEM) in relative value compared to the sham rats. The horizontal black points and lines below the graph show the frequency bins significantly different between the two conditions according to the Kruskal-Wallis and Mann-Whitney tests (P < 0.05). (E and F) Photomicrographs and histogram showing that the lesion of the SUML induces a strong decrease in the number of FOS+ neurons in the dentate gyrus compared to sham. Scale bars, 50 mm. Kruskal-Wallis followed by Mann-Whitney: **P < 0.02, *P < 0.05, RSR-sham versus RSR-lesion (see also fig. S3 and table S7). 7 of 14
RESEARCH ARTICLE
Fig. 7. Pathways and structures activated during REM sleep according to FOS imaging and retrograde tracing studies. The solid line shows the pathway demonstrated by the retrograde tracing studies and confirmed by the lesion of the SUML. The dashed lines show the other pathways revealed by retrograde tracing. ACA, anterior cingulate cortex; CLA, claustrum; DG, dentate gyrus; RSP, retrosplenial cortex.
activation and plasticity during REM sleep. Indeed, electrophysiological recordings already performed in several structures containing FOS+ neurons in the REM sleep recovery condition confirmed the presence of neurons with an increased activity specifically during basal REM sleep (38–45). In addition, it has recently been shown that the expression of FOS in cortical neurons in FOS/green fluorescent protein (GFP) transgenic mice is associated with elevated spontaneous firing activity compared to neighboring FOS/GFP-negative neurons (46). Such results strongly suggest that the expression of FOS reflects an increased firing activity of neurons. However, it does not rule out the possibility that certain populations of neurons are active during REM sleep but do not express FOS during REM sleep hypersomnia, because it has been reported previously that some brain regions do not express Fos after any treatments (47). State of the hippocampus during REM sleep Our microarray data show that the expression of numerous genes previously involved in LTP and synaptic plasticity is increased in the hippocampus during REM sleep hypersomnia compared to control and REM sleep deprivation. It might, however, be argued that such modification is not linked to REM sleep, because the expression of these genes is not decreased during REM sleep deprivation compared to control. One explanation could be that the expression of these genes decreased at the beginning of the REM sleep deprivation and then recovered because of the semichronic state of the deprivation. Indeed, most of these are early genes known to have an increased expression during acute but not long-lasting stimuli (48). These genes include transcription factors such as Fos, Zif-268, Egr2, Klf10 (Tieg), and Nr4a1 (Nur77) (49) and genes regulating dendritic spine density and postsynaptic strength such as Homer1a, Bdnf, Arc, Rgs2, and Ptgs2 (Cox2) (17, 18, 50). Bdnf, Fos, Dusp1, Dusp6, and Nr4a1 are also involved in the MAPK signaling pathway, which is required for LTP (DAVID database) (51). To identify the hippocampal neurons with an increased expression of these genes during REM sleep hypersomnia, we quantified in CA1, CA3, and the dentate gyrus the labeling of Bdnf, ARC, COX2, and FOS. Here, we show that the expression of Bdnf, ARC, FOS, and COX2 is specifically increased in the dentate gyrus during REM sleep hypersomnia. COX2 and Bdnf expression is also increased in CA3. The distribution of the granule cells expressing Bdnf, Renouard et al. Sci. Adv. 2015;1:e1400177
3 April 2015
ARC, FOS, and COX2 is apparently similar, although a technically challenging multiple labeling would be necessary to demonstrate that they colocalize in the same granule cells. Consistent with our results, it has been previously reported that the expression of zif-268, a synaptic plasticity–related gene also revealed by our microarray study, is increased in the dentate gyrus during REM sleep after exposure to an enriched environment (11). In addition, an increase in cAMP, pMAPK, and pCREB, which are required for consolidation of hippocampusdependent memory, has been observed in the dentate gyrus during REM sleep compared to W and NREM sleep (10). Further supporting our results, it has been shown using [14C]deoxyglucose that the dentate gyrus uses more glucose during basal REM sleep than during W (52). Moreover, Montgomery et al. (53) found by coherence analysis that dentate/CA3 q and g synchrony was significantly higher during REM sleep compared with active W and that, in contrast, g power in CA1 and CA3-CA1 g coherence showed significant decreases during REM sleep. It has been proposed that an increase in local field potential synchronization may facilitate synaptic plasticity in agreement with the present results (53). Further, it has recently been shown that the firing rate of CA1 pyramidal cells and interneurons decreases during REM sleep (54). In view of these and our data, we propose that a subset of granule neurons of the dentate gyrus is strongly activated, exhibits synaptic plasticity specifically during REM sleep, and induces a slight activation and synaptic plasticity in CA3 but not in CA1 neurons. Additional experiments are necessary to demonstrate that the increase in gene expression in the dentate gyrus is related to an increase in neuronal activity and synaptic plasticity during REM sleep episodes. State of the sensorimotor cortex during REM sleep In the neocortex, our results show that the expression of genes implicated in neuronal plasticity and development such as Bdnf and Nptx2 (55, 56) is increased during REM sleep hypersomnia, whereas the expression of genes involved in membrane depolarization and synaptic activity such as Homer1a, Arc, Fos, Nr4a1, and Vgf (49) is increased during REM sleep deprivation. Fos, Cacna1h, Cacnb, Dusp1, and Nr4a1, with an increased expression during REM sleep deprivation, are also involved in the MAPK signaling pathway (DAVID database). It has been previously shown that the expression of most of these genes is increased in the neocortex after 8 hours of total sleep deprivation and decreases during sleep (57, 58). These results are the basis of the synaptic homeostasis hypothesis proposing that synaptic potentiation occurs during W, whereas global downscaling of synaptic strength occurs during sleep (59). In our study, we showed that the expression of ARC and FOS, but not of Bdnf, is increased during REM sleep deprivation in most neocortices, particularly the sensorimotor ones. These results fit with our microarrays results and suggest that synaptic downscaling might occur during REM sleep in the somatosensory cortices. They are also supported by multiunit recordings showing that the spontaneous activity of neurons localized in the auditory and motor cortices decreases during both NREM and REM sleep compared to W (60). State of the limbic cortical areas during REM sleep We demonstrate here that the expression of Bdnf is increased specifically during REM sleep hypersomnia compared to REM sleep deprivation and control in the claustrum, the cortical amygdaloid nucleus, and the medial entorhinal, anterior cingulate, and retrosplenial cortices. ARC and FOS expression is also increased in most of these structures during REM sleep hypersomnia compared to control. However, ARC 8 of 14
RESEARCH ARTICLE and FOS expression is also increased during REM sleep deprivation. The decoupling between Bdnf, ARC, and FOS in the neocortex does not occur in the hippocampus. This suggests that Bdnf plays a differential role than ARC and FOS in cortical neurons during REM sleep. These results have not been reported before. It has indeed only been reported previously in cats that the number of FOS-labeled neurons localized in the cingulate gyrus during pharmacologically induced REM sleep hypersomnia is larger than during W (9). Using the [14C]deoxyglucose method, it has also been shown that the cingulate cortex uses more glucose during basal REM sleep than during W (8, 52). Further, in humans, cerebral blood flow is increased specifically during REM sleep compared to quiet W in the anterior cingulate gyrus, hippocampus, and entorhinal cortex (3). From these and our results, we propose that neurons localized in the claustrum, the cortical amygdaloid nucleus, and the medial entorhinal, anterior cingulate, and retrosplenial cortices are strongly activated during REM sleep, in contrast to those belonging to the other cortical structures. Further, the increased expression of ARC and Bdnf, two markers of synaptic plasticity, might suggest that synaptic plasticity takes place in these limbic areas during REM sleep. Unit recordings during REM sleep and challenging triple immunohistochemical labeling are, however, necessary to confirm such a hypothesis. Cortical activation during REM sleep is limited to a few limbic structures compared to W We found out that after 3 hours of W, most cortical areas contain many more neurons than after 6 hours of REM sleep hypersomnia, except for the dentate gyrus, which contains significantly fewer FOS+ neurons. These results strongly suggest that the dentate gyrus is more activated during REM sleep than during W, whereas a few limbic cortices are similarly activated both during REM sleep and W. This assumption remains to be confirmed by unit recording, although it is supported by previous works showing that neurons with an increased activity specifically during REM sleep have been recorded in the structures containing neurons expressing FOS after REM sleep rebound (41, 61). However, we cannot rule out the possibility that FOS expression would be more widespread in the cortex if the animals did spend 100% of their time in REM sleep during the last 3 hours like the W group, or if the animals had been exposed to strong stimuli or a learning protocol during REM sleep deprivation. One might also argue that the extensive FOS labeling obtained by our W protocol is more widespread than after spontaneous wakefulness and is due to exposure to a new environment. This seems, however, unlikely because a widespread expression of FOS was previously reported in the cortex after spontaneous wakefulness (19, 62, 63).
In our experiments, the claustrum and/or the SUML was the only structure containing neurons activated (FOS+) during REM sleep hypersomnia and projecting to the anterior cingulate and retrosplenial cortices and the dentate gyrus. Our results confirm the presence of FOS+ neurons in the SUML during REM sleep hypersomnia (9, 23, 31) and further show for the first time that they strongly project to the dentate gyrus. Finally, we demonstrated that SUM lesions cause a marked decrease in the number of FOS+ neurons in the dentate gyrus during REM sleep hypersomnia. These results suggest that granule cells of the dentate gyrus are activated during REM sleep by a projection from neurons located in the SUML. It has previously been shown that SUML neurons projecting to the dentate gyrus are glutamatergic using retrograde tracing of [3H]D-aspartate from the dentate gyrus (64). However, it was then shown that these neurons display a unique dual phenotype for GABAergic and glutamatergic neurotransmission because SUML axon terminals in the dentate gyrus coexpress glutamate decarboxylase 65 and the vesicular GABA (g-aminobutyric acid) and glutamate 2 transporters (65). From these results, it has been hypothesized that the projection of the SUML could simultaneously hyperpolarize the soma and depolarize the dendrites of dentate granule neurons (65). On the basis of these and our results, we propose that the release of glutamate on the dendrites of a subset of granule neurons in the dentate gyrus during REM sleep induces, in addition to Fos, the expression of genes involved in synaptic plasticity such as Bdnf, Arc, Cox2, and others revealed by our microarray study. In addition, we found that the SUM lesions induced a slight but significant decrease in q power during REM sleep but not during NREM sleep and W. In agreement with this last observation, it has been previously reported that lesion or inactivation of the SUML does not induce a decrease in q power during W (66–68). These results suggest that the SUML-dentate gyrus pathway plays a minor role in q rhythm generation during REM sleep, in contrast to the cortical projection from the basal forebrain. Indeed, lesions of the basal forebrain are well known to induce a near-complete suppression of q during REM sleep (69). Our results further strongly suggest that the neuronal activation and synaptic plasticity potentially occurring during REM sleep hypersomnia in the anterior cingulate and retrosplenial cortices would be due to a projection from neurons of the claustrum (Fig. 7). Because the claustrum is known to project to almost all cortical structures (70), the same neurons could also be responsible for the activation of the cortical amygdaloid nucleus and the medial entorhinal cortex. Additional electrophysiological, inactivation, or lesion studies are necessary to confirm such a hypothesis, although this might be a difficult task because the claustrum is a narrow nucleus with a very long rostrocaudal extension.
The SUM and the claustrum are key structures for cortical activation during REM sleep Previous data indicate that cortical activation during REM sleep is induced by projections from cholinergic neurons of the basal forebrain and glutamatergic neurons of the intralaminar thalamic nuclei (13). However, in our study, after injections of retrograde tracers into the dentate gyrus and the retrosplenial or anterior cingulate cortices, a large number of labeled neurons were observed in the intralaminar thalamic nuclei and the basal forebrain, but these neurons did not express FOS during REM sleep hypersomnia. In contrast, many neurons of these structures expressed FOS during W, suggesting that they play a role in cortical activation during this state.
REM sleep and emotional memory The cortical structures revealed here to have an increased expression of plasticity-related genes during REM sleep hypersomnia overlap the network that regulates emotional learning and memory. The anterior cingulate and retrosplenial cortices have indeed been involved in cognitive and emotional processing and in the genesis and recall of complex and coherent scenes or events (71). On the other hand, the dentate gyrus is involved in pattern separation and/or recombination of previous memories to facilitate novel inferences (72). In addition, the claustrum integrates varied types of information that underlie conscious perception and cognition (70). Finally, the SUML has been involved in emotional memory (73, 74). Besides, several studies in humans and
Renouard et al. Sci. Adv. 2015;1:e1400177
3 April 2015
9 of 14
RESEARCH ARTICLE rats suggest a preferential role for REM sleep in modulating affective brain processes and in restoring optimal post-sleep affective reactivity (75). In view of these and our results, it is tempting to propose that the changes in gene expression seen in the present study during REM sleep hypersomnia in a network of limbic cortical neurons play a crucial role in cognitive and emotional information processing.
CONCLUSIONS Our results provide evidence for the first time that selective populations of neurons from the dentate gyrus and a subset of limbic cortices are activated and display synaptic plasticity during REM sleep. They pave the way for the identification of the function of REM sleep by means of behavioral and electrophysiological studies combined with local inactivation of the subcortical pathways revealed.
MATERIALS AND METHODS All experiments were conducted in accordance with the French and European Community guidelines for the use of animals in research and were approved by the institutional animal care and use committee of the University of Lyon 1 (protocols BH 2006-09 and BH 2006-10). Sprague-Dawley rats were housed individually and placed under a constant light/dark cycle (light on from 7:00 a.m. to 7:00 p.m.). Animals and surgery EEG and electromyogram implantation. Sprague-Dawley male rats (6 to 7 weeks old, 260 to 300 g, Charles River) were implanted with EEG and electromyographic (EMG) electrodes under chloral hydrate anesthesia (400 mg/kg, intraperitoneally). Rimadyl (120 mg/kg, intramuscularly) and lidocaine injected subcutaneously were used for analgesia. Two stainless steel screws were fixed in the parietal part and one in the frontal part of the skull, whereas the reference electrode for unipolar EEG recording was fixed in the occipital part. Two wire electrodes were inserted into the neck muscles for bipolar EMG recordings. All leads were connected to a miniature plug (Plastics One Inc.) that was cemented on the skull. Microarray. Thirty-six rats, implanted for EEG and EMG recordings as described above, were used: 12 control animals kept in their home cage, 12 rats deprived of REM sleep, and 12 rats allowed to recover from the deprivation. All rats were decapitated under pentobarbital anesthesia (150 mg/kg intraperitoneally), and their whole brain was removed. Immunohistochemistry and in situ hybridization. Twenty-eight male rats (6 to 7 weeks old, 260 to 300 g, Charles River) were used. Eight rats kept in their home cage were used as control, eight rats were deprived of REM sleep, and eight rats were allowed to recover from REM sleep deprivation (see below). Half of the rats from each group were implanted for EEG and the EMG recordings. Finally, eight rats were submitted to the W protocol (see below). All rats were perfused at the end of the protocol (see below). Tracer injections. Rats (6 to 7 weeks old, 260 to 300 g, Charles River) were anesthetized as described above and placed in a stereotaxic apparatus. Glass micropipettes (4 to 5 mm in outer diameter) were backfilled with a 1% solution of CTb [List Biological Laboratories; diluted in 0.1 M phosphate buffer (PB) at pH 6.0] for injection in the dentate gyrus (n = 4), the retrosplenial cortex (n = 4), and the SUM Renouard et al. Sci. Adv. 2015;1:e1400177
3 April 2015
(n = 4). The four animals with an injection in the retrosplenial cortex were also injected in the anterior cingulate cortex with FG (Fluoprobe, diluted in distilled water at 8 mM and pH 6), a retrograde tracer with similar sensitivity to CTb, to decrease the number of animals used. The pipettes were lowered from the surface of the brain to a depth of −3.5 mm for the dentate gyrus [coordinates: AP (anteroposterior) −3.3 mm to bregma, ML (mediolateral) −0.8 mm lateral to midline], −1.4 mm for the retrosplenial cortex (coordinates: AP −7 mm to bregma, ML +1 mm lateral to midline), −2.2 mm for the anterior cingulate cortex (coordinates, AP +1 mm to bregma, ML −0.8 mm lateral to midline), and −8.3 mm for the SUM (coordinates: AP −4.5 mm to bregma, ML +0.6 mm lateral to midline). CTb and FG were ejected during 10 min with a pulsed positive current (7 s on, 7 s off) of +2 mA for the dentate gyrus and a continuous current of +4 mA for the other cortices. The animals were then implanted for EEG and EMG recordings as described above and subjected to the paradoxical sleep deprivation and recovery procedure (see below) before being perfused. Lesions. Male Sprague-Dawley rats (6 to 7 weeks old, 260 to 300 g, Charles River) were anesthetized as described above and placed in a stereotaxic apparatus. The lesions were made bilaterally in four rats by passing in each SUM a 10mA continuous current for 10 min through a micropipette containing ibotenic acid [25 mM in distilled water adjusted to pH 8 (Tocris); see Fig. 6 for the extent of the lesions in each animal]. Four sham rats were subjected to the same protocol with a micropipette containing 0.9% NaCl. All animals were then implanted for EEG and EMG recordings as described above and subjected to paradoxical sleep deprivation and recovery before being perfused. Polygraphic recordings. Animals were allowed to recover from surgery for 1 week in their home cage (a Plexiglas jar) before being habituated to the recording conditions (recording chamber and cable habituation) for 4 days. Rats were connected to a cable attached to a slip-ring commutator to allow free movement of the animal within the jar. EEG and EMG recordings were amplified (MCP-PLUS, AlphaOmega Engineering) and collected on a computer via a CED interface using the Spike 2 software (Cambridge Electronic Design). Sampling frequency for polygraphic recordings was 520.8 Hz. Their sleep-wake cycle was then recorded during 2 days (baseline). REM sleep deprivation procedure. REM sleep deprivation was performed using the flowerpot method, which has previously been shown to induce a fairly selective deprivation of REM sleep in rats (21, 23). Rats were divided into three groups: control (RSC), deprived of REM sleep for 75 or 78 hours (RSD), and rats allowed to recover for 3 or 6 hours after such deprivation (RSR). The RSC animals remained in their jar on a bed of woodchips in the recording room throughout the experiment. After 48 hours of baseline recordings, RSD and RSR rats were placed at 10:00 a.m. in a jar with 2 to 3 cm of water at the bottom and containing three platforms (6.2 cm in diameter, 7 to 12 cm in height) spaced 7 to 8 cm apart. For the Bdnf and ARC experiments, animals were put on a single platform. During deprivation, the animal could enter NREM but not REM sleep, because of the loss of muscle tone occurring at REM sleep onset. During RSD, food and water were available ad libitum and the container was cleaned daily. On the third day, RSR animals were removed from their cages at 10:00 a.m. and put on a dry bed of woodchips in recording jars to allow REM sleep hypersomnia. Animals were perfused at 1:00 p.m. (for the Bdnf and ARC labeling) or 4:00 p.m. (for the microarray and the FOS, COX2 experiments) under deep pentobarbital anesthesia (Ceva sante animal, 150 mg/kg, intraperitoneally). The RSR rats used for the Bdnf and 10 of 14
RESEARCH ARTICLE ARC experiment were perfused at 3 hours and the other RSR rats at 6 hours after the onset of REM sleep hypersomnia. W protocol. The W protocol was used to induce a continuous period of W during 3 hours. This procedure has been described in detail elsewhere (76). Briefly, W animals were placed in a square 1.5 m × 1.5 m × 0.5 m black open field with numerous colored plastic toys. The light intensity above the open field was the same as that of the animal room. The animals had free access to water and food. The experimenter continuously observed them and the toys were moved when the animals seemed to get sleepy. After 3 hours (1 to 4 p.m.), all animals were perfused for histology.
Table 1. Primers used for PCR. Annealing gene
Primer sequence Forward: GCATTGCTGACAGGATGCAG
bAct Reverse: CATCGTACTCCTGCTTGCTG Forward: ACAGTGGCAACACTTTGTGG Zif-268 Reverse: ATGTCAGTGTTGGGAGTAGG Forward: TTGTAGTGACACCTGAGAGC
Techniques Microarray: Labeling, hybridization, and data analysis. In the 36 rats used (12 RSC, 12 RSD, and 12 RSR animals), the part of the brain rostral to the optic chiasm was eliminated and the right cortex and hippocampal formation were dissected and stored at −80°C. Total RNA was isolated from the cortex and hippocampal formation of each animal by using RNeasy Lipid Tissue Mini Kit (Qiagen) and RNase-Free DNase Set (Qiagen) to eliminate DNA contamination according to the manufacturer’s instructions. An equal mass amount of total RNA from the cortex and hippocampal formation was pooled from two sets of six rats from each experimental group (RSC, RSD, and RSR; 36 mg per pool). Pool RNAs were then sent to the Affymetrix core facility located at the IGBMC in Strasbourg (France) to be hybridized on GeneChip rat 230 2.0 with the standard Affymetrix protocol (Expression 10 Analysis Technical Manual, ref 701021 rev.5, Affymetrix). Arrays were scanned using the GeneChip Scanner 3000 and analyzed with Affymetrix GeneChip Operating software (GCOS) version 1.2 using default analysis settings and global scaling as normalization method. The trimmed mean target intensity of each array was arbitrarily set to 100. Significant transcript expression changes were determined with a paired nonparametric test (Microarray Suite 5.0, Affymetrix). For each intergroup comparison (RSC versus RSD, RSC versus RSR, and RSD versus RSR), transcript expression level was considered as modified in the hippocampus or the neocortex between two experimental conditions when it was designed as decreased (D) or increased (I) for both replicas. On the basis of this analysis, we classified these transcripts into four groups listed in table S1: increased (I-RSD) or decreased (D-RSD) expression during RSD compared to RSC, increased (I-RSR) or decreased (D-RSR) expression during RSR compared to RSD, and/or RSC (table S1). Transcripts with a signal intensity inferior to 50 in all the experimental conditions were discarded. Transcripts with a significant expression change between two conditions but a log ratio inferior to 0.4 were also eliminated from the list. Because our aim in the present study was to determine the genes positively linked with REM sleep, we focused our analysis on the genes with a strong increased expression during RSR compared to RSC and/or RSD. All the genes of this type belonged to the I-RSR category. Quantitative real-time PCR. Quantitative real-time PCR was performed with a LightCycler system (Roche Diagnostic). Reverse transcription reactions were performed, for each animal (n = 18) and each pool (n = 3; RSC, RSD, and RSR) of one of the two series of animals used for the microarrays, with the M-MLV Reverse Transcriptase Kit (Invitrogen) according to the manufacturer’s instructions (1 mg of total RNA). Reverse primers (Table 1), 15 ml of Mix prepared with LightCycler FastStart DNA Master SYBR Green Kit (Roche Diagnostic), and 5 ml of cDNA were used to a total volume of 20 ml. Renouard et al. Sci. Adv. 2015;1:e1400177
3 April 2015
Fos Reverse: TCCAGCACCAGGTTAATTCC Forward: AGTGAGAAGGAAGATGCAGG Sgk Reverse: CTGCACACATGGGAAATACG Forward: CCACTTCCAACTCAAGTTCG Cox2 Reverse: GTTTGAAAGTGTACTCCTGG Forward: AGAGCAGGGAAGGGAACATC Gpd1 Reverse: AGAGAAAGGGAGGGGATTCA Forward: TACACAACCATCCCCACTGA Sult1a1 Reverse: GTTTGCCTTGGTTCCCAGTA Forward: GTGACAGTATTAGCGAGTGG Bdnf Reverse: TTCCTTCGTGTAACCCATGG Forward: TCCTGCAGATTGGTAAGTGC Arc Reverse: CTTGATGGACTTCTTCCAGC Forward: ACCTATCTTCAGCACTCGAG Homer1 Reverse: GCCGTCTACACTGATTATCC
Dilution series standard curves were performed for each primer pair, using reverse transcription products from rat brain total RNA. Quantitative PCR (qPCR) was done for each sample condition assayed, and relative quantities were determined on the basis of the equation of the line of best fit derived from the standard curve. Immunohistochemistry. Animals were perfused with 4% paraformaldehyde in 0.1 M PB (pH 7.4). Brains were postfixed for 12 hours at 4°C and then stored for 2 days at 4°C in PB with 30% sucrose. The brains were rapidly frozen with CO2 gas, sliced in 25-mm-thick coronal sections, and stored in PB containing 0.9% NaCl, 0.3% Triton X-100, and 0.1% sodium azide (PBST-Az). They were successively incubated in (i) a rabbit antiserum to FOS [1:5000; Oncogene, cat. #PC38 (Ab-5)] or a rabbit antiserum to ARC (1:10,000; Synaptic systems, cat. #156 003) or a goat antiserum to COX2 (1:1000; Upstate, cat. #07-693) in PBST-Az for 3 days at 4°C; (ii) a biotinylated anti-rabbit or anti-goat immunoglobulin G (IgG) solution (1:1000 in PBST; Vector Labs, cat. #BA-1000 and #BA-9500, respectively); and (iii) an ABC–horseradish peroxidase 11 of 14
RESEARCH ARTICLE solution (1:1000 in PBST; Elite kit, Vector Labs) for 90 min at room temperature. Finally, the sections were immersed in a 0.05 M trisHCl buffer (pH 7.6) containing 0.025% 3,3′-diaminobenzidine–4 HCl (DAB; Sigma), 0.003% H2O2, and 0.6% nickel ammonium sulfate to obtain a black reaction product. FOS-stained sections were reincubated in the goat antiserum to CTb (1:100,000; Calbiochem, cat. #227040) or in the rabbit antiserum to FG (1:20,000; US Biological, cat. #F5037) and then put in a DAB solution without nickel to obtain a brown reaction product. Controls with omission of the primary or secondary antibodies were run to check for the absence of nonspecific staining and cross-reactions in the case of dual immunostaining. Specificity of the FOS antiserum has been previously evaluated by direct colabeling for c-fos mRNA and abolition of specific staining in experimental and control tissue by preadsorbing the antiserum with the synthetic peptide immunogen (77). It has also previously been shown that ARC immunofluorescence obtained with the ARC antiserum was abolished after transfection of short hairpin RNA against Arc (78). Finally, the same specific staining of granule cells of the dentate gyrus as the one reported in the present study has been reported previously using another COX2 antibody and Cox2 mRNA in situ hybridization (79). Sections of the RSR-lesion and RSR-sham rats at the level of the SUM were incubated with a mouse antiserum to NeuN (1:20,000; Chemicon, cat. #MAB377B), followed by an incubation with a biotinylated anti-mouse IgG solution (1:1000 in PBST; Vector Labs, cat. #BA-9200). Sections were then mounted and counterstained with neutral red. In situ hybridization of Bdnf. Free-floating sections of RSC (n = 4), RSD (n = 4), and RSR (n = 4) rat brains were collected and stored at −20°C in ribonuclease (RNase)–free cryoprotectant solution (0.05% diethyl pyrocarbonate, 20% glycerol, 30% ethylene glycol in 50 mM PB, pH 7.4). Bdnf cDNA was obtained from a recombinant plasmid containing Bdnf cDNA sequence (80) and linearized using Sma I or Hind III (for antisense and sense riboprobes, respectively) (New England Biolabs). The antisense riboprobe contained a 467–base pair (bp) fragment corresponding to bases 283 to 750 of the rat BDNF mRNA (GenBank accession number AY176065.1). The sense riboprobe contained the entire sequence of the BDNF mRNA (750 bp). Sense and antisense Bdnf riboprobes were synthesized using T3/T7 and T7/SP6 RNA polymerases, respectively. All riboprobes were transcribed using a nonradioactive RNA labeling kit (Roche Diagnostic) following the manufacturer’s instructions. Digoxigenin-labeled riboprobes were then stored at −20°C in hybridization buffer (see below). Sections were rinsed 3 × 10 min in a standard saline citrate solution (2×SSC) containing 0.2% RNase inhibitor (Protect RNA RNase inhibitor, SigmaAldrich). Then, sections were incubated overnight at 65°C in a wet chamber in hybridization buffer [150 mM NaCl, 8 mM tris-HCl, 1 mM tris base, 6 mM NaH2PO4, 5 mM Na2HPO4, 5 mM EDTA, 50% formamide, 10% dextran sulfate, yeast transfer RNA (Sigma type III, 1 mg/ml, Sigma-Aldrich), 0.02% Ficoll, 0.02% polyvinylpyrrolidone] containing Bdnf riboprobe (1.89 mg/ml). After hybridization, the sections were rinsed 2 × 10 min at 65°C in a 1×SSC solution containing 0.1% Tween 20 and 50% formamide and treated for 15 min at 37°C with RNase A (10 mg/ml; US Biological) in a 10 mM tris solution (pH 8.0) containing 1 mM EDTA and 500 mM NaCl. Sections were then rinsed 3 × 10 min at room temperature in 10 mM PB containing 0.9% NaCl and 0.3% Triton X-100 (PBST). For immunohistochemical detection of digoxigenin, the sections were incubated overnight at room temperature with a digoxigenin antibody conjugated to alkaline phosphatase Renouard et al. Sci. Adv. 2015;1:e1400177
3 April 2015
(Roche Diagnostic) diluted 1:2000 in PBST containing 0.2% blocking reagent (Roche Diagnostic). After incubation, the sections were washed 2 × 10 min in PBST, 10 min in PBS, and then in a buffer containing 100 mM tris (pH 9.5), 100 mM NaCl, and 50 mM MgCl2. The sections were developed at 37°C for nearly 4 hours in the same buffer containing nitro blue tetrazolium and 5-bromo-4-chloro-3-indolyl-phosphate (BCIP) diluted 1:50 from the stock solution (Roche Diagnostic). The reaction was stopped when the ratio signal/background was optimal. Finally, the sections were mounted on glass slides, dried, and coverslipped with VectaMount (Vector Labs). Analysis Analysis of the sleep-wake states. The vigilance states of 10-s episodes of EEG and EMG recordings were identified according to the criteria described in detail elsewhere. The waking and the NREM and REM sleep stages have been quantified during the last 3 or 6 hours before euthanasia in all animals used for the microarrays, the qPCR, the Bdnf staining, the RSR-sham and RSR-lesion rats, and the RSR animals with a retrograde tracer injection. State classification was done by a visual check of polygraphic signals. Waking was characterized by a desynchronized (activated) low-amplitude EEG accompanied by sustained EMG activity; NREM sleep was distinguished by high-voltage slow waves (1.5 to 4.0 Hz) and spindles (10 to 14 Hz) and the disappearance of phasic muscle activity. The occurrence of muscle atonia with a regular and pronounced q rhythm (4 to 9 Hz) characterized REM sleep. Hypnograms were drawn using a homemade script in Spike-2 software (CED). The means (±SEM) of the vigilance state quantities were then calculated for each condition. In addition, normalized EEG spectral power was calculated with a Spike-2 script computing a fast Fourier transform on 5-s EEG epochs (0.1-Hz resolution) during REM sleep recovery in the RSR-sham and RSR-lesion animals. The mean (±SEM) of the power of each band of the EEG was then calculated (frequency range: D, 0.5 to 4.5 Hz; q, 5 to 9 Hz; s, 10 to 14 Hz; b1, 15 to 22.5 Hz; b2, 22.5 to 30 Hz; g, 30 to 48 Hz). Analysis of immunostaining. The atlas of Swanson was used as a reference for all structures (81). Drawings of double- or single-labeled sections were made with an Axioskop microscope (Zeiss) equipped with a motorized XY-sensitive stage and a video camera connected to a computerized image analysis system (Mercator, ExploraNova). The staining intensity level of Bdnf RNA expression and the distribution of the FOS (FOS+) and ARC (ARC+) immunoreactive cells was evaluated in four animals per condition on hemisections taken at exactly the same level (+0.45 mm, −3.70 mm, −7.10 mm from bregma) (see an example of selected sections in fig. S2). The number of FOS+ and ARC+ neurons was counted semiautomatically using the Mercator software. A first selection of FOS+ and ARC+ neurons was made automatically with the Mercator software using staining threshold, diameter, and form factor. The experimenter then confirmed the accuracy of the detection for each neuron selected. The COX2 staining intensity level was measured in the different regions of the hippocampal formation at −3.70 mm from bregma in the three conditions (RSC, RSD, and RSR). For Bdnf and COX2, photomicrographs of each cortical region studied were analyzed using ImageJ software. The optical density was first normalized using the white matter reading of each analyzed section and then measured for each structure inside 20 squares of 60 pixels randomly distributed. Using Mercator (ExploraNova), the FOS/CTb+, singly CTb+ or FOS/FG+, and singly FG+ labeled cells were plotted in four RSR animals for each structure studied on sections quantified every 600 mm (25 sections). The number of FOS+ 12 of 14
RESEARCH ARTICLE neurons in RSR and W animals was also quantified on sections at the level of the SUM (−4.5 mm from bregma), the basal forebrain (+0.45 mm from bregma), and the thalamic nuclei (−3.5 mm from bregma). The mean diameter of the FOS+ and ARC+ labeled neurons was calculated for each structure and each animal using Mercator software. The Abercrombie correction factor (82) was then applied on the number of FOS+ and ARC+ plotted neurons to correct for duplicate counting. Statistical analysis. Analysis of variance (Kruskal-Wallis test followed by Mann-Whitney test) was performed on the different vigilance states, power spectrum analysis, gene expression level, and the number of labeled neurons for each structure across experimental conditions (RSC, RSD, RSR, W, RSR-sham, and RSR-lesion). The Spearman test was used to identify significant correlations between vigilance state amounts and gene expression level. All statistics were performed using StatView.
SUPPLEMENTARY MATERIALS Supplementary material for this article is available at http://advances.sciencemag.org/cgi/content/ full/1/3/e1400177/DC1 Fig. S1. Histograms showing gene expression levels in the hippocampus and cortex of RSC, RSD, and RSR rats and correlations between the amount of REM sleep and the expression level of several genes. Fig. S2. Series of representative schematic transverse sections depicting the location of FOSlabeled cells (black dots) in representative RSC, RSD, RSR, and W rats. Fig. S3. EEG analysis after lesion of the SUM. Table S1. Complete listing of the genes and ESTs in the hippocampus and in the neocortex with a modification of expression level induced by our protocol. Table S2. Mean number (±SEM) of cells or value of optical density quantified in cortical regions on sections labeled for Bdnf (A), ARC (B), and COX2 (C) in RSC, RSD, and RSR rats. Table S3. Mean number (±SEM) of neurons immunoreactive for FOS in RSC, RSD, RSR, and W rats. Table S4. Mean number (±SEM) of CTb/FOS+ and singly CTb+ neurons in RSR rats (n = 4) with a CTb injection in the dentate gyrus and CTb injection in the retrosplenial cortex. Table S5. Mean number (±SEM) of FG/FOS+ double-labeled neurons and singly FG+ neurons in RSR rats (n = 4) with an FG injection in the anterior cingulate cortex. Table S6. Mean number (±SEM) of FOS immunoreactive cells in RSR and W animals (n = 4 per condition) in the basal forebrain, the SUM, and the thalamus. Table S7. Mean number (±SEM) of FOS immunoreactive neurons in cortical regions in the RSR-sham and RSR-lesion animals.
REFERENCES AND NOTES 1. W. C. Dement, N. Kleitman, Cyclic variations of EEG during sleep and their relation to eye movement, body motility, and dreaming. Electroencephalogr. Clin. Neurophysiol. 9, 673–690 (1957). 2. K. J. Maloney, E. G. Cape, J. Gotman, B. E. Jones, High-frequency g electroencephalogram activity in association with sleep-wake states and spontaneous behaviors in the rat. Neuroscience 76, 541–555 (1997). 3. P. Maquet, J. Péters, J. Aerts, G. Delfiore, C. Degueldre, A. Luxen, G. Franck, Functional neuroanatomy of human rapid-eye-movement sleep and dreaming. Nature 383, 163–166 (1996). 4. V. V. Vyazovskiy, U. Olcese, Y. M. Lazimy, U. Faraguna, S. K. Esser, J. C. Williams, C. Cirelli, G. Tononi, Cortical firing and sleep homeostasis. Neuron 63, 865–878 (2009). 5. M. Steriade, I. Timofeev, F. Grenier, Natural waking and sleep states: A view from inside neocortical neurons. J. Neurophysiol. 85, 1969–1985 (2001). 6. E. A. Nofzinger, M. A. Mintun, M. Wiseman, D. J. Kupfer, R. Y. Moore, Forebrain activation in REM sleep: An FDG PET study. Brain Res. 770, 192–201 (1997). 7. A. R. Braun, T. J. Balkin, N. J. Wesenten, R. E. Carson, M. Varga, P. Baldwin, S. Selbie, G. Belenky, P. Herscovitch, Regional cerebral blood flow throughout the sleep-wake cycle. An H2(15)O PET study. Brain 120, 1173–1197 (1997). 8. R. Lydic, H. A. Baghdoyan, L. Hibbard, E. V. Bonyak, M. R. DeJoseph, R. A. Hawkins, Regional brain glucose metabolism is altered during rapid eye movement sleep in the cat: A preliminary study. J. Comp. Neurol. 304, 517–529 (1991). 9. J. P. Sastre, C. Buda, J. S. Lin, M. Jouvet, Differential c-fos expression in the rhinencephalon and striatum after enhanced sleep–wake states in the cat. Eur. J. Neurosci. 12, 1397–1410 (2000). 10. J. Luo, T. X. Phan, Y. Yang, M. G. Garelick, D. R. Storm, Increases in cAMP, MAPK activity, and CREB phosphorylation during REM sleep: Implications for REM sleep and memory consolidation. J. Neurosci. 33, 6460–6468 (2013).
Renouard et al. Sci. Adv. 2015;1:e1400177
3 April 2015
11. S. Ribeiro, V. Goyal, C. V. Mello, C. Pavlides, Brain gene expression during REM sleep depends on prior waking experience. Learn. Mem. 6, 500–508 (1999). 12. S. Ribeiro, C. V. Mello, T. Velho, T. J. Gardner, E. D. Jarvis, C. Pavlides, Induction of hippocampal long-term potentiation during waking leads to increased extrahippocampal zif-268 expression during ensuing rapid-eye-movement sleep. J. Neurosci. 22, 10914–10923 (2002). 13. P. Fort, C. L. Bassetti, P. H. Luppi, Alternating vigilance states: New insights regarding neuronal networks and mechanisms. Eur. J. Neurosci. 29, 1741–1753 (2009). 14. C. B. Saper, P. M. Fuller, N. P. Pedersen, J. Lu, T. E. Scammell, Sleep state switching. Neuron 68, 1023–1042 (2010). 15. M. Ashburner, S. Lewis, On ontologies for biologists: The Gene Ontology—Untangling the web. Novartis Found. Symp. 247, 66–80 (2002). 16. C. C. Tsui, N. G. Copeland, D. J. Gilbert, N. A. Jenkins, C. Barnes, P. F. Worley, Narp, a novel member of the pentraxin family, promotes neurite outgrowth and is dynamically regulated by neuronal activity. J. Neurosci. 16, 2463–2478 (1996). 17. K. Yamagata, K. I. Andreasson, H. Sugiura, E. Maru, M. Dominique, Y. Irie, N. Miki, Y. Hayashi, M. Yoshioka, K. Kaneko, H. Kato, P. F. Worley, Arcadlin is a neural activity-regulated cadherin involved in long term potentiation. J. Biol. Chem. 274, 19473–19479 (1999). 18. J. F. Guzowski, Insights into immediate-early gene function in hippocampal memory consolidation using antisense oligonucleotide and fluorescent imaging approaches. Hippocampus 12, 86–104 (2002). 19. C. Cirelli, M. Pompeiano, G. Tononi, Neuronal gene expression in the waking state: A role for the locus coeruleus. Science 274, 1211–1215 (1996). 20. R. P. Vertes, PHA-L analysis of projections from the supramammillary nucleus in the rat. J. Comp. Neurol. 326, 595–622 (1992). 21. L. Verret, R. Goutagny, P. Fort, L. Cagnon, D. Salvert, L. Leger, R. Boissard, P. Salin, C. Peyron, P. H. Luppi, A role of melanin-concentrating hormone producing neurons in the central regulation of paradoxical sleep. BMC Neurosci. 4, 19 (2003). 22. L. Verret, L. Leger, P. Fort, P. H. Luppi, Cholinergic and noncholinergic brainstem neurons expressing Fos after paradoxical (REM) sleep deprivation and recovery. Eur. J. Neurosci. 21, 2488–2504 (2005). 23. L. Verret, P. Fort, D. Gervasoni, L. Leger, P. H. Luppi, Localization of the neurons active during paradoxical (REM) sleep and projecting to the locus coeruleus noradrenergic neurons in the rat. J. Comp. Neurol. 495, 573–586 (2006). 24. J. E. Sherin, P. J. Shiromani, R. W. McCarley, C. B. Saper, Activation of ventrolateral preoptic neurons during sleep. Science 271, 216–219 (1996). 25. K. J. Maloney, L. Mainville, B. E. Jones, Differential c-Fos expression in cholinergic, monoaminergic, and GABAergic cell groups of the pontomesencephalic tegmentum after paradoxical sleep deprivation and recovery. J. Neurosci. 19, 3057–3072 (1999). 26. K. J. Maloney, L. Mainville, B. E. Jones, c-Fos expression in dopaminergic and GABAergic neurons of the ventral mesencephalic tegmentum after paradoxical sleep deprivation and recovery. Eur. J. Neurosci. 15, 774–778 (2002). 27. K. J. Maloney, L. Mainville, B. E. Jones, c-Fos expression in GABAergic, serotonergic, and other neurons of the pontomedullary reticular formation and raphe after paradoxical sleep deprivation and recovery. J. Neurosci. 20, 4669–4679 (2000). 28. R. Boissard, D. Gervasoni, M. H. Schmidt, B. Barbagli, P. Fort, P. H. Luppi, The rat pontomedullary network responsible for paradoxical sleep onset and maintenance: A combined microinjection and functional neuroanatomical study. Eur. J. Neurosci. 16, 1959–1973 (2002). 29. J. Lu, D. Sherman, M. Devor, C. B. Saper, A putative flip–flop switch for control of REM sleep. Nature 441, 589–594 (2006). 30. E. Sapin, D. Lapray, A. Berod, R. Goutagny, L. Leger, P. Ravassard, O. Clement, L. Hanriot, P. Fort, P. H. Luppi, Localization of the brainstem GABAergic neurons controlling paradoxical (REM) sleep. PLOS One 4, e4272 (2009). 31. E. Sapin, A. Berod, L. Leger, P. A. Herman, P. H. Luppi, C. Peyron, A very large number of GABAergic neurons are activated in the tuberal hypothalamus during paradoxical (REM) sleep hypersomnia. PLOS One 5, e11766 (2010). 32. O. Clément, E. Sapin, A. Bérod, P. Fort, P. H. Luppi, Evidence that neurons of the sublaterodorsal tegmental nucleus triggering paradoxical (REM) sleep are glutamatergic. Sleep 34, 419–423 (2011). 33. K. C. Hsieh, I. Gvilia, S. Kumar, A. Uschakov, D. McGinty, M. N. Alam, R. Szymusiak, c-Fos expression in neurons projecting from the preoptic and lateral hypothalamic areas to the ventrolateral periaqueductal gray in relation to sleep states. Neuroscience 188, 55–67 (2011). 34. F. R. Morales, S. Sampogna, C. Rampon, P. H. Luppi, M. H. Chase, Brainstem glycinergic neurons and their activation during active (rapid eye movement) sleep in the cat. Neuroscience 142, 37–47 (2006). 35. F. R. Morales, S. Sampogna, J. Yamuy, M. H. Chase, c-fos expression in brainstem premotor interneurons during cholinergically induced active sleep in the cat. J. Neurosci. 19, 9508–9518 (1999). 36. M. Modirrousta, L. Mainville, B. E. Jones, Orexin and MCH neurons express c-Fos differently after sleep deprivation vs. recovery and bear different adrenergic receptors. Eur. J. Neurosci. 21, 2807–2816 (2005).
13 of 14
RESEARCH ARTICLE 37. J. Yamuy, J. R. Mancillas, F. R. Morales, M. H. Chase, C-fos expression in the pons and medulla of the cat during carbachol-induced active sleep. J. Neurosci. 13, 2703–2718 (1993). 38. Y. Koyama, K. Takahashi, T. Kodama, Y. Kayama, State-dependent activity of neurons in the perifornical hypothalamic area during sleep and waking. Neuroscience 119, 1209–1219 (2003). 39. R. Goutagny, P. H. Luppi, D. Salvert, D. Lapray, D. Gervasoni, P. Fort, Role of the dorsal paragigantocellular reticular nucleus in paradoxical (rapid eye movement) sleep generation: A combined electrophysiological and anatomical study in the rat. Neuroscience 152, 849–857 (2008). 40. R. Goutagny, P. H. Luppi, D. Salvert, D. Gervasoni, P. Fort, GABAergic control of hypothalamic melanin-concentrating hormone-containing neurons across the sleep-waking cycle. Neuroreport 16, 1069–1073 (2005). 41. O. K. Hassani, M. G. Lee, B. E. Jones, Melanin-concentrating hormone neurons discharge in a reciprocal manner to orexin neurons across the sleep–wake cycle. Proc. Natl. Acad. Sci. U.S.A. 106, 2418–2422 (2009). 42. O. K. Hassani, P. Henny, M. G. Lee, B. E. Jones, GABAergic neurons intermingled with orexin and MCH neurons in the lateral hypothalamus discharge maximally during sleep. Eur. J. Neurosci. 32, 448–457 (2010). 43. P. H. Luppi, R. Boissard, D. Gervasoni, L. Verret, R. Goutagny, C. Peyron, D. Salvert, L. Leger, B. Barbagli, P. Fort, in Sleep: Circuits and Function, P. H. Luppi, Ed. (CRC Press, Boca Raton, FL, 2004), pp. 272. 44. C. Sirieix, D. Gervasoni, P. H. Luppi, L. Leger, Role of the lateral paragigantocellular nucleus in the network of paradoxical (REM) sleep: An electrophysiological and anatomical study in the rat. PLOS One 7, e28724 (2012). 45. P. H. Luppi, O. Clement, E. Sapin, C. Peyron, D. Gervasoni, L. Leger, P. Fort, Brainstem mechanisms of paradoxical (REM) sleep generation. Pflugers Arch. 463, 43–52 (2012). 46. L. Yassin, B. L. Benedetti, J. S. Jouhanneau, J. A. Wen, J. F. Poulet, A. L. Barth, An embedded subnetwork of highly active neurons in the neocortex. Neuron 68, 1043–1050 (2010). 47. M. Dragunow, R. Faull, The use of c-fos as a metabolic marker in neuronal pathway tracing. J. Neurosci. Methods 29, 261–265 (1989). 48. K. R. Melia, A. E. Ryabinin, R. Schroeder, F. E. Bloom, M. C. Wilson, Induction and habituation of immediate early gene expression in rat brain by acute and repeated restraint stress. J. Neurosci. 14, 5929–5938 (1994). 49. K. Wibrand, E. Messaoudi, B. Havik, V. Steenslid, R. Lovlie, V. M. Steen, C. R. Bramham, Identification of genes co-upregulated with Arc during BDNF-induced long-term potentiation in adult rat dentate gyrus in vivo. Eur. J. Neurosci. 23, 1501–1511 (2006). 50. T. Ingi, A. M. Krumins, P. Chidiac, G. M. Brothers, S. Chung, B. E. Snow, C. A. Barnes, A. A. Lanahan, D. P. Siderovski, E. M. Ross, A. G. Gilman, P. F. Worley, Dynamic regulation of RGS2 suggests a novel mechanism in G-protein signaling and neuronal plasticity. J. Neurosci. 18, 7178–7188 (1998). 51. J. D. English, J. D. Sweatt, A requirement for the mitogen-activated protein kinase cascade in hippocampal long term potentiation. J. Biol. Chem. 272, 19103–19106 (1997). 52. P. Ramm, B. J. Frost, Cerebral and local cerebral metabolism in the cat during slow wave and REM sleep. Brain Res. 365, 112–124 (1986). 53. S. M. Montgomery, A. Sirota, G. Buzsaki, Theta and gamma coordination of hippocampal networks during waking and rapid eye movement sleep. J. Neurosci. 28, 6731–6741 (2008). 54. A. D. Grosmark, K. Mizuseki, E. Pastalkova, K. Diba, G. Buzsaki, REM sleep reorganizes hippocampal excitability. Neuron 75, 1001–1007 (2012). 55. W. D. Snider, Functions of the neurotrophins during nervous system development: What the knockouts are teaching us. Cell 77, 627–638 (1994). 56. G. M. Sia, J. C. Beique, G. Rumbaugh, R. Cho, P. F. Worley, R. L. Huganir, Interaction of the N-terminal domain of the AMPA receptor GluR4 subunit with the neuronal pentraxin NP1 mediates GluR4 synaptic recruitment. Neuron 55, 87–102 (2007). 57. C. Cirelli, C. M. Gutierrez, G. Tononi, Extensive and divergent effects of sleep and wakefulness on brain gene expression. Neuron 41, 35–43 (2004). 58. S. Maret, S. Dorsaz, L. Gurcel, S. Pradervand, B. Petit, C. Pfister, O. Hagenbuchle, B. F. O’Hara, P. Franken, M. Tafti, Homer1a is a core brain molecular correlate of sleep loss. Proc. Natl. Acad. Sci. U.S.A. 104, 20090–20095 (2007). 59. G. Tononi, C. Cirelli, Sleep and synaptic homeostasis: A hypothesis. Brain Res. Bull. 62, 143–150 (2003). 60. Y. Nir, V. V. Vyazovskiy, C. Cirelli, M. I. Banks, G. Tononi, Auditory responses and stimulus-specific adaptation in rat auditory cortex are preserved across NREM and REM sleep. Cereb. Cortex 10.1093/cercor/bht328 (2013). 61. R. Goutagny, P. H. Luppi, D. Salvert, D. Lapray, D. Gervosoni, P. Fort, Role of dorsal paragigantocellular nucleus in paradoxical (rapid eye movement) sleep regulation: A combined electrophysiological and anatomical study in the rat. Neuroscience 152, 849–857 (2008). 62. M. Pompeiano, C. Cirelli, G. Tononi, Immediate-early genes in spontaneous wakefulness and sleep: Expression of c-fos and NGFI-A mRNA and protein. J. Sleep Res. 3, 80–96 (1994). 63. C. Cirelli, G. Tononi, On the functional significance of c-fos induction during the sleep-waking cycle. Sleep 23, 453–469 (2000). 64. J. Kiss, A. Csaki, H. Bokor, M. Shanabrough, C. Leranth, The supramammillo-hippocampal and supramammillo-septal glutamatergic/aspartatergic projections in the rat: A combined [3H]D-aspartate autoradiographic and immunohistochemical study. Neuroscience 97, 657–669 (2000).
Renouard et al. Sci. Adv. 2015;1:e1400177
3 April 2015
65. R. Soussi, N. Zhang, S. Tahtakran, C. R. Houser, M. Esclapez, Heterogeneity of the supramammillary– hippocampal pathways: Evidence for a unique GABAergic neurotransmitter phenotype and regional differences. Eur. J. Neurosci. 32, 771–785 (2010). 66. I. J. Kirk, Frequency modulation of hippocampal theta by the supramammillary nucleus, and other hypothalamo–hippocampal interactions: Mechanisms and functional implications. Neurosci. Biobehav. Rev. 22, 291–302 (1998). 67. M. Ruan, C. K. Young, N. McNaughton, Minimal driving of hippocampal theta by the supramammillary nucleus during water maze learning. Hippocampus 21, 1074–1081 (2011). 68. J. S. Thinschmidt, G. G. Kinney, B. Kocsis, The supramammillary nucleus: Is it necessary for the mediation of hippocampal theta rhythm? Neuroscience 67, 301–312 (1995). 69. R. P. Vertes, B. Kocsis, Brainstem-diencephalo-septohippocampal systems controlling the theta rhythm of the hippocampus. Neuroscience 81, 893–926 (1997). 70. F. C. Crick, C. Koch, What is the function of the claustrum? Philos. Trans. R. Soc. Lond. B Biol. Sci. 360, 1271–1279 (2005). 71. R. J. Maddock, The retrosplenial cortex and emotion: New insights from functional neuroimaging of the human brain. Trends Neurosci. 22, 310–316 (1999). 72. J. K. Leutgeb, S. Leutgeb, M. B. Moser, E. I. Moser, Pattern separation in the dentate gyrus and CA3 of the hippocampus. Science 315, 961–966 (2007). 73. L. Aranda, A. Begega, J. Sanchez-Lopez, J. A. Aguirre, J. L. Arias, L. J. Santin, Temporary inactivation of the supramammillary area impairs spatial working memory and spatial reference memory retrieval. Physiol. Behav. 94, 322–330 (2008). 74. S. Shahidi, F. Motamedi, S. A. Bakeshloo, B. K. Taleghani, The effect of reversible inactivation of the supramammillary nucleus on passive avoidance learning in rats. Behav. Brain Res. 152, 81–87 (2004). 75. M. P. Walker, The role of sleep in cognition and emotion. Ann. N. Y. Acad. Sci. 1156, 168–197 (2009). 76. L. Léger, R. Goutagny, E. Sapin, D. Salvert, P. Fort, P. H. Luppi, Noradrenergic neurons expressing Fos during waking and paradoxical sleep deprivation in the rat. J. Chem. Neuroanat. 37, 149–157 (2009). 77. J. Serrats, P. E. Sawchenko, CNS activational responses to staphylococcal enterotoxin B: T-lymphocyte-dependent immune challenge effects on stress-related circuitry. J. Comp. Neurol. 495, 236–254 (2006). 78. M. W. Waung, B. E. Pfeiffer, E. D. Nosyreva, J. A. Ronesi, K. M. Huber, Rapid translation of Arc/Arg3.1 selectively mediates mGluR-dependent LTD through persistent increases in AMPAR endocytosis rate. Neuron 59, 84–97 (2008). 79. W. E. Kaufmann, P. F. Worley, J. Pegg, M. Bremer, P. Isakson, COX-2, a synaptically induced enzyme, is expressed by excitatory neurons at postsynaptic sites in rat cerebral cortex. Proc. Natl. Acad. Sci. U.S.A. 93, 2317–2321 (1996). 80. P. C. Maisonpierre, M. M. Le Beau, R. Espinosa 3rd, N. Y. Ip, L. Belluscio, S. M. de la Monte, S. Squinto, M. E. Furth, G. D. Yancopoulos, Human and rat brain-derived neurotrophic factor and neurotrophin-3: Gene structures, distributions, and chromosomal localizations. Genomics 10, 558–568 (1991). 81. L. W. Swanson, Brain Maps: Structure of the Rat Brain: A Laboratory Guide with Printed and Electronic Templates for Data, Models, and Schematics (Elsevier, New York, ed. 2, 1998), pp. vii, 267. 82. M. Abercrombie, Estimation of nuclear population from microtome sections. Anat. Rec. 94, 239–247 (1946). Funding: This work was supported by INSERM (U1028), CNRS (UMR5292), and University Lyon 1. It was also funded by the Program “CNRS puces à ADN” and the Program “Ministère de la Recherche et Réseau National des Génopoles, aide à l’achat de puces à ADN Affymetrix.” L.R. received a financial support from the French Ministry of Research and the “Société Française de Recherche et Médecine du Sommeil” (SFRMS). Author contributions: M.A., P.F., and P.-H.L. wrote and obtained the grants for the microarray study. M.A., K.O., and L.R. implanted the group of rats for the microarray study. C.P., L.L., L.R., C.S.-B., and N.G. dissected the brains for the microarray study. K.O. scored the vigilance states of the rats for the microarray study. N.G., C.S.-B., M.A., and N.C. carried out qPCR. L.R. and P.-H.L. analyzed the data of the microarray. N.C., D.S., P.F., R.T., L.L., F.B., and L.R. performed the immunohistochemical study. L.R. and F.B. analyzed the immunohistochemical data. O.C. performed the Bndf experiment. K.O. and L.R. performed the lesions, and L.R. and F.B. collected and analyzed data from the rats. L.R. performed and analyzed the experiments with tracer injections. P.-A.L. wrote the program of the spectral analysis, and L.R. analyzed the sleep data. P.-H.L. and L.R. wrote the article; L.R. made the figures. G.M., L.L., P.R., P.F., P.S., B.C., and P.R. corrected the manuscript. P.R. participated in the surgeries for the microarray study. Submitted 5 December 2014 Accepted 11 March 2015 Published 3 April 2015 10.1126/sciadv.1400177 Citation: L. Renouard, F. Billwiller, K. Ogawa, O. Clément, N. Camargo, M. Abdelkarim, N. Gay, C. Scoté-Blachon, R. Touré, P.-A. Libourel, P. Ravassard, D. Salvert, C. Peyron, B. Claustrat, L. Léger, P. Salin, G. Malleret, P. Fort, P.-H. Luppi, The supramammillary nucleus and the claustrum activate the cortex during REM sleep. Sci. Adv. 1, e1400177 (2015).
14 of 14