Carrasquillo et al. Molecular Neurodegeneration 2011, 6:54 http://www.molecularneurodegeneration.com/content/6/1/54
RESEARCH ARTICLE
Open Access
Replication of EPHA1 and CD33 associations with late-onset Alzheimer’s disease: a multi-centre case-control study Minerva M Carrasquillo1†, Olivia Belbin1,2,12†, Talisha A Hunter1, Li Ma1, Gina D Bisceglio1, Fanggeng Zou1, Julia E Crook3, V Shane Pankratz4, Sigrid B Sando5,6, Jan O Aasly5,6, Maria Barcikowska7, Zbigniew K Wszolek8, Dennis W Dickson1, Neill R Graff-Radford1,8, Ronald C Petersen9,10, Peter Passmore11, Kevin Morgan2, for for the Alzheimer’s Research UK (ARUK) consortium and Steven G Younkin1*
Abstract Background: A recently published genome-wide association study (GWAS) of late-onset Alzheimer’s disease (LOAD) revealed genome-wide significant association of variants in or near MS4A4A, CD2AP, EPHA1 and CD33. Metaanalyses of this and a previously published GWAS revealed significant association at ABCA7 and MS4A, independent evidence for association of CD2AP, CD33 and EPHA1 and an opposing yet significant association of a variant near ARID5B. In this study, we genotyped five variants (in or near CD2AP, EPHA1, ARID5B, and CD33) in a large (2,634 LOAD, 4,201 controls), independent dataset comprising six case-control series from the USA and Europe. We performed meta-analyses of the association of these variants with LOAD and tested for association using logistic regression adjusted by age-at-diagnosis, gender, and APOE ε4 dosage. Results: We found no significant evidence of series heterogeneity. Associations with LOAD were successfully replicated for EPHA1 (rs11767557; OR = 0.87, p = 5 × 10⁻⁴) and CD33 (rs3865444; OR = 0.92, p = 0.049), with odds ratios comparable to those previously reported. Although the two ARID5B variants (rs2588969 and rs494288) showed significant association with LOAD in meta-analysis of our dataset (p = 0.046 and 0.008, respectively), the associations did not survive adjustment for covariates (p = 0.30 and 0.11, respectively). We had insufficient evidence in our data to support the association of the CD2AP variant (rs9349407, p = 0.56). Conclusions: Our data overwhelmingly support the association of EPHA1 and CD33 variants with LOAD risk: addition of our data to the results previously reported (total n > 42,000) increased the strength of evidence for these variants, providing impressive p-values of 2.1 × 10⁻¹⁵ (EPHA1) and 1.8 × 10⁻¹³ (CD33).
Background Following the identification of the APOE ε4 allele as a risk factor for late-onset Alzheimer’s disease (LOAD) in 1993 [1], consistent replication of subsequently identified candidates was not achieved until 2009, when two genome-wide association studies (GWAS) [2,3] identified associations of variants in or near CLU, PICALM , and CR1 with LOAD, which were consistently replicated in multiple large, independent case-control studies * Correspondence:
[email protected] † Contributed equally 1 Department of Neuroscience, Mayo Clinic College of Medicine, Jacksonville, FL 32224, USA Full list of author information is available at the end of the article
[4-17]. Subsequently, a variant near BIN1 was reported [4] to achieve genome-wide significant association in a later GWAS published in 2010 that also replicated well in follow-up studies [14-19]. These results demonstrate the utility of the hypothesis-free GWAS approach for identifying loci that associate with LOAD and the necessity of pooling samples and data from multiple centers to obtain resources with sufficient statistical power (GWAS typically > 14,000, follow-up typically total > 28,000) to detect the modest ORs (e.g. 0.8/1.2) associated with these variants in GWAS and follow-up studies.
© 2011 Carrasquillo et al; licensee BioMed Central Ltd. This is an Open Access article distributed under the terms of the Creative Commons Attribution License (http://creativecommons.org/licenses/by/2.0), which permits unrestricted use, distribution, and reproduction in any medium, provided the original work is properly cited.
Carrasquillo et al. Molecular Neurodegeneration 2011, 6:54 http://www.molecularneurodegeneration.com/content/6/1/54
Page 2 of 9
Two recently published companion studies by Hollingworth et al. [20] and Naj et al. [17] performed metaanalysis of two large GWAS datasets (n > 75,000). Besides APOE, CLU, PICALM, and CR1, the meta-analyses revealed association at ABCA7 (p = 5 × 10 -21 ), MS4A6A (p = 1.2 × 10⁻¹⁶), MS4A4E (p = 1.1 × 10⁻¹⁰), EPHA1 (p = 6 × 10 -10 ), CD2AP (p = 8.6 × 10 -9 ) and CD33 (p = 1.6 × 10 -9 ). In addition, the two datasets revealed opposing association (Naj et al. OR = 0.93, p = 0.001; Hollingworth et al. OR = 1.06, p = 0.03) of the variant near ARID5B (rs2588969) with LOAD, suggesting potential heterogeneity at this locus. In this study, we genotyped the variants identified at the CD2AP, EPHA1, and CD33 loci in our independent case-control dataset comprising six case-control series (n = 6,835). To assess the opposing associations at the ARID5B locus, we also genotyped the two ARID5B variants included in the Hollingworth et al. study. Genotypes from our follow-up case-control series (Mayo 2) for variants in ABCA7, MS4A6A and MA4A4E were included in Stage 3 of the Hollingworth et al. study, so we have not included these three variants in this study. We have performed meta-analyses of five variants (at CD2AP, EPHA1, ARID5B and CD33 loci) in our six case-control series, which showed no significant series heterogeneity. Furthermore, we have performed logistic regression analysis of our pooled series adjusting for covariates. Finally, we have used a Fisher’s combined test to evaluate the significance of the association of these five variants in our data combined with the data in the Hollingworth et al. and Naj et al. studies.
Results We genotyped five variants (CD2AP; rs9349407, EPHA1; rs11767557, ARID5B; rs2588969 and rs4948288, CD33; rs3865444) in our independent follow-up case-control series (Mayo2) from three North American and three European Caucasian series. Detailed information about these samples is shown in Table 1 and genotype counts
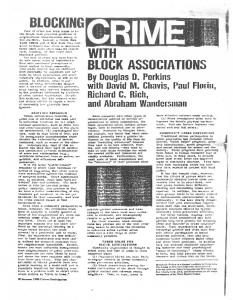
are shown in Table 2. Samples used in this study do not overlap with those included in the Naj et al. study and have not been included in any of the published LOAD GWAS. The Mayo2 dataset included in the Hollingworth et al. publication only included genotypes for ABCA7, MS4A6A and MA4A4E. Meta-analyses of allelic association in the six Mayo2 series performed using a DerSimonian-Laird random effects model (Figure 1) revealed a significant pooled OR for the EPHA1 variant (Figure 1b; OR = 0.88, p = 0.008) comparable to that previously published by Naj et al. (OR = 0.87) and by Hollingworth et al. (OR = 0.90). As shown in Figure 1c and 1d, we also observed significant association for both ARID5B variants (rs2588969, OR = 1.08, p = 0.046; rs4948288, OR = 1.11, p = 0.008) with ORs comparable to those reported by Hollingworth et al. (OR = 1.06 and 1.07, respectively) and in the opposing direction to those reported by Naj et al. for rs2588969 (Stage 1+2 OR = 0.93, p = 7.7 × 10 -4 ). As shown in Figure 1a and 1e, we did not observe significant association for CD2AP (OR = 0.98, p = 0.76) or CD33 (OR = 0.96, p = 0.32) in our meta-analyses. Breslow-Day tests provided no significant evidence that the ORs for any of these variants were heterogeneous among our series (all p > 0.25), as shown in Figure 1. The variant with the most heterogeneity was CD2AP (rs9349407) where the estimated percentage of variation due to heterogeneity across studies (I2) was 25.1% (95% CI 0%-70%) suggesting the presence of some heterogeneity for that variant. To adjust for important covariates, we included ageat-diagnosis/entry, sex and APOE ε 4 dosage in logistic regression analyses of all five variants in each of the six Mayo2 series; in our analysis of all Mayo2 series combined, series was included as an additional covariate. Table 3 shows the results for the six Mayo2 series combined (Mayo follow-up) as well as for each of the six individual Mayo2 series. For the purpose of comparison, we have also included in Table 3 the published GWAS
Table 1 Details of the Mayo2 samples used in this study and genotype counts Number of samples
Mean Age (SD)
% ε4+
% Female
Series
AD
CON
Total
AD
CON
AD
CON
AD
CON
Jacksonville
507
967
1,474
80.0 (6.7)
81.7 (7.6)
61.9
56.3
60.2
21.8
Rochester
317
1,638
1,955
85.8 (4.5)
80.3 (5.2)
62.1
54.6
42.3
22.4
Autopsy
312
102
414
87.4 (4.8)
86.0 (4.3)
67.6
52.0
61.2
14.7
Norway
346
555
901
80.2 (7.3)
75.3 (6.8)
69.9
59.8
63.0
24.1
Poland
483
188
671
76.7 (4.8)
73.0 (5.9)
66.3
76.6
56.4
19.0
ARUK
669
751
1,420
75.6 (8.2)
76.2 (7.3)
55.6
49.9
58.0
24.4
The number of LOAD patients (AD) and controls (CON), mean age-at-diagnosis, percentage that are female and percentage that possess at least one copy of the APOE ε 4 allele are given for each individual series. Mean age is given as age at diagnosis/entry with the standard deviation (SD) from the mean in parentheses. None of the samples comprising the Jacksonville, Rochester and autopsy-confirmed Mayo Clinic or ARUK series (comprising Bristol, Leeds, Manchester, Nottingham, Oxford and Southampton), which were included in this follow-up study overlap with those used in the Naj et al. study and have not been included in any of the published LOAD GWAS. The Mayo2 dataset included in the Hollingworth et al. publication only included genotypes for ABCA7, MS4A6A and MA4A4E.
Carrasquillo et al. Molecular Neurodegeneration 2011, 6:54 http://www.molecularneurodegeneration.com/content/6/1/54
Page 3 of 9
Table 2 Genotype counts for each of the six Mayo2 series CD2AP (rs9349407)
EPHA1 (rs11767557)
ARID5B (rs2588969)
TT/TC/CC AD
TT/TC/CC CON
CC/CA/AA AD
CC/CA/AA AD
CC/CA/AA CON
Jacksonville 254/197/41
497/369/56
339/143/ 19
612/301/44
188/226/81 379/400/149 164/233/99 351/426/148 251/200/41
446/386/88
170/126/17 843/640/117 198/102/9
985/518/69
Rochester
GG/GA/AA AD
GG/GA/AA CON
CD33 (rs3865444)
GG/GC/CC CON
Series
CC/CA/AA CON
ARID5B (rs4948288)
GG/GC/CC AD
100/159/48 623/755/226
92/172/50
Autopsy
156/110/19
49/44/7
205/97/5
61/28/10
118/148/42
50/38/14
115/142/43
581/748/250 148/134/30 715/692/170 38/43/17
141/125/32
42/44/11
Norway
177/131/16
273/205/41
212/113/ 13
337/185/26
129/165/44
215/250/78
115/156/53
184/268/88
153/139/35
248/236/57
Poland
235/193/40
100/70/11
297/140/ 20
108/52/9
153/243/77
65/91/29
160/222/84
62/96/26
224/204/39
96/83/8
ARUK
341/243/55
363/317/53
386/191/ 20
439/234/37
236/313/ 101
271/367/102
208/326/ 122
259/351/122 289/286/67
329/307/94
Total
1333/1000/ 188
2125/1645/ 285
1637/786/ 86
2542/1318/ 195
924/1254/ 393
1603/1901/ 598
854/1251/ 451
1475/1932/ 651
1876/1748/ 428
1206/1088/ 244
The genotype counts (major allele homozygotes/heterozygotes/minor allele homozygotes) for CD2AP (rs9349407), EPHA1 (rs11767557), ARID5B (rs2588969 and rs4948288) and CD33 (rs3865444) variants are given for each individual series.
results for the same variants. Adjustment for covariates revealed comparable ORs to those obtained in the metaanalyses, with improved p-values for the EPHA1 (OR = 0.87, p = 5 × 10⁻⁴ ), CD33 (OR = 0.92, p = 0.049) and CD2AP (OR = 0.97, p = 0.56) loci. However, the associations of the ARID5B variants were no longer significant following adjustment for covariates (rs2588969: OR = 1.05, p = 0.30, rs4948288: OR = 1.07, p = 0.11) suggesting that these associations may be dependent upon the series, age-at-diagnosis/entry, sex and/or APOE ε 4 dosage of the individual. In order to estimate the overall association of these five variants in our data combined with the previously published associations, we used Fisher’s method to combine the p-values for all associations (Table 3; Mayo2/ ADGC/Hollingworth). We found that adding our data to those previously reported, increased the strength of evidence for all variants as LOAD risk modifiers (CD2AP: p = 6.5 × 10 -11 , EPHA1: p = 2.1 × 10 -15 , ARID5B rs2588969: p = 2.3 × 10⁻⁹, ARID5B rs4948288: p = 4.0 × 10⁻⁴, CD33: p = 1.8 × 10⁻¹³).
Discussion We report here successful replication of the association of two variants with LOAD in a large (n = 6,835), independent case-control study; rs11767557, which is located 3 kb upstream of EPHA1 (p = 5 × 10 -4 ) and rs3865444, which is located 373 bp upstream of CD33 (p = 0.049). The ORs we observed in our meta-analyses (EPHA1 = 0.88, CD33 = 0.96) were comparable to those reported by both Naj et al. (EPHA1 = 0.87, CD33 = 0.89) and by Hollingworth et al. (EPHA1 = 0.90, CD33 = 0.89) such that the estimated p-values for association of these variants in all data (n > 42,000) were an impressive 2.1 × 10 -15 for EPHA1 and 1.8 × 10⁻¹³ for CD33.
Although our meta-analyses showed successful replication of the association of the ARID5B variants rs2588969 (OR = 1.08, p = 0.046) and rs4948288 (OR = 1.11, p = 0.008) with a direction of association consistent with that reported by Hollingworth et al. (OR = 1.06 and 1.07, respectively), the associations did not survive adjustment for age-at-diagnosis/entry, sex and APOE ε 4 status (p = 0.30 and 0.11, respectively). This covariate-dependent association could explain the opposing association reported by Naj et al. in their discovery (OR = 0.88) and replication (OR = 1.05) datasets for rs2588969; the only ARID5B variant they tested. Therefore, while estimation of the p-values for association of the ARID5B variants in all datasets combined were highly significant (rs2588969; p = 2.3 × 10⁻⁹ and rs4948288; p = 4.0 × 10⁻⁴), interpretation of these associations should be treated with caution and should take into account the age-at-diagnosis/entry, sex and APOE ε 4 dosage of the populations. Finally, although the estimated p-value for association of rs9349407 (located in intron 1of CD2AP) in all datasets was 6.5 × 10⁻¹¹, there was no evidence for association of this variant in our dataset alone (OR = 0.97, p = 0.56). Our Mayo2 collection of case-control series studies provided a total of 2,634 LOAD and 4,201 controls. Combining across studies to perform global tests of significance for additive genotypic trend tests gave us 80% power to detect ORs ranging from 1.17 (or 0.855) for variants with a minor allele frequency (MAF) of 0.2 to 1.13 (or 0.883) for variants with a MAF of 0.45 in controls. The study provided approximately 60% power to detect the OR of 1.11 that we report for CD2AP (MAF = 0.27). Case-control studies such as this are not designed to ascertain whether the variants with reported association with LOAD risk are the functional variant but
Carrasquillo et al. Molecular Neurodegeneration 2011, 6:54 http://www.molecularneurodegeneration.com/content/6/1/54
Page 4 of 9
they can identify a linkage disequilibrium (LD) block within which a truly functional variant may reside. Our results indicate that the EPHA1 and CD33 variants represent excellent candidates for targeted deep sequencing or high density genotyping in order to define the locus further, followed by subsequent functional studies of nearby genes to elucidate the mechanism behind these associations. With the exception of rs9349407, which lies within intron 1of CD2AP, all of these variants lie within intergenic regions but for ease of the reader, we have thus far only referred to the nearest gene for each variant. This by no means signifies that these variants (or the functional variants in LD with them) are assumed to affect the expression or function of the nearest gene but may affect other nearby genes. Until it is known which gene underlies these associations, all nearby genes should be included in follow-up functional investigation (all genes that reside within 100 kb of these variants are listed in Additional file 1, Table S1).
Conclusions Taken along with our previous publications [5,18,20,21], we have now performed follow-up association studies of 25 of the top GWAS-identified candidate LOAD genes and successfully replicated the association of eleven variants (in or near ABCA7, BIN1, CD33, CLU, CR1, EPHA1, GAB2, LOC651924, MS4A6A/4E and PICALM), eight of which are currently ranked in the top ten (after APOE) on AlzGene. This recent success in replicating genetic association highlights the utility of multiple, large case-control follow-up studies to confirm the novel associations reported by large GWAS, thus confirming them as good candidate genes for functional follow-up studies. Methods Ethics statement
Approval was obtained from the ethics committee or institutional review board of each institution responsible for the ascertainment and collection of samples. Written informed consent was obtained for all individuals that participated in this study. Case-control subjects Figure 1 Forest plots for meta-analysis of CD2AP, EPHA1, ARID5B, and CD33 variants in our six Mayo2 case-control series. ORs (boxes) and 95% CI (whiskers) are plotted for each population and shown on the right of each plot. Combined OR is the overall OR calculated by the meta-analysis using a random effects model. P-values are provided for the combined ORs and Breslow-Day tests of heterogeneity. I2 gives an estimate of between studies variance.
The Mayo2 case-control series consisted of Caucasian subjects from the United States ascertained at the Mayo Clinic Jacksonville, Mayo Clinic Rochester, or through the Mayo Clinic Brain Bank. Additional Caucasian subjects from Europe were obtained from Norway [22], Poland [23], and from six research institutes in the United Kingdom that are part of the Alzheimer’s Research UK (ARUK) Network. Although the ARUK samples used in this follow-up do not overlap with
Carrasquillo et al. Molecular Neurodegeneration 2011, 6:54 http://www.molecularneurodegeneration.com/content/6/1/54
Page 5 of 9
Table 3 Association of CD2AP, EPHA1, ARID5B, and CD33 variants with LOAD in the initial studies (ADGC and GERAD+) and Mayo2 follow-up series Na Study
Cases
MAFb Controls
Cases
Association test
Controls
OR (95% CI)
p-value
CD2AP-rs9349407-C (minor) allele ADGC Discovery (Stage 1) ADGC Replication (Stage 2)
8,309 3,531
7,366 3,565
1.14 (1.08-1.21) 1.07 (0.98-1.17)
1.2 × 10⁻⁶ 0.12
ADGC combined analysis (Stages 1+2)
11,840
10,931
1.12 (1.07-1.18)
1.0 × 10⁻⁶
Hollingworth et al. (GERAD + Consortia)
6,283
7,165
1.11 (1.04-1.18)
8 × 10⁻⁴ 0.56
c
Mayo2
2,521
4,055
0.27
0.27
0.97 (0.89-1.07)
Jacksonville
492
922
0.28
0.26
1.10 (0.91-1.33)
0.34
Rochester
313
1,600
0.26
0.27
0.88 (0.70-1.09)
0.24
Autopsy
285
100
0.26
0.29
0.98 (0.65-1.47)
0.92
Norway Poland
324 468
519 181
0.25 0.29
0.28 0.25
0.81 (0.62-1.06) 1.04 (0.77-1.42)
0.13 0.79
ARUK
639 18,123
733 18,096
0.28
0.29
0.97 (0.81-1.16)
0.72 1.2 × 10⁻¹⁰
20,644
22,151
ADGC/Hollingworthd Mayo2/ADGC/Hollingworthe
6.5 × 10⁻¹¹
EPHA1-rs11767557-C (minor) allele ADGC Discovery (Stage 1)
8,309
7,366
0.85 (0.80-0.90)
7.3 × 10⁻⁸
ADGC Replication (Stage 2) ADGC combined analysis (Stages 1+2)
3,531 11,840
3,565 10,931
0.94 (0.86-1.03) 0.87 (0.83-0.92)
0.17 2.4 × 10⁻⁷
Hollingworth et al (GERAD + Consortia)
6,283
12,935
0.90 (0.85-0.95)
3.4 × 10⁻⁴
Mayo2
2,509
4,055
0.87 (0.78-0.96)
5.5 × 10⁻⁴
Jacksonville
501
957
0.18
0.20
0.86 (0.70-1.06)
0.17
Rochester
309
1,572
0.19
0.21
0.89 (0.69-1.13)
0.33
Autopsy
307
99
0.17
0.24
0.66 (0.43-1.02)
0.06
Norway
338
548
0.21
0.22
0.94 (0.71-1.24)
0.67
Poland ARUK
457 597
169 710
0.20 0.19
0.21 0.22
0.93 (0.66-1.31) 0.85 (0.69-1.04)
0.67 0.12
ADGC/Hollingworthd Mayo2/ADGC/Hollingworthe
18,123
18,096
4.2 × 10⁻¹²
20,632
27,921
2.1 × 10⁻¹⁵
ADGC Discovery (Stage 1)
8,309
c
0.19
0.21
ARID5B-rs2588969-A (minor) allele 7,366
0.88 (0.84-0.93)
1.1 × 10⁻⁶
ADGC Replication (Stage 2)
3,531
3,565
1.05 (0.97-1.13)
0.23
ADGC combined analysis (Stages 1+2)
11,840
10,931
0.93 (0.89-0.97)
0.001
Hollingworth et al (GERAD + Consortia) Mayo2c
6,283 2,571
7,165 4,102
1.06 (1.01-1.13) 1.05 (0.96-1.14)
0.03 0.30
Jacksonville
495
928
0.39
0.38
1.04 (0.88-1.23)
0.63
Rochester
307
1,604
0.42
0.38
1.12 (0.92-1.37)
0.26
Autopsy
308
102
0.38
0.32
1.24 (0.86-1.79)
0.24
Norway
338
543
0.37
0.37
1.05 (0.83-1.33)
0.69
Poland
473
185
0.42
0.40
0.91 (0.68-1.20)
0.49
ARUK
650
740
0.40
0.39
1.05 (0.88-1.24)
ADGC/Hollingworthd Mayo2/ADGC/Hollingworthe
18,123 20,694
18,096 22,198
0.40
0.38
0.61 7.6 × 10⁻⁹ 2.3 × 10⁻⁹
ARID5B-rs4948288-A (minor) allele ADGC Discovery (Stage 1)
8,309
ADGC Replication (Stage 2)
3,531
3,565
ADGC combined analysis (Stages 1+2)
11,840
10,931
Hollingworth et al (GERAD + Consortia)
6,992
13,472
2,556 496
4,058 925
c
Mayo2 Jacksonville
7,366
0.42 0.43
0.40 0.39
1.07 (1.03-1.15)
3.6 × 10⁻³
1.07 (0.99-1.16) 1.13 (0.96-1.34)
0.11 0.14
Carrasquillo et al. Molecular Neurodegeneration 2011, 6:54 http://www.molecularneurodegeneration.com/content/6/1/54
Page 6 of 9
Table 3 Association of CD2AP, EPHA1, ARID5B, and CD33 variants with LOAD in the initial studies (ADGC and GERAD+) and Mayo2 follow-up series (Continued) Rochester
314
1,579
0.43
0.40
1.08 (0.89-1.32)
0.43
Autopsy
300
98
0.38
0.39
0.91 (0.63-1.32)
0.61
Norway
324
540
0.40
0.41
1.06 (0.83-1.34)
0.64
Poland
466
184
0.42
0.40
0.90 (0.68-1.20)
0.48
ARUK
656
732
0.43
0.41
1.13 (0.96-1.33)
Mayo2/ADGC/Hollingworthe
9,548
17,530
0.14 4.0 × 10⁻⁴
CD33 -rs3865444-A (minor) allele ADGC Discovery (Stage 1)
8,309
7,366
0.88 (0.84-0.93)
8.2 × 10⁻⁷
ADGC Replication (Stage 2)
3,531
3,565
0.91 (0.85-0.99)
0.02
ADGC combined analysis (Stages 1+2)
11,840
10,931
0.89 (0.86-0.93)
1.1 × 10⁻⁷
Hollingworth et al (GERAD + Consortia)
6,283
7,165
0.89 (0.84-0.95)
2.2 × 10⁻⁴
2538
4052
0.92 (0.84-1.00)
4.9 × 10⁻²
c
Mayo2
0.31
0.32
Jacksonville
492
920
0.29
0.31
0.82 (0.68-0.98)
0.03
Rochester Autopsy
312 298
1,577 97
0.31 0.32
0.33 0.34
0.88 (0.72-1.08) 0.84 (0.57-1.24)
0.23 0.39
Norway
327
541
0.32
0.32
0.89 (0.70-1.14)
0.37
Poland
467
187
0.30
0.26
1.00 (0.72-1.37)
0.99
ARUK
642
730
0.33
0.34
0.98 (0.83-1.17)
ADGC/Hollingworthd Mayo2/ADGC/Hollingworthe
18,123
18,096
3.6 × 10⁻¹²
20,661
22,148
1.8 × 10⁻¹³
0.85
Abbreviations: MAF, minor allele frequency; OR, odds ratio for the minor allele; 95% CI, 95% confidence interval a The numbers shown for the series in the Naj et al. and Hollingworth et al. studies refer to the complete set analyzed. The numbers for the Mayo follow-up data refer to the number of samples successfully genotyped. b MAFs were not reported for LOAD and control groups in the Naj et al. or Hollingworth et al. studies. c The results shown here for the Mayo2 follow-up dataset combined and for the subseries were obtained using logistic regression adjusted for age, sex and APOE ε 4 dosage. The Mayo2 follow-up dataset reported here is independent of that which was incorporated in the GWAS reported by Hollingworth et al. The results for each of the Mayo follow-up subseries (Jacksonville, Rochester, Autopsy-confirmed, Norway, Poland and ARUK) are listed immediately below the results for the Mayo2 follow-up dataset combined. d Indicates Fisher’s combined p-value for each individual GWAS in the Naj et al. study (Combined) and the Hollingworth et al. study. e Indicates Fisher’s combined p-value for each individual GWAS in the Naj et al. study (Combined), the Hollingworth et al. study and Mayo2 independent followup series.
those employed in the original GWAS publication by Hollingworth et al., the same subject/sample ascertainment methodology was followed. The ARUK series included here are from Bristol, Leeds, Manchester, Nottingham, Oxford and Southampton. Since the Manchester cohort only consisted of LOAD cases, the Manchester cases were combined with subjects in the Nottingham series. Genotyping
All genotyping was performed at the Mayo Clinic in Jacksonville using TaqMan® SNP Genotyping Assays in an ABI PRISM® 7900HT Sequence Detection System with 384-Well Block Module from Applied Biosystems, California, USA. The genotype data was analyzed using the SDS software version 2.2.3 (Applied Biosystems, California, USA). Statistical Analyses
Meta-analysis of allelic association and Breslow-Day tests were performed using StatsDirect v2.5.8 software.
Meta-analyses were performed using the results from each individual case-control series. Summary ORs and 95% CI were calculated using the DerSimonian and Laird (1986) random-effects model [24]. Breslow-Day tests were used to test for heterogeneity between populations. PLINK software [25] (http://pngu.mgh. harvard.edu/purcell/plink/) was used to perform logistic regression analysis under an additive model adjusting for age-at-diagnosis, sex and APOE ε 4 dose as covariates. In our analysis of all series combined, series was included as an additional covariate. Since genotype counts were not reported for series included in the Naj et al. or Hollingworth et al. studies, we employed a Fisher combined test to combine p-values across series. Power calculations, based on a Mantel-Haenszel chisquare test that pooled across six different study groups, were obtained to estimate the detectable odds ratios for an ordinal effect using a range of minor allele frequencies spanning those expected from the candidate variants.
Carrasquillo et al. Molecular Neurodegeneration 2011, 6:54 http://www.molecularneurodegeneration.com/content/6/1/54
Additional material Additional file 1: Table S1. Genes located within 100 kb of the five variants tested in this study. Chr, chromosome. Base pair positions (bp) are relative to the NCBI Human Genome build 36.1. The position of the variant relative to the gene is given as 5’ (upstream from the gene’s transcription start site) or 3’ (downstream from the gene’s last exon). Distance indicates the number of base pairs from the variant position to the gene’s nearest exon.
Abbreviations ABCA7: ATP-binding cassette, sub-family A (ABC1), member 7; AD: Alzheimer’s disease; ADGC: Alzheimer’s disease Genetic Consortium; APOE: apolipoprotein E; ARID5B: AT rich interactive domain 5B (MRF1-like); ARUK: Alzheimer’s Research United Kingdom; BIN1: bridging integrator 1; Bp: base pair; CD2AP: CD2-associated protein; CD33: CD33 molecule; CI: confidence interval; CLU: clusterin; CR1: complement component (3 b/4 b) receptor 1 (Knops blood group); EPHA1: EPH receptor A1; GAB2: GRB2-associated binding protein 2; GERAD: Genetic and Environmental Risk in Alzheimer’s Disease Consortium; GWAS: genome-wide association study; kb: kilobases; LD: linkage disequibrium; LOAD: late-onset Alzheimer’s disease; MAF: minor allele frequency; MS4A4A: membrane-spanning 4-domains, subfamily A, member 4; OR: odds ratio; PICALM: phosphatidylinositol binding clathrin assembly protein; SD: standard deviation. Acknowledgements and Funding We thank contributors, including the Alzheimer’s disease centers who collected samples used in this study, as well as subjects and their families, whose help and participation made this work possible. We thank the members of the Alzheimer’s Research UK (ARUK) consortium who contributed samples to the ARUK resource. This work was supported by grants from the US National Institutes of Health, NIA R01 AG18023 (NRG-R, SGY); Mayo Alzheimer’s Disease Research Center, P50 AG16574 (RCP, DWD, NRG-R, SGY); Mayo Alzheimer’s Disease Patient Registry, U01 AG06576 (RCP); and US National Institute on Aging, AG25711, AG17216, AG03949 (DWD). Samples from the National Cell Repository for Alzheimer’s Disease (NCRAD), which receives government support under a cooperative agreement grant (U24AG21886) awarded by the National Institute on Aging (NIA), were used in this study. This project was also generously supported by the Robert and Clarice Smith Postdoctoral Fellowship (MMC); Robert and Clarice Smith and Abigail Van Buren Alzheimer’s Disease Research Program (RCP, DWD, NRG-R, SGY) and by the Palumbo Professorship in Alzheimer’s Disease Research (SGY). KM is funded by the Alzheimer’s Research UK and the Big Lottery Fund. ZKW is partially supported by the NIH/NINDS 1RC2NS070276, NS057567, P50NS072187, Mayo Clinic Florida (MCF) Research Committee CR programs (MCF #90052018 and MCF #90052030), Dystonia Medical Research Foundation, and the gift from Carl Edward Bolch, Jr., and Susan Bass Bolch (MCF #90052031/PAU #90052). The funders had no role in study design, data collection and analysis, decision to publish, or preparation of the manuscript. The Alzheimer’s Research UK Consortium: Peter Passmore, David Craig, Janet Johnston, Bernadette McGuinness, Stephen Todd, Queen’s University Belfast, UK; Reinhard Heun (now at Royal Derby Hospital), Heike Kölsch, University of Bonn, Germany; Patrick G. Kehoe, University of Bristol, UK; Nigel M. Hooper, Emma R.L.C. Vardy (now at University of Newcastle), University of Leeds, UK; David M. Mann, University of Manchester, UK; Kristelle Brown, Noor Kalsheker, Kevin Morgan, University of Nottingham, UK; A. David Smith, Gordon Wilcock, Donald Warden, University of Oxford (OPTIMA), UK, Clive Holmes, University of Southampton, UK. Author details Department of Neuroscience, Mayo Clinic College of Medicine, Jacksonville, FL 32224, USA. 2School of Molecular Medical Sciences, Institute of Genetics, Queens’s Medical Centre, University of Nottingham, NG7 2UH, UK. 3 Biostatistics Unit, Mayo Clinic College of Medicine, Jacksonville, FL 32224, USA. 4Division of Biomedical Statistics and Informatics, Mayo Clinic College of Medicine, Rochester, MN 55905, USA. 5Department of Neurology, St. Olav’s Hospital, Edvard Griegs Gate 8, 7006 Trondheim, Norway. 6Department of Neuroscience, Norwegian University of Science and Technology, NTNU, 1
Page 7 of 9
7491 Trondheim, Norway. 7Department of Neurodegenerative Disorders, Medical Research Centre, Polish Academy of Sciences, Warsaw, Poland. 8 Department of Neurology, Mayo Clinic College of Medicine, Jacksonville, FL 32224, USA. 9Department of Neurology, Mayo Clinic College of Medicine, Rochester, MN 55905, USA. 10Mayo Alzheimer Disease Research Center, Mayo Clinic College of Medicine, Rochester, MN 55905, USA. 11Centre for Public Health, School of Medicine, Dentistry and Biomedical Sciences, Queen’s University Belfast, Northern Ireland, BT7 1NN, UK. 12OB is now affiliated to Hospital de la Santa Creu i Sant Pau, 08025, Barcelona, Spain. Authors’ contributions Study concept and design: MMC and SGY. Sample Collection and Diagnosis: ARUK, DWD, JOA, MB, NRG-R, RCP, SBS, and ZKW. Genotyping: MMC and TAH. DNA Sample Preparation: GDB, ML and ZFG. Analysis and interpretation of data: JEC, KM, MMC, OB, SGY and VSP. Drafting of the manuscript: MMC and OB. Critical revision of the manuscript for important intellectual content: KM, MMC, OB, SGY and VSP. Study supervision: KM, MMC and SGY. All authors have read and approve the final manuscript. Competing interests The authors declare that they have no competing interests. Received: 26 May 2011 Accepted: 28 July 2011 Published: 28 July 2011 References 1. Saunders AM, Strittmatter WJ, Schmechel D, George-Hyslop PH, PericakVance MA, Joo SH, Rosi BL, Gusella JF, Crapper-MacLachlan DR, Alberts MJ, Hulette C, Crain B, Goldgaber D, Roses AD: Association of apolipoprotein E allele epsilon 4 with late-onset familial and sporadic Alzheimer’s disease. Neurology 1993, 43:1467-1472. 2. Harold D, Abraham R, Hollingworth P, Sims R, Gerrish A, Hamshere ML, Pahwa JS, Moskvina V, Dowzell K, Williams A, Jones N, Thomas C, Stretton A, Morgan AR, Lovestone S, Powell J, Proitsi P, Lupton MK, Brayne C, Rubinsztein DC, Gill M, Lawlor B, Lynch A, Morgan K, Brown KS, Passmore PA, Craig D, McGuinness B, Todd S, Holmes C, Mann D, Smith AD, Love S, Kehoe PG, Hardy J, Mead S, Fox N, Rossor M, Collinge J, Maier W, Jessen F, Schürmann B, van den Bussche H, Heuser I, Kornhuber J, Wiltfang J, Dichgans M, Frölich L, Hampel H, Hüll M, Rujescu D, Goate AM, Kauwe JS, Cruchaga C, Nowotny P, Morris JC, Mayo K, Sleegers K, Bettens K, Engelborghs S, De Deyn PP, Van Broeckhoven C, Livingston G, Bass NJ, Gurling H, McQuillin A, Gwilliam R, Deloukas P, Al-Chalabi A, Shaw CE, Tsolaki M, Singleton AB, Guerreiro R, Mühleisen TW, Nöthen MM, Moebus S, Jöckel KH, Klopp N, Wichmann HE, Carrasquillo MM, Pankratz VS, Younkin SG, Holmans PA, O’Donovan M, Owen MJ, Williams J: Genomewide association study identifies variants at CLU and PICALM associated with Alzheimer’s disease. Nat Genet 2009, 41:1088-1093. 3. Lambert JC, Heath S, Even G, Campion D, Sleegers K, Hiltunen M, Combarros O, Zelenika D, Bullido MJ, Tavernier B, Letenneur L, Bettens K, Berr C, Pasquier F, Fiévet N, Barberger-Gateau P, Engelborghs S, De Deyn P, Mateo I, Franck A, Helisalmi S, Porcellini E, Hanon O, European Alzheimer’s Disease Initiative Investigators, de Pancorbo MM, Lendon C, Dufouil C, Jaillard C, Leveillard T, Alvarez V, Bosco P, Mancuso M, Panza F, Nacmias B, Bossù P, Piccardi P, Annoni G, Seripa D, Galimberti D, Hannequin D, Licastro F, Soininen H, Ritchie K, Blanché H, Dartigues JF, Tzourio C, Gut I, Van Broeckhoven C, Alpérovitch A, Lathrop M, Amouyel P: Genome-wide association study identifies variants at CLU and CR1 associated with Alzheimer’s disease. Nat Genet 2009, 41:1094-1099. 4. Seshadri S, Fitzpatrick AL, Ikram MA, DeStefano AL, Gudnason V, Boada M, Bis JC, Smith AV, Carrasquillo MM, Lambert JC, Harold D, Schrijvers EM, Ramirez-Lorca R, Debette S, Longstreth WT Jr, Janssens AC, Pankratz VS, Dartigues JF, Hollingworth P, Aspelund T, Hernandez I, Beiser A, Kuller LH, Koudstaal PJ, Dickson DW, Tzourio C, Abraham R, Antunez C, Du Y, Rotter JI, Aulchenko YS, Harris TB, Petersen RC, Berr C, Owen MJ, Lopez-Arrieta J, Varadarajan BN, Becker JT, Rivadeneira F, Nalls MA, Graff-Radford NR, Campion D, Auerbach S, Rice K, Hofman A, Jonsson PV, Schmidt H, Lathrop M, Mosley TH, Au R, Psaty BM, Uitterlinden AG, Farrer LA, Lumley T, Ruiz A, Williams J, Amouyel P, Younkin SG, Wolf PA, Launer LJ, Lopez OL, van Duijn CM, Breteler MM, CHARGE Consortium, GERAD1 Consortium, EADI1 Consortium: Genome-wide analysis of genetic loci associated with Alzheimer disease. JAMA 2010, 303:1832-1840.
Carrasquillo et al. Molecular Neurodegeneration 2011, 6:54 http://www.molecularneurodegeneration.com/content/6/1/54
5.
6.
7.
8.
9.
10.
11.
12.
13.
14.
15.
16.
17.
Carrasquillo MM, Belbin O, Hunter TA, Ma L, Bisceglio GD, Zou F, Crook JE, Pankratz VS, Dickson DW, Graff-Radford NR, Petersen RC, Morgan K, Younkin SG: Replication of CLU, CR1, and PICALM associations with alzheimer disease. Arch Neurol 2010, 67:961-964. Zhang Q, Yu JT, Zhu QX, Zhang W, Wu ZC, Miao D, Tan L: Complement receptor 1 polymorphisms and risk of late-onset Alzheimer’s disease. Brain Res 2010, 1348:216-221. Corneveaux JJ, Myers AJ, Allen AN, Pruzin JJ, Ramirez M, Engel A, Nalls MA, Chen K, Lee W, Chewning K, Villa SE, Meechoovet HB, Gerber JD, Frost D, Benson HL, O’Reilly S, Chibnik LB, Shulman JM, Singleton AB, Craig DW, Van Keuren-Jensen KR, Dunckley T, Bennett DA, De Jager PL, Heward C, Hardy J, Reiman EM, Huentelman MJ: Association of CR1, CLU and PICALM with Alzheimer’s disease in a cohort of clinically characterized and neuropathologically verified individuals. Hum Mol Genet 2010, 19:3295-3301. Kamboh MI, Minster RL, Demirci FY, Ganguli M, Dekosky ST, Lopez OL, Barmada MM: Association of CLU and PICALM variants with Alzheimer’s disease. Neurobiol Aging , advance online publication: 4 Jun 2010. Yu JT, Li L, Zhu QX, Zhang Q, Zhang W, Wu ZC, Guan J, Tan L: Implication of CLU gene polymorphisms in Chinese patients with Alzheimer’s disease. Clin Chim Acta 2010, 411:1516-1519. Jun G, Naj AC, Beecham GW, Wang LS, Buros J, Gallins PJ, Buxbaum JD, Ertekin-Taner N, Fallin MD, Friedland R, Inzelberg R, Kramer P, Rogaeva E, St George-Hyslop P, Alzheimer’s Disease Genetics Consortium, Cantwell LB, Dombroski BA, Saykin AJ, Reiman EM, Bennett DA, Morris JC, Lunetta KL, Martin ER, Montine TJ, Goate AM, Blacker D, Tsuang DW, Beekly D, Cupples LA, Hakonarson H, Kukull W, Foroud TM, Haines J, Mayeux R, Farrer LA, Pericak-Vance MA, Schellenberg GD: Meta-analysis Confirms CR1, CLU, and PICALM as Alzheimer Disease Risk Loci and Reveals Interactions With APOE Genotypes. Arch Neurol 2010, 67:1473-1484. Yu JT, Song JH, Ma T, Zhang W, Yu NN, Xuan SY, Tan L: Genetic association of PICALM polymorphisms with Alzheimer’s disease in Han Chinese. J Neurol Sci 2011, 300:78-80. Schjeide BM, Schnack C, Lambert JC, Lill CM, Kirchheiner J, Tumani H, Otto M, Tanzi RE, Lehrach H, Amouyel P, von Arnim CA, Bertram L: The role of clusterin, complement receptor 1, and phosphatidylinositol binding clathrin assembly protein in Alzheimer disease risk and cerebrospinal fluid biomarker levels. Arch Gen Psychiatry 2011, 68:207-213. Brouwers N, Van Cauwenberghe C, Engelborghs S, Lambert JC, Bettens K, Le Bastard N, Pasquier F, Montoya AG, Peeters K, Mattheijssens M, Vandenberghe R, De Deyn PP, Cruts M, Amouyel P, Sleegers K, Van Broeckhoven C: Alzheimer risk associated with a copy number variation in the complement receptor 1 increasing C3b/C4b binding sites. Mol Psychiatry , advance online publication: 15 March 2011. Lee JH, Cheng R, Barral S, Reitz C, Medrano M, Lantigua R, JimenezVelazquez IZ, Rogaeva E, St George-Hyslop PH, Mayeux R: Identification of Novel Loci for Alzheimer Disease and Replication of CLU and BIN1 in Caribbean Hispanic Individuals. Arch Neurol 2011, 68:320-328. Lambert JC, Zelenika D, Hiltunen M, Chouraki V, Combarros O, Bullido MJ, Tognoni G, Fiévet N, Boland A, Arosio B, Coto E, Del Zompo M, Mateo I, Frank-Garcia A, Helisalmi S, Porcellini E, Pilotto A, Forti P, Ferri R, Delepine M, Scarpini E, Siciliano G, Solfrizzi V, Sorbi S, Spalletta G, Ravaglia G, Valdivieso F, Alvarez V, Bosco P, Mancuso M, Panza F, Nacmias B, Bossù P, Piccardi P, Annoni G, Seripa D, Galimberti D, Licastro F, Lathrop M, Soininen H, Amouyel P: Evidence of the association of BIN1 and PICALM with the AD risk in contrasting European populations. Neurobiol Aging 2011, , 32: 756.e11-756.e15. Wijsman EM, Pankratz ND, Choi Y, Rothstein JH, Faber KM, Cheng R, Lee JH, Bird TD, Bennett DA, Diaz-Arrastia R, Goate AM, Farlow M, Ghetti B, Sweet RA, Foroud TM, Mayeux R, NIA-LOAD/NCRAD Family Study Group: Genome-wide association of familial late-onset Alzheimer’s disease replicates BIN1 and CLU and nominates CUGBP2 in interaction with APOE. PLoS Genet 2011, 7:e1001308. Naj AC, Jun G, Beecham GW, Wang LS, Vardarajan BN, Buros J, Gallins PJ, Buxbaum JD, Jarvik GP, Crane PK, Larson EB, Bird TD, Boeve BF, GraffRadford NR, De Jager PL, Evans D, Schneider JA, Carrasquillo MM, ErtekinTaner N, Younkin SG, Cruchaga C, Kauwe JS, Nowotny P, Kramer P, Hardy J, Huentelman MJ, Myers AJ, Barmada MM, Demirci FY, Baldwin CT, Green RC, Rogaeva E, St George-Hyslop P, Arnold SE, Barber R, Beach T, Bigio EH, Bowen JD, Boxer A, Burke JR, Cairns NJ, Carlson CS, Carney RM, Carroll SL, Chui HC, Clark DG, Corneveaux J, Cotman CW, Cummings JL, DeCarli C,
Page 8 of 9
18.
19.
20.
21.
22.
23.
DeKosky ST, Diaz-Arrastia R, Dick M, Dickson DW, Ellis WG, Faber KM, Fallon KB, Farlow MR, Ferris S, Frosch MP, Galasko DR, Ganguli M, Gearing M, Geschwind DH, Ghetti B, Gilbert JR, Gilman S, Giordani B, Glass JD, Growdon JH, Hamilton RL, Harrell LE, Head E, Honig LS, Hulette CM, Hyman BT, Jicha GA, Jin LW, Johnson N, Karlawish J, Karydas A, Kaye JA, Kim R, Koo EH, Kowall NW, Lah JJ, Levey AI, Lieberman AP, Lopez OL, Mack WJ, Marson DC, Martiniuk F, Mash DC, Masliah E, McCormick WC, McCurry SM, McDavid AN, McKee AC, Mesulam M, Miller BL, Miller CA, Miller JW, Parisi JE, Perl DP, Peskind E, Petersen RC, Poon WW, Quinn JF, Rajbhandary RA, Raskind M, Reisberg B, Ringman JM, Roberson ED, Rosenberg RN, Sano M, Schneider LS, Seeley W, Shelanski ML, Slifer MA, Smith CD, Sonnen JA, Spina S, Stern RA, Tanzi RE, Trojanowski JQ, Troncoso JC, Van Deerlin VM, Vinters HV, Vonsattel JP, Weintraub S, WelshBohmer KA, Williamson J, Woltjer RL, Cantwell LB, Dombroski BA, Beekly D, Lunetta KL, Martin ER, Kamboh MI, Saykin AJ, Reiman EM, Bennett DA, Morris JC, Montine TJ, Goate AM, Blacker D, Tsuang DW, Hakonarson H, Kukull WA, Foroud TM, Haines JL, Mayeux R, Pericak-Vance MA, Farrer LA, Schellenberg GD: Common variants at MS4A4/MS4A6E, CD2AP, CD33 and EPHA1 are associated with late-onset Alzheimer’s disease. Nat Genet 2011, 43:436-441. Carrasquillo MM, Belbin O, Hunter TA, Ma L, Bisceglio GD, Zou F, Crook JE, Pankratz VS, Sando SB, Aasly JO, Barcikowska M, Wszolek ZK, Dickson DW, Graff-Radford NR, Petersen RC, Morgan K, Younkin SG: Replication of BIN1 Association with Alzheimer’s Disease and Evaluation of Genetic Interactions. J Alzheimers Dis , advance online publication: 14 Feb 2011. Hu X, Pickering E, Liu YC, Hall S, Fournier H, Katz E, Dechairo B, John S, Van Eerdewegh P, Soares H: Meta-analysis for genome-wide association study identifies multiple variants at the BIN1 locus associated with late-onset Alzheimer’s disease. PloS one 2011, 6:e16616. Hollingworth P, Harold D, Sims R, Gerrish A, Lambert JC, Carrasquillo MM, Abraham R, Hamshere ML, Pahwa JS, Moskvina V, Dowzell K, Jones N, Stretton A, Thomas C, Richards A, Ivanov D, Widdowson C, Chapman J, Lovestone S, Powell J, Proitsi P, Lupton MK, Brayne C, Rubinsztein DC, Gill M, Lawlor B, Lynch A, Brown KS, Passmore PA, Craig D, McGuinness B, Todd S, Holmes C, Mann D, Smith AD, Beaumont H, Warden D, Wilcock G, Love S, Kehoe PG, Hooper NM, Vardy ER, Hardy J, Mead S, Fox NC, Rossor M, Collinge J, Maier W, Jessen F, Rüther E, Schürmann B, Heun R, Kölsch H, van den Bussche H, Heuser I, Kornhuber J, Wiltfang J, Dichgans M, Frölich L, Hampel H, Gallacher J, Hüll M, Rujescu D, Giegling I, Goate AM, Kauwe JS, Cruchaga C, Nowotny P, Morris JC, Mayo K, Sleegers K, Bettens K, Engelborghs S, De Deyn PP, Van Broeckhoven C, Livingston G, Bass NJ, Gurling H, McQuillin A, Gwilliam R, Deloukas P, Al-Chalabi A, Shaw CE, Tsolaki M, Singleton AB, Guerreiro R, Mühleisen TW, Nöthen MM, Moebus S, Jöckel KH, Klopp N, Wichmann HE, Pankratz VS, Sando SB, Aasly JO, Barcikowska M, Wszolek ZK, Dickson DW, Graff-Radford NR, Petersen RC, Alzheimer’s Disease Neuroimaging Initiative, van Duijn CM, Breteler MM, Ikram MA, DeStefano AL, Fitzpatrick AL, Lopez O, Launer LJ, Seshadri S, CHARGE consortium, Berr C, Campion D, Epelbaum J, Dartigues JF, Tzourio C, Alpérovitch A, Lathrop M, EADI1 consortium, Feulner TM, Friedrich P, Riehle C, Krawczak M, Schreiber S, Mayhaus M, Nicolhaus S, Wagenpfeil S, Steinberg S, Stefansson H, Stefansson K, Snaedal J, Björnsson S, Jonsson PV, Chouraki V, Genier-Boley B, Hiltunen M, Soininen H, Combarros O, Zelenika D, Delepine M, Bullido MJ, Pasquier F, Mateo I, Frank-Garcia A, Porcellini E, Hanon O, Coto E, Alvarez V, Bosco P, Siciliano G, Mancuso M, Panza F, Solfrizzi V, Nacmias B, Sorbi S, Bossù P, Piccardi P, Arosio B, Annoni G, Seripa D, Pilotto A, Scarpini E, Galimberti D, Brice A, Hannequin D, Licastro F, Jones L, Holmans PA, Jonsson T, Riemenschneider M, Morgan K, Younkin SG, Owen MJ, O’Donovan M, Amouyel P, Williams J: Common variants at ABCA7, MS4A6A/MS4A4E, EPHA1, CD33 and CD2AP are associated with Alzheimer’s disease. Nat Genet 2011, 43:429-435. Belbin O, Carrasquillo MM, Crump M, Culley OJ, Hunter TA, Ma L, Bisceglio G, Zou F, Allen M, Dickson DW, Graff-Radford NR, Petersen RC, Morgan K, Younkin SG: Investigation of 15 of the top candidate genes for late-onset Alzheimer’s disease. Hum Genet 2011, 129:273-282. Sando SB, Melquist S, Cannon A, Hutton ML, Sletvold O, Saltvedt I, White LR, Lydersen S, Aasly JO: APOE epsilon 4 lowers age at onset and is a high risk factor for Alzheimer’s disease; a case control study from central Norway. BMC Neurol 2008, 8:9. Klimkowicz-Mrowiec A, Marona M, Wolkow P, Maruszak A, Styczynska M, Barcikowska M, Zekanowski C, Szczudlik A, Slowik A: Interleukin-1 gene
Carrasquillo et al. Molecular Neurodegeneration 2011, 6:54 http://www.molecularneurodegeneration.com/content/6/1/54
Page 9 of 9
-511 CT polymorphism and the risk of Alzheimer’s disease in a Polish population. Dement Geriatr Cogn Disord 2009, 28:461-464. 24. DerSimonian R, Laird N: Meta-analysis in clinical trials. Control Clin Trials 1986, 7:177-188. 25. Purcell S, Neale B, Todd-Brown K, Thomas L, Ferreira MA, Bender D, Maller J, Sklar P, de Bakker PI, Daly MJ, Sham PC: PLINK: a tool set for wholegenome association and population-based linkage analyses. Am J Hum Genet 2007, 81:559-575. doi:10.1186/1750-1326-6-54 Cite this article as: Carrasquillo et al.: Replication of EPHA1 and CD33 associations with late-onset Alzheimer’s disease: a multi-centre casecontrol study. Molecular Neurodegeneration 2011 6:54.
Submit your next manuscript to BioMed Central and take full advantage of: • Convenient online submission • Thorough peer review • No space constraints or color figure charges • Immediate publication on acceptance • Inclusion in PubMed, CAS, Scopus and Google Scholar • Research which is freely available for redistribution Submit your manuscript at www.biomedcentral.com/submit