Report on Market Performance and Market Monitoring in the Colombian Electricity Supply Industry by Frank A. Wolak Department of Economics Stanford University Stanford, CA 94305-6072
[email protected] July 30, 2009
Table of Contents 1. Introduction ......................................................................................................................... 1 2. Unilateral Market Power in Wholesale Electricity ......................................................... 5 2.1. The Ability and Incentive to Exercise Unilateral Market Power ................................... 6 2.2. Measuring the Ability to Exercise Unilateral Market Power......................................... 7 2.2.1. Constructing residual demand curve from aggregate demand and offer curves ....... 13 2.2.2. The inverse elasticity of the residual demand curve as a measure of a supplier’s ability to exercise unilateral market power ........................................................................... 13 2.2.3. Transmission constraints and the computation of the residual demand curve.......... 17 2.2.4. A simplified model of expected profit-maximizing offer behavior .......................... 19 2.3. Measuring the Incentive to Exercise Unilateral Market Power ..................................... 25 2.4. Pivotal and Net Pivotal Supplier Indexes of the Ability and Incentive to Exercise Unilateral Market Power ....................................................................................................... 33 2.5. Determinants of the Duration of the Exercise of Unilateral Market Power in Wholesale Electricity Markets ................................................................................................................ 34 3. System-wide Market Power Issues................................................................................... 41 3.1. Measuring the Extent of Market Power Exercised in the Wholesale Market ............... 42 3.2. The Market Efficiency Benefits and Costs of Offer Curve Flexibility ........................ 44 3.3. Information Release and the Exercise of Market Power ............................................. 48 3.3.1. The role of smart sunshine regulation in improving market efficiency .................... 48 3.3.2. Public release of data and market efficiency ............................................................ 49 3.3.3. Who should have what data and when they should have it ...................................... 51 3.3.4. Arguments against immediate public data release ...................................................... 53 3.3.4. Forced and planned outage collection and reporting ................................................ 54 3.3.5. Summary and concluding comments ........................................................................ 56 3.4. Using the Same Price Offer in Two Markets ............................................................... 57 3.4. Allowing Co-Generation Units to Participate in the Wholesale Market ..................... 58 4. Local Market Power Issues............................................................................................... 58 4.1. Origins of the Local Market Power Problem ............................................................... 59 4.2. Local Market Power Mitigation in Colombian Wholesale Market ............................. 60 4.2.1. Relationship between reconciliation payment mechanism and LMPM mechanism 62 4.2.2. Analysis of performance of Colombian reconciliation payment mechanism ........... 63 4.2.3. Analysis of reconciliation payment mechanism as a LMPM mechanism ................. 64 4.2.3. Concluding comments on local market power mitigation ........................................ 72 4.3. Incorporating Start-Up Cost Offers Into Short-Term Energy Market ......................... 73 4.3.1. Identifying source and magnitude of problem .......................................................... 73 4.3.2. Alternative solutions to start-up cost recovery ......................................................... 74 4.3.3. Recommended study to determine the appropriate course of action ........................ 76 4.3.4. Summary and conclusions on start-up cost recovery ................................................ 77 5. Market Monitoring Issues ................................................................................................ 77 5.1. Determining if Suppliers are Exercising Unilateral Market Power ............................... 78 5.2. Distinguishing Abuse of Market Power from the Exercise of Market Power ............... 78 5.3. Ensuring Compliance with Market Rules ..................................................................... 80 5.4. Persistent Behavior Detrimental to System Reliability and Market Efficiency .......... 81 5.4.1. Determining intent to harm system reliability or market efficiency ......................... 83
5.4.2. Suspension of market operations .............................................................................. 84 5.4.3. Prevention of consumer harm ................................................................................... 85 5.3. The Role of Independent Market Monitoring Committee ........................................... 85 6. Broader Electricity Industry Issues ................................................................................. 88 6.1. Natural Gas Pricing in Colombia ................................................................................... 88 6.2. Centralized Market for Standardized Forward Contracts for Energy .......................... 90 6.2.1. Missing forward markets in Colombian electricity supply industry ......................... 91 6.2.3. The role of multiple buyers in the forward market ................................................... 94 6.2.4. Counterparty risk management issues ...................................................................... 96 7. Major Recommendations and Directions for Future Research .................................... 97 References ............................................................................................................................. 100
Executive Summary The Superintendencia de Servicios Públicos (SSPD) has asked me to analyze and comment on a number of issues relating to the performance and monitoring of the Colombian Electricity Supply Industry. At the start of the project, meetings were held in Bogota with various associations of market participants, independent market monitors, regulatory bodies, and government agencies. A number of the concerns raised during these meetings were related to the rapid increase in wholesale electricity prices that began in late 2008 and continued into early 2009. An analysis of market outcomes since December of 2008 until the end of June 2009 revealed that the average Bolsa price more than doubled from early December 2008 to early January of 2009. The average price then declined until early May and has once again risen steadily since then. Several stakeholder groups argued that the Bolsa price increase in early 2009 was the result of the increased exercise of unilateral market power by electricity suppliers. Further analysis revealed that the behavior of natural gas prices played a role in determining this pattern of Bolsa prices, although the increased exercise unilateral market power could not be ruled out. Suggestions for more in-depth analyses of market outcomes that can shed more light on this issue are provided in the report. This report points out a number of aspects of the existing electricity market design in Colombia that could be contributing to the periods of high short-term prices observed several times since early December of 2008. These issues are classified into four broad categories: (1) system-wide market power issues, (2) local market power issues, (3) market monitoring issues, and (4) broader electricity market issues. There are four major issues relating to the increased ability and incentive of suppliers to exercise system-wide unilateral market power. The first is the extent to which the limited flexibility in the offer curves that suppliers submit to the wholesale market enhances their ability to exercise unilateral market power. The second is the extent to which the immediate release to the public of information on market participant behavior—offer curves, generation unit-level output levels, and scheduled and planned generation outages—enhances the ability of suppliers raise wholesale prices. The third issue is the impact on Bolsa prices of using the same offer price in the supply curve a generation unit owner submits to a uniform-price energy market (the Bolsa) and to a pay-as-bid auction for automatic generation control (AGC) services. A final systemwide market power issue is how to allow co-generation units owned by large industrial and commercial customers to participate in the short-term wholesale market. There are two issues related to local market power concerns. The first is concerned with the design of the positive and negative reconciliation mechanism. The report demonstrates that this mechanism can be thought of as a local market power mitigation mechanism. Assessing this mechanism from that perspective demonstrates that these payments can cause generation unit owners that know they are likely to be eligible to receive these payments to alter their offer behavior to increase the revenues they receive. The second local market power issue is whether suppliers should be able to submit start-up cost offers to the wholesale market operator in addition to their energy offer curve and receive explicit payments both for their start-up costs and
the energy they produce rather than have to recover their start-up and other fixed costs from energy sales as has been the case since the Colombian wholesale market began operation. A third set of issues deals with the wholesale electricity market monitoring process. The first question is how to determine whether suppliers are exercising unilateral market power and what to do about it. A second related question is how to distinguish the exercise unilateral market power from market manipulation or abuse of market power. A third question is the appropriate role for the Comité Sequimiento de Mercado Energia Mayorista (CSMEM) in the regulatory process for the Colombian wholesale electricity market. Specifically, how should it interact with the CREG, the SSPD and the MME and what rights and responsibilities should it have and why should it have them? A final set of issues deals with improving the overall efficiency of the electricity supply industry in Colombia. The first issue addresses the extent to which conditions in the natural gas supply industry in Colombia detract from the performance of the wholesale electricity market. The second issue considers the design of the MOR, the centralized market for standardized fixed-price forward contracts proposed by the CREG. A number of recommendations emerge from this analysis. The highest priority recommendations relate to public data release and the market monitoring function. The independent market monitoring committee must have immediate access to all data submitted to and produced by the market operator and submitted to and produced by the relevant regulatory authorities—the CREG and the SSPD. All data submitted to and produced by the market operator should also be released to the public as soon as possible after the market operated. The independent market monitoring committee should also have the ability to produce reports analyzing confidential data that been provided to the CREG and SSPD that can be made publicly available. Although it is important to protect confidential business information collected by the CREG and SSPD, there are many ways present summary statistics from this information in a manner that protects its confidentiality yet still provides valuable input to the public dialogue. A second important recommendation relating to the market monitoring process is how to best manage the exercise of unilateral market power. Rather that attempt to find and punish the abuse of market power, a less costly strategy that is likely to improve long-run market performance is to focus on preventing behavior harmful to system reliability and market efficiency. The report outlines procedures designed to limit the harm to other market participant experience as result of some suppliers exercising unilateral market power that is harmful to system reliability or market efficiency. In order to quantify the magnitude of economic harm caused by the exercise of unilateral market power, the report also outlines a procedure for computing competitive benchmark prices that can be used to assess the competitiveness of the short-term market. The second major set of recommendations relates to the positive and negative reconciliation payment mechanism. The effectiveness of these mechanisms should be reviewed from the perspective that they currently service as a local market power mitigation mechanism for the Colombian market. Viewed from this perspective, there is little economic rationale for paying for negative reconciliations. Guaranteeing start-up cost recovery in positive
reconciliation payments and not for sales in the short-term market provides incentives for suppliers that know they are needed to operate because of a local reliability constraint to submit price offers into the short-term market far in excess of their variable cost. Eliminating the guaranteed recovery of start-up costs for positive reconciliation payments would provide suppliers with the stronger incentives to submit price offers into the short-term market closer to their variable cost of production. Finally, designating some generation units as reliability mustrun units and guaranteeing full cost recovery in exchange for the system operator having the ability to use them to manage local transmission constraints can significantly reduce the magnitude of reconciliation payments. The third major issue--whether to guarantee start-up cost recovery from the short-term market--is an excellent example of a proposed market rule change that should be critically analyzed for its impacts on market performance before it is implemented. The report notes that it is likely that implementing this market rule change would detract from market efficiency rather than improve it. Specifically, guaranteeing start-up cost recovery could prevent the Colombia market from realizing a lower cost solution that involves an intertemporal trade between fossil fuel and hydroelectric suppliers. A study is proposed to determine whether market performance would be enhanced or harmed by guaranteeing start-up cost recovery. The final major issue concerns the design of the MOR, the centralized market for standardized forward contracts proposed by the CREG. Section 6.2 points out that it is possible to allow individual retailers to participate in the MOR and allow them to buy and sell bilateral contracts outside of the MOR and still realize a major benefit of the MOR as market price that can be used to set the regulated wholesale price implicit in the retail price charged to regulated final consumers. This section also emphasizes that in order for the MOR to provide credible insurance against an El Nino events, the design should focus on sales on fixed-price forward contracts beginning delivery three or more years into the future, instead of products beginning delivery in two years or less. The regulatory price-setting process for natural gas is an important longer-term issue for the electricity market performance. A general set of recommendations for revising the natural gas price-setting process in Colombian was suggested. This is another area that could benefit from a more detailed and comprehensive study. As should be clear from the discussion in Section 6.1, the potential benefits to Colombian electricity consumers from a more coherent national natural gas regulatory framework are likely to be substantial. Other recommendations include increasing the flexibility in the offer curves that suppliers are able to submit to the short-term market to allow small firms that same aggregate offer curve flexibility afforded to large firms that own many generation units. The market competitiveness implications of this recommendations are analyzed using the theoretical framework presented in Section 2 of the report. Another recommendation is to establish a separate offer curve for Automatic Generation Control (AGC) services rather than continue to use a supplier’s energy offer curve for both the short-term energy market and AGC market.
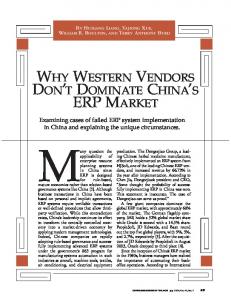
1. Introduction The Superintendencia de Servicios Públicos (SSPD) has asked me to analyze and comment on a number of issues relating to the performance and monitoring of the Colombian Electricity Supply Industry. At the start of the project, meetings were held in Bogota with various associations of market participants, market monitors, regulatory bodies, and government policymakers during the week of April 14 to 17, 2009 to hear their perspective on these issues. The entities I met with include: (1) Comité Sequimiento de Mercado Energia Mayorista (CSMEM), Asociación Nacional de Empresarios de Colombia (ANDI), Compania de Expertos en Mercados (XM), Asociación Colombiana de Generadores de Energía Eléctrica (ACOLGEN), Comisión de Regulación de Energía y Gas (CREG), Asociación Colombiana de Comercializadores de Energía (ACCE), Comité Asesor de Commercialión (CAC), Supervicios Ministerio de Minas y Energia (MME), Unidad de Planeación Minero Energética (UPME), Asociación Colombiana de Distribuidores de Energia Eléctrica (ASOCODIS), and Concejo Nacional de Operación (CNO). A number of the concerns raised during these meetings were related to the rapid increase in wholesale electricity prices that began in late 2008 and continued into early 2009. Figure 1.1 plots the 30-day quantity-weighted average of the hourly Bolsa prices from January 1, 2003 to June 30, 2009. In past seven months, the 30-day quantity-weighted average of the hourly Bolsa price has more than doubled from a low of 60 pesos/KWh in early December to approximately 140 pesos/KWh in early January of 2009. From the peak in early January, this average price declined to 80 pesos/KWh in early May and has since risen to approximately 110 pesos/KWh. A several stakeholder groups argued that the Bolsa price increase in early 2009 was the result of the increased exercise of unilateral market power by electricity suppliers. Other parties noted that input fossil fuel prices, in particular, the price of natural gas increased and the water levels declined during this time period, both of which should cause higher wholesale prices even if suppliers were unable to exercise unilateral market power. This report does not attempt to provide a detailed assessment of the extent to which each of these factors can explain the pattern of prices over the past seven months. However, the informal analysis presented below suggests that natural gas prices, and possibly the declining gap between total available generation capacity and total system demand, helps to explain the behavior of Bolsa prices since late to 2008 until the present time. Figure 1.1 also plots daily water storage levels from January 1, 2003 to June 30, 2009. Comparing the behavior of storage levels over the past seven months to the behavior of storage levels during the same time interval in other years during our sample period, suggests that water levels are not the cause of the prices increase in late 2008 and more recently. The peak storage level in late 2008 was higher than the peak storage level over the past three years and the most recent trough in the storage level at the end of the graph is higher than the trough in storage levels in all previous years. Figure 1.2 plots the wellhead price for natural gas for Ecopetrol for the Guajira field against the same 30-day quantity-weighted average of the hourly Bolsa prices. The steep increase in electricity prices beginning in late 2008 coincides with increase in the price of natural gas, and the steep decline in electricity prices in early 2009 corresponds with the drop in a 1
natural gas prices at this time. Figure 1.3 plots the 30-day moving average of hourly system demand and total generation availability from 2000 to the present. Although both figures are increasing since 2000, the difference between total availability and system demand has declined. This factor could also be a contributing factor to higher prices because of greater opportunities for suppliers to exercise unilateral market power or the need to call on higher-cost units more frequently to meet system demand. Section 3.1 provides a detailed discussion of empirical analysis that could be undertaken given data on market outcomes, generation unit characteristics (heat rates, forced and planned outage rates), and input fossil fuel prices to understand the relative to contribution to the behavior of Bolsa prices over the past seven months of water levels, input fossil fuel prices, and the ability and incentive of suppliers to exercise unilateral market power. Three major issues raised by stakeholders in response to the behavior of Bolsa prices over past seven months concerned the extent to which these prices were due to suppliers having an increased ability and incentive to exercise unilateral market power. The first issue is the extent to which the limited flexibility in the offer curves that suppliers submit to the wholesale market enhances their ability to exercise unilateral market power. The second is the extent to which the immediate release to the public of information on market participant behavior—offer curves, generation unit-level output levels, and scheduled and planned generation outages—enhances the ability of suppliers raise wholesale prices. The third issue is the impact on Bolsa prices of using the same offer price in the supply curve a generation unit owner submits to a uniform-price energy market (the Bolsa) and to a pay-as-bid auction for automatic generation control (AGC) services. A final system-wide market power issue is how to allow co-generation units owned by large industrial and commercial customers to participate in the short-term wholesale market. The second set of issues deals with the extent to which suppliers are able to exercise local market power. Local transmission constraints or other grid reliability restrictions can create system conditions when certain generation units are unable to operate. In this case, the generation unit is said be constrained off. Certain generation units may also be required to operate because of these same transmission or grid reliability constraints. These units are said to be constrained on. Generation unit owners receive payments for being constrained off or required to produce less than they are willing to produce at the Bolsa price. In Colombian context, the amount a generation unit owner is willing to produce at the Bolsa price, as expressed in the offer curve it submits to the market operator, is defined as the unit’s Ideal Generation. A generation unit receives a payment for being constrained on, or required to produce more than the unit’s Ideal Generation. The payment for producing less than the unit’s Ideal Generation is called a negative reconciliation payment and that for producing more than the unit’s Ideal Generation is called a positive reconciliation payment. Section 4 demonstrates that the mechanism used to determine these payments can cause generation unit owners that know they are likely to be required to produce more or less than their Ideal Generation to alter their offer behavior to increase the revenues they receive from reconciliation payments. The second local market power issue is whether suppliers should be able to submit start-up cost offers to the wholesale market operator in addition to their energy offer curve and receive explicit payments both for their start-up costs and the energy they produce rather than have to recover their start-up and other fixed costs from energy sales as has been the case since the Colombian wholesale market began operation. This issue also has implications for the design of the positive 2
reconciliation payment mechanism because a generation unit with an Actual Generation greater than its Ideal Generation receives start-up cost recovery, whereas there is currently no explicit payment for start-up cost recovery if a generation unit’s Ideal Generation is equal to its Actual Generation. The generation unit owner is paid the Bolsa price for the unit’s Actual Generation. A third set of issues deals with the wholesale electricity market monitoring process. The first question is how to determine whether suppliers are exercising unilateral market power and what to do about it. A second related question is how to distinguish the exercise unilateral market power from market manipulation or abuse of market power. A third question is the appropriate role for the Comité Sequimiento de Mercado Energia Mayorista (CSMEM) in the regulatory process for the Colombian wholesale electricity market. Specifically, how should it interact with the CREG, the SSPD and the MME and what rights and responsibilities should it have and why should it have them?
200
16
175
14
150
12
125
10
100
8
75
6
50
4
25
2
0 Jan 2003
Hydro storage (TWh)
Price ($/kWh)
Figure 1.1: Wholesale short-term prices and hydro storage levels, 2003–2009
0 Jan 2004
Jan 2005
Jan 2006
Spot price
Jan 2007
Jan 2008
Jan 2009
Hydro storage
Source: Neón. Short-term prices are a 30-day volume-weighted moving average. Sample period: 1 January 2003 to 30 June 2009.
3
200
8
175
7
150
6
125
5
100
4
75
3
50
2
25
1
0 Jan 2003
0 Jan 2004
Jan 2005
Jan 2006
Spot price
Jan 2007
Jan 2008
Wellhead natural gas price (US$/MCF)
Electricity spot price ($/kWh)
Figure 1.2: Electricity short-term prices and regulated natural gas prices, 2003–2009
Jan 2009
Colombia gas
Source: Ecopetrol (Guajira regulated wellhead price), Neón (wholesale electricity market short-term prices). Short-term prices are a 30-day volume-weighted moving average. Sample period: 1 January 2003 to 30 June 2009.
Figure 1.3: System demand and generation availability, 2000–2009 15000 12500
MW
10000 7500 5000 2500 0 2000
2001
2002
2003
2004
System demand
2005
2006
2007
2008
2009
Available generation
Source: Neón. System demand and generation availability are a 30-day moving average of the daily series. Sample period: 1 January 2003 to 30 June 2009.
4
A final set of issues deals with improving the overall efficiency of the electricity supply industry in Colombia. The first issue addresses the extent to which conditions in the natural gas supply industry in Colombia detract from the performance of the wholesale electricity market and what should be done to limit these adverse impacts. The second issue considers the design of the MOR, the centralized market for standardized fixed-price forward contracts proposed by the CREG. Several features of the current MOR proposal are shown to limit the potential net benefits Colombian electricity consumers realize from its existence. These features are described and suggested changes to the MOR design are proposed to address them. The remainder of the report will introduce each issue, present a framework for analyzing it, and then, where possible, suggest a remedy. To provide the necessary background for much of the analysis presented, the next section will define the exercise of unilateral market power and describe the determinants of a supplier’s ability and incentive to exercise unilateral market power in a bid-based wholesale electricity market. This section will also contrast the exercise of unilateral market power with the coordinated exercise market power by several suppliers, which is illegal under competition law in Colombia. Section 3 will use the framework outlined in Section 2 to discuss the system-wide unilateral market power issues raised by stakeholders. Section 4 will use the framework introduces in Section 2 to analyze the local market power issues raised. This section introduces the concept of a local market power mitigation mechanism and demonstrates that the Colombian reconciliation payment mechanism is a form of local market power mitigation mechanism. Section 5 discusses the role of a market monitoring process in the efficient operation of a wholesale electricity market. This section assesses the relative merits of methods for distinguishing the exercise of unilateral market power from the abuse of unilateral market power. It also contains a detailed discussion of the role of information disclosure in enhancing the competitiveness of wholesale market outcomes and the effectiveness of the regulatory oversight process. Section 6 considers enhancements to the regulation of the natural gas industry in Colombia and the design of the MOR, the centralized market for fixedprice forward contracts, in improving the performance of the Colombian electricity supply industry. Section 7 summarizes the report’s recommendations and suggests directions for future research to provide the information needed formulate more comprehensive solutions to a number of the issues identified in this report.
2. Unilateral Market Power in Wholesale Electricity This section first describes the mechanisms that expected profit-maximizing suppliers use to exercise unilateral market power in a bid-based wholesale electricity market. This theoretical framework is used to quantify the ability of a supplier selling into bid-based wholesale market such as the Colombian wholesale electricity market to exercise unilateral market power using data on the offer curves of all suppliers, market demand, and market-clearing prices and quantities produced for all market participants. How transmission constraints and other reliability constraints impact the ability of a supplier to exercise unilateral market power is then analyzed using this theoretical framework. This discussion distinguishes between the system-wide and local market power that a supplier has the ability to exercise. The fact that suppliers are typically vertically-integrated into electricity retailing and buy and sell various forward market obligations is then shown to alter the 5
supplier’s incentive to exploit its ability to exercise both system-wide and local unilateral market power. This discussion leads to a theoretical framework for assessing the incentive of a supplier to exercise unilateral market power.
2.1. The Ability and Incentive to Exercise Unilateral Market Power A market participant is said to possess the ability to exercise unilateral market power if it can take unilateral actions to influence the market price and to profit from the resulting price change. Because the demand-side of most electricity markets is composed of many small buyers (residential, industrial and commercial consumers) and the supply side is typically composed of a small number of large sellers, the primary market power concern in wholesale electricity markets is from suppliers taking actions to raise market prices. The Colombian wholesale electricity market has three large suppliers whose unilateral behavior could significantly impact market outcomes under certain system conditions. In other words, these three suppliers are likely to have the ability and incentive to exercise unilateral market power in the short-term wholesale electricity market (the Bolsa). Table 2.1 presents a breakdown of the generation and retailing market shares in Colombia for 2008. Empresas Publicas de Medellin (EEPPM), Empresa de Servicos Publicos (EMGESA), and ISAGEN together had a generation market share in 2008 of more than 66 percent. Although there is significant amount of vertical integration between generation unit owners and retailers in Colombia, the three largest generation unit owners were all net long in energy sales relative to their retail load obligations during 2008. For example, EEPPM owns the retailer ESSA in addition to its own retailing arm for a total retailing market share of 20.78% = (17.50% + 3.28%), relative to its generation market share of 24.09%. ENDESA owns the supplier EMGESA and the retailer CODENSA. EMGESA’s market share is 23.86% and CODENSA’s retailing market share is 16.15%. For ISAGEN these two figures are 18.58% and 5.55% respectively. As we discuss below, a larger generation market share than retailing market share implies that the supplier is likely to be net long in generation relative to its fixed-price forward market obligations, which implies that if the supplier has a significant ability to exercise unilateral market, it has a strong incentive to do so as well. Before continuing this section, it is important to emphasize that a supplier exercising all available unilateral market power subject to obeying the market rules is equivalent to that supplier taking all legal actions to maximize the profits it earns from participating in the wholesale market. Moreover, a firm’s management has a fiduciary responsibility to its shareholders to take all legal actions to maximize the profits it earns from participating in the wholesale market. Consequently, a firm is only serving its fiduciary responsibility to its shareholders when it exercises all available unilateral market power subject to obeying the wholesale market rules. Although two of the major participants in the Colombian wholesale electricity market are owned by a municipal government (EEPPM) or the federal government (ISAGEN), if the goal of these owners is to maximize the returns on their investment or to keep the retail price paid by their final consumers as low as possible, this can be accomplished by maximizing the profits these firms earn by selling electricity in the wholesale market. This logic implies that municipal or federal government owned suppliers that are net long relative to their fixed-price forward market obligations can also be expected to exercise all available unilateral market power. 6
Table 2.1: Firm-Level Generation and Retail Demand in Gigawatt-hours (GWh) and Market Shares in 2008 Suppliers Production in 2008 in (GWh) Market Share (%) EEPPM 13,104.8 24.09 EMGESA 12,979.9 23.86 ISAGEN 10,105.1 18.58 GECELCA 4,462.0 8.20 EPSA 4,205.6 7.73 CHIVOR 3,760.2 6.91 GESTIÓN ENERGÉTICA 1,323.0 2.43 Retailers EEPPM CODENSA ELECTRICARIBE EMCALI ISAGEN EMGESA ESSA (SANTANDER)
Demand in 2008 (GWh) 796.8 735.3 611.6 284.8 252.7 186.3 149.3
Market Share (%) 17.50 16.15 13.43 6.25 5.55 4.09 3.28
Source: “Colombian Electricity Market,” Presentation by XM, Bogota, April 14, 2009.
As discussed in Wolak (2007), there are a number of ways to modify the market structure, market rules, and the form of the regulatory process to limit the ability and incentive of suppliers to exercise unilateral market power. Thus, the role of regulatory oversight of the electricity supply industry is to institute market rules that ensure the conditions necessary for vigorous competition exist and limit the economic harm associated with the exercise of unilateral market power when they do not exist. To properly design and implement market rules that serve these purposes, policymakers must first understand why wholesale electricity markets are so susceptible to the exercise of unilateral market power and how suppliers actually exercise unilateral market power. These issues are discussed throughout the remainder of this section.
2.2. Measuring the Ability to Exercise Unilateral Market Power A supplier participates in a short-term wholesale electricity market by submitting for each pricing period an “offer curve”, which is composed of a series of offer steps. The length of the step specifies an incremental quantity of energy to be supplied and the height of the step is the price at which the supplier is willing to sell that quantity. For the case of the Colombian wholesale electricity market suppliers submit a single offer price for each generation unit for the entire day, but can change the maximum amount of energy they are willing to sell from each unit each hour of the day. For hydroelectric generation units, this offer price is subject to the additional restriction that it must almost be the same for all units owned by that supplier in the same hydroelectric energy chain or river basin. Figures 2.1 and 2.2 show hypothetical offer curves submitted by a supplier with multiple generation units for a single hour. For the lowest-priced offer step on Figure 2.1, the hypothetical supplier, Firm A, is willing to supply 920 MW at $0.03/MWh and if the market 7
price increases to $60/MWh, it is willing to supply an additional 430 MW, and so on. As the offer price increases, the supplier’s cumulative willingness to sell electricity increases along with the offer price, from 920MW at $0.03/MWh to 1,350MW at $60/MWh (= 920MW at $0.03/MWh + 430 MW at $60/MWh). Figure 2.2 shows the offer curve for hypothetical Firm B. Let denote the offer curve of supplier . At each price, , this function gives the total quantity of energy that supplier is willing to sell. The offer curves from each supplier can be used to construct the aggregate offer curve for any set of suppliers. This is done by calculating the cumulative quantity that the set of suppliers are willing to sell across the relevant range of prices. Let equal the aggregate offer curve for Firms A and B. In terms of the individual offer curves, , which at price is equal to the total amount of energy that firms A and B are willing means that to supply at price . Figure 2.3 shows the aggregate offer curve for firm-level offer curves shown in Figures 2.1 and 2.2. At a price of $200/MWh, for example, Firm A is willing to supply a total of 1,650 MW and Firm B is willing to supply 835 MW. Therefore, the aggregate offer of both firms at a price of $200/MWh is 2,485 MW. This procedure can be used to construct the aggregate offer curve for any collection of suppliers. Given the offer curves of all generation units in Colombia, the price each generation unit receives for its output and each buyer pays for its withdrawals is determined by intersecting this aggregate offer curve with the system demand. Define as the aggregate willingness-tosupply curve for a half-hour. It is equal to , where is the total … number of suppliers in Colombia. Let … , where is the demand at location and is the total number of consuming locations in Colombia. This market-clearing price is the solution in , to the equation . A hypothetical example of this process is shown in Figure 2.4. In the period, the total market demand is 4,400 MW and based on the aggregated offer curve for all the suppliers, the market price has to be at least $120/MWh for there to be enough supply offers to meet this demand. In Columbia, the spot price-setting process occurs the day after the actual operating day and uses the actual demand served and actual offer curves and actual availability of each generation unit.
8
Figure 2.1: Hourly Offer curve for Hypothetical Firm A 400
SA(p)
Highest offer price is $600/MWh; offers below $400 are shown
Price ($/MWh)
300
200 $140 100
System average price: $120/MWh
$93 $60
Firm A generation: 1500 MW
430MW
920MW
0 0
1000
2000
3000
Quantity (MW)
Figure 2.2: Hourly Offer curve for Hypothetical Firm B 400
SB(p)
Highest offer price is $2050/MWh; offers below $400 are shown
Price ($/MWh)
300
200 System average price: $120/MWh 100 Firm B generation: 785 MW 0 0
1000
2000 Quantity (MW)
9
3000
Figure 2.3: Combined offer curve for Firms A and B 400
SB(p)
SA(p)
SAB(p)
Price ($/MWh)
300
Firm A cumulative offer at $200: 1650 MW
200
Firm B cumulative offer at $200: 835 MW
100
0 0
1000
2000
3000
Quantity (MW)
Figure 2.4: Aggregate Hourly Offer curve for all suppliers 400
QD 4400 MW
S(p)
Price ($/MWh)
300
200 System average price: $120/MWh 100
0 0
1000
2000
3000 Quantity (MW)
10
4000
5000
6000
Figure 2.5: Calculation of residual demand for Firm A 400
SOA(p)
3350 MW
Price ($/MWh)
300
QD 4400 MW
1050 MW
200 System average price: $120/MWh
1500 MW
100 2560 MW
1840 MW
0 0
1000
2000
3000
4000
5000
6000
Quantity (MW)
Figure 2.6: Residual demand for Firm A 400
DRA(p)
1050 MW
Price ($/MWh)
300
200
100 1840 MW 0 0
1000
2000 Quantity (MW)
11
3000
Figure 2.7: Residual demand and offer curve for Firm A 400
DRA(p)
SA(p)
Price ($/MWh)
300
200 System average price: $120/MWh 100
Firm A gen 1500MW
0 0
1000
2000
3000
Quantity (MW)
Figure 2.8: Example showing residual demand and the calculation of inverse elasticity 400
DRA(p)
Price ($/MWh)
300 $250/MWh
200
108% System average price: $120/MWh
100 15% 1270MW
1500MW
0 0
1000
2000 Quantity (MW)
12
3000
2.2.1. Constructing residual demand curve from aggregate demand and offer curves The above description of the price-setting process market allows a graphical description of how suppliers exercise unilateral market power in a bid-based wholesale market, which motivates our measure of the ability of a supplier to exercise unilateral market power. To analyze the expected profit-maximizing offer behavior of an individual supplier using this graphical framework, the price-setting process can be reformulated in terms of the supplier’s own offer curve, the offers of other suppliers and the total market demand. Specifically, the price setting equation can be re-written as:
,
which implies that the total amount supplied by each firm at the market price, p, equals the total market demand. Suppose that we are interested in measuring the ability of just one supplier, supplier j, to exercise unilateral market power. This price-setting equation can be re-written as:
where
is the aggregate willingness-to-supply curve of all firms except supplier j, and so represents total market demand less supply by all firms except supplier j. Define as the residual demand curve facing supplier j at price p. Supplier j’s residual demand curve is maximum amount of energy that can be provided by supplier j at each possible price given the offer curves of its competitors. Figure 2.5 provides a graphical version of the above calculation of the residual demand curve for Firm A. The total market demand is 4,400 MW and the total quantity offered by all suppliers other than Firm A is 3,350 MW at $300 and 2,560 MW at $50. Therefore, Firm A’s residual demand at $300 is 1,050 MW (the market demand of 4,400MW minus 3,350 MW of supply by other suppliers at that price). Its residual demand at $50/MWh is 1,840 MW (the market demand of 4,400MW minus 2,560 MW of supply by other suppliers at that price). Figure 2.6 shows the residual demand curve resulting from performing this calculation for all possible prices for Firm A during this hour. Figure 2.7 combines Firm A’s residual demand curve from Figure 3.6 with Firm A’s offer curve from Figure 2.1 to compute the market-clearing price. 2.2.2. The inverse elasticity of the residual demand curve as a measure of a supplier’s ability to exercise unilateral market power The residual demand curve that a supplier faces summarizes its ability to influence the market price by submitting a different offer curve while keeping offer curves of other suppliers and the market demand unchanged. The firm can choose to produce any price and generation quantity along its residual demand curve. For example, Figure 2.8 shows a hypothetical residual demand curve. The realized price was $120/MWh and the quantity supplied by firm was 1,500MW, which gives the firm generation revenues of $90,000 in the hour. However, if the firm had increased its offer prices for this hour, it could have increased the market price to 13
$250/MWh, with a reduction in its quantity supplied to 1,270MW, which would give it a generation revenue of $158,750 even though it supplies less to the market. As shown in Figure 2.8, the hypothetical firm could have increased the market price by 108% with a reduction in its quantity supplied by 15%. The inverse elasticity of the residual demand curve at price p is defined as the ratio of percentage change in the price along the supplier’s residual demand curve that results from it selling a certain pre-specified percentage less output. In this case, the inverse elasticity is 108/15 = 7.2. Higher values of the inverse elasticity mean that the supplier has greater ability to alter the market price through its unilateral actions. If the inverse elasticity is greater than 1 then a given percentage reduction in the quantity supplied (e.g., 15% reduction in the above example) creates a greater percentage increase in the market price (e.g., 108% increase in the above example). Because the revenue a supplier receives is equal to price it sells at, multiplied by the quantity that it produces, such a relationship between the quantity reduction and price increase would lead to higher revenue for the supplier. Conversely, an inverse elasticity less than 1 corresponds to the case where a given percentage reduction in the quantity supplied creates a smaller percentage increase in the market price, and consequently lower revenue for the supplier. Because offer curves in the Colombian market are step functions, residual demand curves are also step functions. Therefore, the value of the inverse elasticity typically depends on the percentage reduction in the quantity supplied. Returning to Figure 2.8, a 15% percent reduction in the amount that the firm supplies implies a 108% increase in the corresponding price on Meridian’s residual demand curve, or an inverse elasticity of 7.2. Mathematically, the inverse residual demand elasticity for a 10 percent quantity reduction is equal to: ⁄
1⁄
0.10
where solves the equation 0.9 . It is the price on the supplier’s residual demand curve associated with at 10 percent quantity reduction relative to the market clearing quantity sold by firm j of qj. This inverse elasticity measures how much supplier j could increase the price it is paid by reducing the amount of output it is willing to sell given the offers of its competitors. This inverse elasticity is a key determinant of how far above its marginal cost (in percentage terms) a profit-maximizing supplier would like its offer curve to intersect with its residual demand curve. Specifically, the larger the value of the inverse of the elasticity of the residual demand curve, the greater is the percentage a profit-maximizing supplier would like the market price to be above its marginal cost. As noted above, a supplier’s residual demand curve gives the set of feasible price/quantity pairs that it can choose from to maximize its profits. Firms in imperfectly competitive markets often speak of “pricing to take what the competition gives them” or “pricing at what the market will bear.” This can be interpreted simply as the firm pricing along its residual demand curve. In this sense, a supplier’s residual demand curve shows the trade-off between a higher system price and lower generation quantity for the supplier.
14
Price
Figure 2.9: Profit-maximizing choice of price and quantity
MC
P1
MR1
DR1
Q1
Price
Figure 2.10: Profit-maximizing price and quantity with elastic residual demand
MC
P2
DR2
MR2 Q2
15
Quantity
Price
Figure 2.11: Profit-maximizing price and quantity with infinitely elastic residual demand
MC
DR3 = MR3
P3
Q3
Quantity
Simplifying to the case of a linear residual demand curve and continuous marginal cost curve allows a straightforward illustration of this relationship. Assume for the moment that the supplier knows the offers of its competitors and the level of market demand. These two factors completely determine the supplier’s residual demand curve. The effect of this trade-off on the firm’s revenue is shown by the marginal revenue curve, labeled in Figure 2.9. The marginal revenue curve shows the total revenue change associated with each additional unit of quantity sold. The marginal revenue curve is steeper than, and lies below, the residual demand curve because each additional unit sold by the firm requires it to accept a lower price, not just for this additional unit, but on all units sold, because of the market-clearing price determination process described above. The supplier maximizes profits by producing at the output level where the marginal revenue associated with selling an additional MWh equals marginal cost associated with producing an additional unit. Producing one unit m this quantity will lower the firm’s profits, because the revenue received from supplying the additional unit is less than the cost of producing it. Likewise, if the firm produces one unit less than this quantity, then it is giving up profits, because the potential revenue from supplying that unit is greater than its cost of and marginal cost curve in Figure 2.9, a production. For the residual demand curve profit-maximizing firm will supply the quantity , the output level at the point of intersection of the marginal cost and marginal revenue curves. Note that the system price will be , the intersection of quantity with the residual demand curve. Note that this price exceeds the firm’s marginal cost of production at . The firm’s profits are given by the shaded area to the left of below and above the marginal cost curve. 16
Figure 2.10 repeats the process of computing the profit-maximizing level of output for a flatter residual demand curve, , and the same marginal cost curve as in Figure 2.9. A profitmaximizing supplier will produce the quantity at a price of . Note that difference between and the firm’s marginal cost is smaller than in Figure 2.9, which is a result of the flatter residual demand curve in Figure 2.10. The case is of a perfectly elastic residual demand curve, , is shown in Figure 2.11. This residual demand curve is the result of a flat aggregate offer curve of all other suppliers besides supplier , which implies that there many other firms willing to supply the entire market at the price . For this residual demand curve, the marginal revenue curve coincides with the residual demand curve, because producing an additional unit of output has no effect on the market price, which implies that the additional revenue received by the firm from selling one more unit of output is equal to that price, , for all output levels. For the reasons discussed above, a profit-maximizing firm will produce at the point where marginal revenue is equal to marginal cost. For the case of an infinitely elastic residual demand curve, the marginal revenue curve is equal to the market price for all output levels. Unilateral profitmaximizing behavior implies that the firm will produce at the output level where its marginal and price in Figure 2.11. cost is equal to the market price, which is the output level This example demonstrates the very important point that if a supplier faces a sufficiently elastic residual demand curve, typically because there is large number of independent suppliers competing to sell energy at the same price, then it is unilaterally profit-maximizing for this supplier to produce at the point where the market price is equal to its marginal cost. The firm accomplishes this market outcome by submitting an offer curve that is equal to its marginal cost curve, because the intersection of this offer curve with its residual demand curve produces the desired price/quantity pair. The examples in Figures 2.9 and 2.10 demonstrate that when a profit-maximizing supplier faces a downward sloping residual demand curve, the firm will find it unilaterally profitmaximizing to produce at an output level that is below the output level at the point of intersection of its marginal cost curve with its residual demand curve. In Figure 2.9, the firm into the market, even though the price greatly exceeds its would optimally only offer only marginal cost at that level of production. The firm accomplishes this by submitting an offer curve that lies above its marginal cost curve, giving an offer price for that level of output above the marginal cost of producing that output. Figures 2.9 and 2.10 suggest that the percentage by which the supplier’s profit-maximizing offer price exceeds the supplier’s marginal cost is greater the larger is the inverse elasticity of the residual demand curve. 2.2.3. Transmission constraints and the computation of the residual demand curve The above description of the process used to compute a supplier’s residual demand curve assumes that all of the offers of the each supplier are physically able to meet system demand. However, transmission and other grid reliability constraints can prevent the system operator from accepting offers from certain generation units. To understand how transmission constraints can alter the residual demand curve a supplier faces consider the following example shown in Figure 2.12. Suppose that in a single hour 3,000 MWh of demand is located on one side of a transmission path (at node B in Figure 2.12) with 2,000 MW of capacity and a single supplier owns 1,500 MW of generation capacity local to this demand. Suppose there are 5 firms, each of which owns 1,000 MW of capacity, located at node A on the other side of the transmission path. 17
For this transmission network configuration, the local supplier must produce at least 1,000 MWh of the local demand of 3,000 MWh, because transmission network capacity only allows 2,000 MWh of energy to be transferred into the load center. Consequently, at a sufficiently high price, the local supplier is a monopolist facing a perfectly inelastic residual demand of 1,000 MW. Without a local market power mitigation mechanism, this local supplier should find it expected profit-maximizing to offer to sell 1,000 MWh of energy at an extremely high price. Note that this high price occurs despite the fact that there is plenty generation capacity available to serve the local demand. There is a total of 6,500 MW of generation capacity available to serve the 3,000 MWh of local demand—a total of 5,000 MW from the 5 distant suppliers and 1,500 MW from the single local supplier. Figure 2:12: Transmission Constraints and Residual Demand
GB = 1,500 MW G4A = 1,000 MW
G3A = 1,000 MW
G5A = 1,000 MW
A
B 2,000 MW
G2A = 1,000 MW
G1A = 1,000 MW DB = 3,000 MWh
Computing the residual demand curve that a supplier faces ignoring the impact of transmission constraints can significantly under-estimate the extent of unilateral market power that the supplier is able to exercise. It is possible to modify the residual demand calculation to account for the transmission capacity. We now explain the computation of the residual demand faced by a supplier for a general version of this two node example. The transmission link has two distinct effects on the residual demand calculation. First, the market demand faced by an individual supplier is the market demand in the supplier’s own node, plus the portion of the demand in the other node that can be supplied given the transfer capacity limit. Second, the relevant offers from competing suppliers, used to calculate the aggregate offer curve of other generators, are those offers from generators in the supplier’s own node, plus the portion of the offers from generators at the other node that can be sent to the supplier’s node given the transfer capacity limit between the two nodes. The transmission-constrained residual demand curve that a supplier faces is always at least as steep the unconstrained residual demand curve because transmission constraints eventually limit the ability of suppliers located outside the region to sell additional energy. As discussed above, this steeper (or more inelastic) residual demand means that the generator has greater ability to increase the market price (at least for the portion of the market that they supply) by reducing their generation offers or increasing their offer prices. For the general case of a non-zero transmission capacity between the two nodes, the transmission-constrained residual demand curve for a supplier located at node B is defined as follows. Consider supplier j located in the B. To construct its residual demand curve define as the demand at node B and as the demand at node A, and is the available 18
transmission capacity from A to B and is the available transmission capacity from B to A. Let equal the aggregate willingness-to-supply curve of all node A firms besides firm equal the aggregate willingness-to-supply curve of all node B firms besides firm . and In terms of this notation the residual demand curve facing supplier at node B is equal to: max , min , , where max , is a function that gives the maximum of and and min , is a function that gives the minimum of and . Following this same logic for a node A supplier, the residual demand curve for supplier node A is equal to max
, min
,
.
These transmission-constrained residual demand curves can be used to compute inverse elasticities using the procedure described above to obtain location-specific measures of the ability of suppliers to exercise unilateral market power. The inverse elasticity of the transmission constrained residual demand curve faced by an individual generation unit or set generation units at given location in the transmission network measures the ability this supplier to exercise local market power at this location. There is a direct relationship between the constrained-on and constrained-off problem and supplier’s transmission constrained residual demand curve. A supplier that is constrained on faces a completely inelastic residual demand for certain quantity of energy because of transmission constraints. In the example in Figure 2.12, the supplier at node B would be constrained on for 1,000 MWh because it faces a completely inelastic residual demand curve for this amount of energy. Correspondingly, a supplier is constrained off at a location if it faces a negative or zero transmission constrained residual demand for its output at positive prices. 2.2.4. A simplified model of expected profitmaximizing offer behavior To understand precisely how a supplier exercises unilateral market power, the above framework needs to be made more representative of how Colombian wholesale electricity market actually operates. The discussion thus far has assumed the supplier’s residual demand curve is known when that supplier computes its profit-maximizing output level. Because a supplier’s residual demand curve is composed of the willingness-to-supply offers of its competitors and the Colombian market rules require all suppliers to submit their offers at the same time, this assumption is not in fact true. However, the economic justification for using the inverse elasticity of a supplier’s residual demand curve as a measure of its ability to exercise unilateral market power carries over to the case that suppliers do not observe the actual residual demand curve they face at the time they submit their offers to the wholesale market, for the reasons described below. Although a supplier does not know with complete certainty the market demand and the willingness-to-supply offers of other firms when it submits its offers for the pricing period, several features of the Colombian market imply that each supplier can estimate the distribution of realized residual demand curves that it might face during each hour of the day. The hourly 19
pattern of demand throughout the day does not typically vary substantially across days of the week during the same month, so that the difference between the day-ahead forecast of demand in an hour or yesterday’s demand during that hour and the actual demand in that hour is typically a small fraction of the hourly demand. The capacity and operating characteristics—input fossil fuel, fossil fuel price, and heat rate—are publicly available to all market participants. This information significantly reduces the amount of uncertainty each supplier has about the form of its competitors’ offer curves. In addition, as noted earlier the Colombian market rules severely constraint the form of the offer curves that suppliers can submit. For example, besides the total system demand for each hour of the day, a supplier must only estimate the daily offer price and single offer quantity for each hour of the day from the generation units owned by each of its competitors in order to compute an estimate of the residual demand curve it will face each hour of the following day. As discussed in Section 3, the restrictions on the form of the offer curves that a supplier is able to submit to the short-term market also makes it less likely that a supplier with the ability to exercise unilateral market power will submit low daily offers price for it generation units. That is because the supplier knows that this single offer price remains valid for all 24 hours of the day. The public availability of offer prices and quantities for all market participants the day-after actual market operation also provides supplier with information about the distribution of residual demand curves that it is likely to face each hour of the following day. All of these factors imply that suppliers in the Colombian electricity market are able to obtain relatively precise estimates of the distribution of possible residual demand curves that they might face. As we discuss Section 5, one argument in favor of immediate public release of offer data is that this will allow suppliers to compute better estimates of the distribution of residual demand curves that they might face. For each possible residual demand curve realizations, the supplier can find the ex post profit-maximizing market price and output quantity pair, given its marginal cost curve, following the process described above. This is the market price and output quantity pair that an expected profit-maximizing the supplier would like to achieve for this residual demand curve realization. Figure 2.13 illustrates the construction of an expected profit-maximizing willingness to supply curve using this process for the case of two possible residual demand curve realizations, and . Because these residual demand curves are assumed to be continuously differentiable functions, the following procedure can be applied. For each residual demand curve realization, intersect the marginal cost curve with the marginal revenue curve associated with that residual demand curve realization. For example, for the marginal revenue curve for this residual demand curve (not shown on the figure) intersects the marginal cost curve at the quantity . The output price associated with this output level on is . Repeating this process for . Note that because both residual yields the profit-maximizing price and quantity pair, , demand curves are very steeply sloped, there is a substantial difference between the market price and the marginal cost at each output level. If these two residual demand realizations were the only ones faced by the supplier, it would submit an offer curve that passes through both of these points, because regardless of the residual demand realization, the offer curve would cross the realized residual demand curve at an ex post expected profit-maximizing level of output. The 20
straight line connecting the points offer curve.
,
and
,
is one such expected profit-maximizing
To illustrate the impact of more elastic residual demand curves on the offer curves submitted by an expected profit-maximizing supplier, Figure 2.14 repeats the construction of an expected profit-maximizing offer curve for the case of two more elastic residual demand realizations, and . The line connecting the points , and , , which is an expected profit-maximizing offer curve for these two residual demand realizations, is much closer to the supplier’s marginal cost curve. Specifically, for each residual demand realization, the price associated with the profit-maximizing level of output for that residual demand curve realization is closer to the marginal cost of producing that level of output than it was in Figure 2.13. This outcome occurs because each residual demand realization is much more elastic at the two output levels than the two residual demand realizations in Figure 2.14. Figure 2.15 considers the case of two infinitely elastic residual demand curve realizations, and , meaning that for both realizations the supplier faces sufficient competition that the entire market can be satisfied at a fixed price by the remaining suppliers. By the logic described above, the supplier will find it unilaterally profit-maximizing to produce at the intersection of each residual demand curve realization with its marginal cost curve. In this case, the supplier’s expected profit-maximizing offer curve, the line connecting the profitmaximizing output levels for each residual demand curve realization, is equal to the supplier’s marginal cost curve. This result illustrates the very important point that if a supplier faces sufficient competition for all possible residual demand curve realizations, then it will find it unilaterally expected profit-maximizing to submit an offer curve equal to its marginal cost curve. The examples in Figures 2.13 to 2.15 utilize linear residual demand curves. However, the same process can be followed to compute an expected profit-maximizing offer curve for the case of step function residual demand curves. Figure 2.16 shows how this would be done for the more realistic case of step function residual demand curves with two possible residual demand realizations. For each residual demand curve realization, the supplier would compute the profitmaximizing level of output and market price for the marginal cost curve given in Figure 2.16. and for . If these two residual For this is the point , this is the point , demand curve realizations were the only possible residual demand realizations that the supplier could face, then any step function offer curve that passes through these two points (for the example, the one given in Figure 2.16) would be an expected profit-maximizing offer curve. However, computing the expected profit-maximizing offer curve for a supplier is generally more complex than passing an offer curve through the set of all possible ex post expected profit-maximizing price and output quantity pairs. This is because the market rules can prevent a supplier from achieving the ex post profit-maximizing market price and output quantity pair for all possible residual demand realizations. Specifically, unless all of these ex post profitmaximizing price and quantity pairs lie along a willingness-to-supply curve for the supplier that the market rules allow it to submit, it is not possible for the supplier to submit a willingness to supply curve that always crosses the realized residual demand curve at an ex post profitmaximizing price and quantity pair for that residual demand curve realization. Figure 2.17 provides an example of this phenomenon. This figure adds a third residual demand curve to 21
Figure 2.16 and computes the ex post profit-maximizing price and quantity pair for . This price quantity pair is denoted by the point , . Note that this point lies above and to the left of the point , . This makes it impossible for the supplier to submit a non-decreasing step function offer curve that passes through the three ex post profit-maximizing price and output quantity pairs. In this case, the supplier must know the probability of each residual demand curve realization in order to choose the parameters of its expected profit-maximizing willingness to supply curve. Figure 2.17 demonstrates that the expected profit-maximizing residual demand curve need not pass through any of these three points. The form of the expected profitmaximizing willingness-to-supply curve depends on the shape of each residual demand curve realization and the probability that it occurs. The general case of computing the expected profit-maximizing willingness-to-supply curve illustrates that this curve may not pass through the ex post profit-maximizing price and output quantity pair for any residual demand curve realization. As shown in Wolak (2003a) and Wolak (2007), the supplier chooses the price levels and quantity increment that determine its offer curve to maximize its expected profits over the distribution of residual demand curve realizations that it faces. Nevertheless, the inverse elasticity of the realized residual demand curve at the actual market-clearing price still provides a measure of the ability of a supplier to exercise unilateral market power. Specifically, this inverse elasticity quantifies the percentage increase in the market-clearing price that would have occurred if the supplier had reduced the amount of output it sold by a pre-specified percentage. This interpretation of the inverse elasticity of the residual demand curve does not rely on the assumption that the realized output level and market-clearing price maximize the supplier’s ex post profits. If each realization of the residual demand curve did cross the supplier’s offer curve at this ex post profit-maximizing point, then for every market-clearing price and quantity pair the difference between the market price and the supplier’s marginal cost at its current output level divided by the market price would equal the inverse of the elasticity of the residual demand curve. As emphasized in Wolak (2003b) and Wolak (2007), expected profit-maximizing offer behavior does not imply that every point of intersection of the supplier’s offer curve with its residual demand curve yields the ex post profit-maximizing price and output quantity pair for the supplier for that residual demand curve realization. Therefore, there is no deterministic relationship between the difference between the market-clearing price and the firm’s marginal cost of production at its actual output level divided by the market-clearing price and the value of the inverse elasticity of the residual demand curve. An additional implication of this result is that the inverse of the elasticity of residual demand curve need not be less than one, which would be required if it had to equal the market price minus marginal cost divided by the market price.
22
Price
Figure 2.13: Derivation of offer curve (steep residual demand curves)
MC
Offer curve P1 P2
DR2 Q2
DR1
Q1
Quantity
Price
Figure 2.14: Derivation of offer curve (flatter residual demand curves)
MC
Offer curve P1 P2
DR1 DR2 Q2
Q1
23
Quantity
Price
Figure 2.15: Derivation of offer curve (perfectly elastic residual demand curves)
MC
P1
P2
Offer curve
DR1
DR2
Q2
Q1
Quantity
Price
Figure 2.16: Impact of Step Functions Residual Demands on Optimal Offer Curve
Offer curve
MC
P2
P1
DR2 DR1 Q1
Q2
24
Quantity
Price
Figure 2.17: Expected Profit-Maximizing Offer Curve
Offer curve MC
DR3
DR2 DR1 Quantity
2.3. Measuring the Incentive to Exercise Unilateral Market Power The above discussion of expected profit-maximizing offer behavior assumes the supplier only earns revenues from selling energy in the wholesale market. However, as noted in the discussed surrounding Table 2.1, the three largest suppliers in the Colombian market are all vertically integrated into retailing. They not only sell energy in the wholesale electricity market, but they also sell electricity to final consumers at retail prices that do not vary with hourly prices in the wholesale market. These fixed-price retail load obligations function very much like fixedprice forward financial contract obligations, because the vertically-integrated supplier has essentially made a commitment to provide its fixed-price retail load obligation at a predetermined wholesale price. Although the Colombian market is composed of both regulated demand (primarily residential customers) and non-regulated demand mostly from large industrial and commercial customers, both regulated and non-regulated retail load obligations sold by supplier at retail prices that do not vary with hourly Bolsa price have the same impact on the supplier’s offer behavior in the short-term market. For the quantity of energy sold at a fixed retail price (that does not vary with the hourly Bolsa price) the supplier cannot increase its profits by raising the Bolsa price. The supplier can only earn higher profits by raising the Bolsa price during a given hour if sells more energy in the short-term market than its total fixed-price forward market obligations (retail load sold at a fixed price plus net fixed-price forward contract obligations) for that same hour.
25
Figure 2.18 shows a hypothetical offer curve and residual demand curve for Firm C during an hour. By increasing the price at which it offered in its generation, this supplier could have moved to the point on its residual demand curve shown by the red dot. This would have increased the market price by 100% (from $120 to $240/MWh) and reduced the quantity supplied by the firm by 35% (from 1,170 MWh to 765 MWh). As a result, the supplier’s generation revenue in this half-hour would have increased from $70,200 to $91,800. However, if it had a fixed-price retail load obligation of 865 MW, its net revenue from transactions in the wholesale market would have decreased substantially. At the market-clearing price it sold 1,170 MWh and bought 865 MWh from the wholesale market, at the market price of $120/MWh. Therefore, its net position was 305MW, the difference between 1,170 MW and 865 MW, so the firm’s net revenue would have been $18,300 (305MW at $120/MWh for one half-hour). At the higher price, the firm would have sold 765MW while still buying 865MW from the wholesale market, now at the higher market price of $240/MWh. Its net position would have been -100MW, and its net revenue -$12,000 (-100MW at $240/MWh for one half-hour). This example demonstrates the importance of the supplier’s fixed-price load obligations in considering its incentive to increase the market price. In general, because a supplier with retail load obligations sold at a price that does not vary with hourly Bolsa price has to serve the load at a pre-specified retail price no matter what the actual wholesale price is during that hour, an wholesale market price increase during a given hour has two opposite effects on the supplier’s profits: (1) it increases the supplier’s profits from selling energy in the wholesale market; and (2) it decreases the suppliers’ profits by raising the cost of serving its retail demand. Consequently, whether and to what degree a price increase is beneficial to a vertically-integrated supplier depends on whether and to what degree the profit increase from selling wholesale electricity more than offsets the increase in cost of serving retail demand covered by the supplier’s fixed-price forward market obligations. If the profit reduction due to the cost increase in (2) exceeds that profit gain in (1), a supplier would lose profits from a market price increase. In that case, the supplier would not want to exercise unilateral market power to increase the market price. So, for a supplier, the comparison between its profit gain and loss from a price increase depends on the difference between the supplier’s sales in the shortterm market and its fixed-price forward market obligations—its retail load sold at a price that does not vary with the hourly Bolsa price plus its net (sales less purchases) fixed-price forward contract obligations. For example, suppose that a generation unit owner’s supply to the market is 2,000 MW while its fixed-price forward market obligation is 1,500 MW. In that case, a $1 increase in market price would increase the supplier’s profits from its generation sales by $2,000 while increasing the cost of its load obligation by $1,500, implying a net gain of $500 (or $1 times the 500 MW difference between the supplier’s supply of 2,000 MW and fixed-price forward market obligations of 1,500 MW). In that case, the supplier has an incentive to increase market price through its unilateral actions because it is profitable to do so. However, if the supplier has a significantly larger fixed-price forward market obligation of 2,500 MW, then the $1 increase in market price would imply a net loss of $500 (or $1 times the -500 MW difference between its supply and fixed-price forward market obligations), which is the supplier’s profit gain from its generation sales ($2,000) is less than the increase in the cost to meet its fixed-price forward market obligation ($2,500). 26
Figure 2.18: Effect of fixed-price obligations on Offer Curve of Firm C 400
DRC(p)
Firm C load 880MW
SC(p)
Price ($/MWh)
300
200 System average price: $120/MWh 100
Firm C generation 1170MW
0 0
1000
2000
3000
Quantity (MW)
To understand the incentives to exercise unilateral market power of a supplier with fixedprice retail load obligations or fixed-price forward market obligations, first define the following notation. Let equal the retail price at which the firm is selling MWh of retail electricity. Let equal the firm’s residual demand curve for sales in the short-term market and the market price. For simplicity, assume that is the constant marginal cost of producing electricity and is the average cost of retailing, transmitting, and distributing wholesale electricity to final customers. The vertically-integrated suppliers in Colombia also participate in the market for fixed-price long-term contract obligations. Let equal the quantity-weighted average price of equal the fixed-price forward contract obligations held by the vertically-integrated firm and net (sales minus purchases) quantity of fixed-price forward contract obligations. The firm’s variable profits (profits excluding fixed costs) from selling into the short-term wholesale market given these forward market commitments is equal to Π The first term is the profits from retail sales. The second term is the profits from wholesale electricity sales in the short-term market. The third term is the profits or losses from fixed-price forward contract obligations, and the final term is the cost of distributing retail electricity. This expression for the firm’s variable profits from participating in the short-term market can be re-written as: .
Π
27
The first and second terms are profits from retailing assuming cost $/MWh to produce, and the second term is the profit from sales of fixed-price forward contracts assuming is produced at $/MWh. The third term is the only one that depends on the short-term market price. The first and second terms only depend on prices and quantities that the supplier cannot influence at and and and , the time they are offering to sell in the short-term market-respectively. This form of the firm’s profit function shows that the values of and , the firm’s retail load obligation and net fixed-price forward contract obligations influence its incentive to exercise unilateral market power. Even though the supplier may face a very inelastic residual demand curve, it would have little incentive to reduce the output it sells to raise prices above its marginal cost if the amount it sells in the short-term market, , is less than the sum of its . Under these circumstances, the verticallyfixed-price forward market obligations, integrated supplier is a net buyer from the short-term market. It has obligations for purchases of from the short-term market and it only sells . As a net buyer, the supplier would like the price to be as low as possible. When exceeds , the vertically-integrated supplier is a net seller in the wholesale market and as such would like to raise the price at which it sells its net output in the short-term market. The difference between a firm’s sales in the short-term market and its fixed-price retail load and forward contract obligations is its residual demand net of its forward market obligations. In terms of the above notation, this net residual demand curve is equal to . Depending on whether a supplier’s net residual demand is positive (“net long”) or negative (“net short”), the supplier has an incentive to either increase or decrease the market price through its unilateral actions. If a supplier is net long (i.e., has a positive net residual demand), it will benefit from a higher market price because it is making net sales into the short-term market. Consequently, the larger a supplier’s net residual demand, the greater is the supplier’s gain from a market price increase. Conversely, the more a supplier is net short (i.e., a negative net residual demand), the greater is the supplier’s incentive to decrease market price because it is a net buyer from the short-term market. In terms of this net residual demand function, the firm’s profit function becomes: Π
, where
.
The first two terms in the profit function written above are collected into the term because all of the variables comprising of these terms are not affected by the supplier’s offers into the shortterm wholesale market and are known before the supplier submits these offers. This expression for the vertically integrated supplier’s profit function takes the same form as a non-vertically integrated supplier with the net residual demand curve in place of the supplier’s residual demand curve.
28
Price
Figure 2.19: Profit-maximization with fixed-price contracts, part I
MC
QR + QC
DRF(p)
MRF(p)
DR(p) Quantity
Price
Figure 2.20: Profit-maximization with fixed-price contracts, part II
MC
QR + QC P4
MRF(p) + QR + QC
MRF(p) Q4
29
DR(p) Quantity
Price
Figure 2.21: Price and quantity with and without fixed-price contracts
MC
P1
No contracts With contracts
P4
DR(p) Q1
Q4
Quantity
Price
Figure 2.22: Derivation of offer curves with and without fixed-price contracts
MC Offer curve with no contracts Offer curve with contracts
DR2(p)
DR1(p) Quantity
30
To determine the firm’s profit-maximizing price and quantity pair we can solve for the value of that maximizes the expression the variable profit function, Π . We can also follow a slightly more involved version of the graphical approach shown in Section 2.2. Figure 2.19 shows the original residual demand curve shifted to the left by the amount of the supplier’s fixed-price forward market obligations, . Figure 2.19 also graphs the supplier’s marginal revenue curve for sales in excess of its fixed-price forward market obligations. Because the firm’s production decision must still take account of its forward market position, Figure 2.20 shifts the marginal revenue curve of the net residual demand curve right by the amount of the fixed-price contract obligations. The firm produces at the point where this marginal revenue curve including fixed-price forward market obligations intersects the marginal cost curve, the output level in Figure 2.20. The short-term market price is determined by the supplier’s original residual demand curve at this level of production, the price in Figure 2.20. Figure 2.21 demonstrates the impact of fixed-price forward market obligations on the supplier’s expected profit-maximizing price and output quantity pair. For the residual demand curve given in Figure 2.21, a supplier without any forward market obligations would find it optimal to produce at the price and output quantity pair , that was derived in Figure 2.9. A supplier with the level of fixed-price forward market obligations shown in Figure 2.20 and facing this same residual demand curve would find it unilaterally profit-maximizing to produce , at the price and output quantity pair . As shown in Figure 2.21, a firm with fixed-price forward market obligations facing the same residual demand curve finds it unilaterally profitmaximizing to sell more output in the short-term market at a lower price, and . There is even a level of fixed-price forward market obligations that would cause a supplier facing a steep residual demand curve to find it unilaterally profit-maximizing to produce at the point of intersection of its marginal cost curve with its residual demand curve. Specifically, if is chosen to equal , the value of output at the point of intersection of the residual demand curve with the supplier’s marginal cost curve, the supplier will find it unilaterally profit-maximizing to produce at , regardless of the slope or inverse elasticity of the residual demand curve. In other words, a supplier that possesses a substantial ability to exercise unilateral market power, as measured by the inverse elasticity of its residual demand curve, has no incentive to do so because of the level of its fixed-price forward market obligations. The relationship in Figure 2.21 carries over to the case of constructing expected profitmaximizing offer curves with fixed-price forward market obligations. Figure 2.22 repeats the computation of the expected profit-maximizing offer curve for the same two residual demand curve realizations for the case of no fixed-price forward market obligations and positive fixedprice forward market obligations. For the case of positive forward market obligations, the expected profit-maximizing offer curve is much closer to the firm’s marginal cost curve than the expected profit-maximizing offer curve derived assuming the firm has no fixed-price forward market obligations. This is a general result on the impact of fixed-price forward market obligations on the expected profit-maximizing offer curve of a supplier. The higher the level of fixed-price forward market obligations relative to the supplier’s actual short-term market sales, the closer is the expected profit-maximizing offer curve to the supplier’s marginal cost curve.
31
Because fixed-price forward market obligations alter the incentive of a supplier to exercise unilateral market power, the net residual demand curve can be used to construct a measure of the incentive, as distinct from the ability, of a supplier to exercise unilateral market power. This measure is the inverse elasticity of the net residual demand curve. In terms of this inverse elasticity is defined as: 1
1
,
which is also equal to the percentage change in the market-clearing price as a result of a one percent change in the net residual demand of the supplier. The inverse elasticity of the net residual demand curve is related to inverse elasticity of the residual demand curve by the following equation: 1
1⁄ .
The inverse elasticity of the residual demand curve times the exposure of the supplier to the short-term market is equal to the inverse elasticity of the net residual demand curve. Note that in spite of the fact that the inverse elasticity of the residual demand curve is always positive, the inverse elasticity of the net residual demand curve can be negative or zero. Zero occurs if the supplier’s short-term market sales equals its fixed-price forward market obligations, . A negative inverse elasticity occurs if the supplier’s short-term market sales are less than its fixed-price forward market obligations, . The same caveats apply to the use of the inverse elasticity of the net residual demand curve when it is applied to step function residual demand curves such as those that exist in the Colombian wholesale electricity market. Specifically, the researcher must choose the percentage change in the supplier’s net position and then compute the implied change in the market price from the residual demand curve. The most straightforward way to compute values of the two inverse elasticities that are internally consistent is first to compute the inverse elasticity of the residual demand curve and then use the above relationship that relates this magnitude to the inverse elasticity of the net residual demand curve. For the same reasons as described above for the case of the inverse elasticity of the residual demand curve, expected profit-maximizing offer behavior with fixed-price forward market obligations does not imply a deterministic relationship between the inverse elasticity of the net residual demand curve and the difference of the market price and the marginal cost of the supplier’s highest cost generation unit operating in that period divided by the market price. Nevertheless, the inverse elasticity of the net residual demand curve still provides a valid index of the incentive of supplier to exercise unilateral market power because it measures the percent increase in the market-clearing price that would result from a one-percent change in the supplier’s net position.
32
2.4. Pivotal and Net Pivotal Supplier Indexes of the Ability and Incentive to Exercise Unilateral Market Power The residual demand curve and net residual demand curve can be used to derive additional measures of the ability and incentive of a supplier to exercise unilateral market power. In contrast to measures derived using the inverse elasticity, these measures typically depend on the behavior of the residual demand curve and net residual demand curve at prices significantly higher than the market-clearing price. As a consequence, these measures capture a more extreme ability and incentive to exercise unilateral market power. Figure 2.23 shows the construction of a residual demand curve for the case in which the aggregate willingness-to-supply curve of all other suppliers reaches its capacity before system demand is met. As shown in the figure, this yields a residual demand facing the supplier that is positive for all possible prices. Because the real-time demand for electricity is perfectly inelastic and the production of electricity is subject to capacity constraints, it is possible for the residual demand curve facing a supplier to become perfectly inelastic at some positive output level. A supplier that faces a residual demand curve that is positive for all possible positive prices is said to be a pivotal because some of its supply is necessary to serve the market demand regardless of the offer price. The output level at which the supplier’s residual demand curve becomes perfectly inelastic is called the pivotal quantity and it is shown in Figure 2.23 as the quantity associated with the vertical portion of the residual demand curve. Mathematically, a supplier is pivotal if 0 where is the highest possible price that could occur in the market. The is called the pivotal quantity. If a supplier is pivotal, this means that quantity regardless of the offer price it submits, at least the pivotal quantity must be accepted from the supplier. A pivotal supplier has the ability to set the market price as high as it would like if it is willing to sell only the pivotal quantity. Although a pivotal supplier clearly has a substantial ability to exercise unilateral market, it may not have an incentive to do so because of its fixed-price forward market obligations. In particular, if the supplier’s fixed-price forward market obligations exceed its pivotal quantity, , then the supplier would have no incentive to exploit the fact that it is pivotal for the reason that it is a net buyer of energy at output levels equal to or below its pivotal quantity. The net residual demand curve can be used to determine whether a pivotal supplier would have an incentive to exploit the fact that it is pivotal. Specifically, if a supplier is net pivotal, 0. then clearly it has such an incentive. A supplier is said to be net pivotal if The quantity is called the net pivotal quantity. By definition of the net residual demand function, if a supplier is net pivotal and it has positive fixed-price forward market obligations, then the supplier is also pivotal. This means that regardless of the offer price it submits, at least , the pivotal quantity (not the net pivotal quantity) of energy must be accepted from the supplier. Different from a pivotal supplier, a net pivotal supplier has very strong incentive to exercise unilateral market power the larger is the net pivotal quantity because . it earns the short-term price on its net sales at the market-clearing price,
33
To summarize, a supplier can be pivotal and therefore have a significant ability to raise short-term prices. However, this supplier has little incentive to exploit its pivotal status if its fixed-price forward market obligations exceed its pivotal quantity, i.e., it is not net pivotal. Conversely, if a supplier is net pivotal, then it is also pivotal and has both a substantial incentive and ability to exercise unilateral market power. This incentive to exercise unilateral market power is greater the larger is the supplier’s net pivotal quantity.
Price
Figure 2.23: Definition of Pivotal Supplier and Pivotal Quantity DR(p)
SOj(p)
DR(pmax)
QD MC
Pivotal quantity
Quantity
It is important to emphasize that a supplier cannot determine whether it is pivotal or net pivotal until the level of demand is realized and all supply offers of its competitors are known. Because the market rules require all suppliers to submit their offers at the same time, and the market demand is not known when these offers are submitted, no supplier knows with certainty if it is pivotal when it submits its offers. However, the same factors described above that help a supplier learn the distribution of residual demand curves that it will face also help the supplier predict when it might be pivotal. For example, an unexpectedly high level of demand or a large generation or transmission outage can create system conditions when one or more suppliers are pivotal.
2.5. Determinants of the Duration of the Exercise of Unilateral Market Power in Wholesale Electricity Markets One outstanding question from the above discussion is: what determines the length of time a supplier has the ability and incentive to exercise unilateral market power? There are many factors that limit the ability and incentive of suppliers to exercise unilateral market power. The 34
resulting high prices can stimulate: (1) generation unit owners to supply more energy from existing generation units, (2) retail consumers to reduce their demand for electricity, and (3) new entrants and existing participants to build new generation capacity. All of these responses have their strengths and weaknesses in dealing with the problem of unilateral market power in the short-term market. If there are a number of existing generation units off-line, then a high short-term price can cause their owners to bring these units back on-line and offer them into the short-term market, which increases the elasticity of the residual demand curve that all suppliers face. However, if all existing generation units are on-line and operating, then the limited increase in the output that is possible from these generation units is unlikely to limit the ability of existing suppliers to exercise unilateral market power. If final consumers reduce their demand for electricity then this could significantly shift in the residual demand curves that all suppliers face, which limits the ability and incentive of suppliers to exercise unilateral market power. This reduction in demand may be the result of conservation campaigns, payments to industrial users to reduce their consumption, or emergency measures such as rolling blackouts. However, if the demand for electricity is still high despite the best efforts of consumers to reduce their consumption, the supplier will still have a significant ability to exercise unilateral market power. Even at this high level of demand, if a significant fraction of final electricity consumers are willing to alter their consumption in response to expectations about the ultimate half-hourly wholesale price, this can significantly flatten the residual demand curve that all suppliers face and significantly limit their ability to exercise unilateral market power. In the absence of a final demand for electricity that responds to the half-hourly wholesale price of electricity, the ultimate limiting factor for the exercise of unilateral market is new entry. High prices that reflect the exercise of unilateral market power may provide a signal to new entrants that it would be profitable to construct additional generation capacity. However, the entrant must determine whether these high prices are the result of the exercise of unilateral market power that would no longer be possible if they entered, or if these prices indicate a true need for additional generation capacity. If these high prices are the result of insufficient competition among existing suppliers, rather than a signal of insufficient generation capacity to meet future demand, then a new entrant selling only in the short-term market may not risk entry because it may expect that after it enters and begins operation, market prices will fall to a level that does not allow it to recover its costs. In contrast, if the high prices are a valid signal of the need for additional generation capacity to meet demand, then a new entrant selling into the short-term market can be more confident that the prices it will sell its output at are sufficient to recover its production costs. The problem of a new entrant being deterred by the possible fall in short-term prices after it enters can be addressed by this entrant signing a fixed-price long-term contract with a retailer or large consumers to guarantee its revenue stream. In a market with retailers that own less generation capacity than their retail load obligations, if these retailers are being subject to the exercise of unilateral market power in short-term wholesale market purchases, they should be 35
willing to sign such a fixed-price forward contract with a new entrant at a price below the current short-term price that reflects the exercise of unilateral market power. It is important to emphasize that the ability of new entry to discipline the exercise of market power is limited by the fact that in virtually all electricity markets around the world it takes at least two years to site, permit, construct and bring on-line a sizable new fossil fuel generation unit. In many markets, it can take even longer. Therefore, by the above logic, the maximum time that existing suppliers can exercise unilateral market power is limited by the length of time that it takes for significant new entry to occur. Consequently, in markets where there are many generation options for new entrants, and the time lag between conception and operation is short, the length of time a supplier can exercise unilateral market power is short. However, in a market such as Colombia where suppliers have limited generation technology options because of, for example, the difficulties in gaining access to additional natural gas suppliers and the long time lag between conception and operation of large hydroelectric facilities, the exercise of unilateral market power can persist for a much longer time. The fact that El Nino events in Colombia can severely limit water availability for a sustained period of time increases the likelihood that when suppliers have a substantial ability and incentive to exercise unilateral market power large wealth transfers from consumers to producers will occur. During a period of significant unilateral market power in the short-term market, retail customers could limit the incentive of suppliers to exercise such market power by increasing their purchases of fixed-price forward market obligations from the suppliers that are long in the short-term market. By the logic described in Section 2.3, these suppliers would then find it expected profit-maximizing to submit offer curves closer to their marginal cost curves and therefore set short-term prices closer to the marginal cost of the highest cost unit operating during that half-hour period. However, these forward market purchases would not come without a cost because the suppliers selling them know that they would be giving up the opportunity to exercise substantial unilateral market power in the short-term market, and would therefore only be willing to do so if the forward market price compensated them for the market power they expect to be exercised in the short-term market for the duration of the fixed-price long-term contract. An example from the winter of 2001 in the California electricity market is instructive. As documented in both Borenstein, Bushnell, and Wolak (2002) and Wolak (2003a), suppliers to the short-term market in California exercised substantial unilateral market power during the summer of 2000. This continued into the autumn of 2000 until the late spring of 2001. Consequently, during the winter of 2001 when the state of California attempted to purchase fixed-price forward contracts starting “deliveries” in the summer of 2001, existing suppliers knew that they did not face significant competition from new suppliers for energy until the summer of 2003. The combination of known low water levels for the summer of 2001 and little competition from new sources of supply to California meant that existing suppliers knew as of the late winter and early spring of 2001 that they could expect to sell their energy at prices that reflected the exercise of substantial unilateral market power in the short-term market during the summer of 2001. Consequently, as Wolak (2003b) notes, quotes for summer 2001 electricity in California during the late winter of 2001 were in the US$300/MWh range. 36
This price represented suppliers’ expectations of average short-term energy prices during the summer of 2001 as of the late winter and early spring of 2001. For the same reason that an expected profit-maximizing supplier that has the prospect of selling energy in the real-time market at US$100/MWh is unwilling to offer supply into the day-ahead market at anything less than US$100/MWh, a supplier that expects to sell power in the short-term market during the summer of 2001 for an average price of US$300/MWh is unwilling to sell a fixed-price forward contract for energy during the summer of 2001 at less than US$300/MWh. Consequently, at time horizons shorter than those necessary to allow a substantial amount of new entrants to compete to supply fixed-price forward contracts, existing suppliers are able to capture the market power they expect to be exercised in the short-term market in the fixed-price forward contracts they sell for that time period. Similar logic applies to the prices offered by suppliers during the late winter of 2001 for fixed-price forward contracts to provide energy during the summer of 2002. At this time horizon to delivery there was more uncertainty about future hydrological conditions in California and the Pacific Northwest. This fact meant there were more potential sources of supply to compete to provide electricity at that time horizon to delivery. However, it was still not possible to site, construct, and bring on line a substantial amount of new generation capacity in California between the spring of 2001 and the summer of 2002. For these reasons, existing suppliers still expected, as of the spring of 2001, that a significant amount of unilateral market power would be exercised in the short-term market during the summer of 2002. Thus, as Wolak (2003b) notes, the price of summer 2002 energy in California at this time was in the neighborhood of US$150/MWh. Because it was possible to site, construct, and bring on line a substantial amount of new generation capacity to supply electricity to California between the spring of 2001 and the summer of 2003, suppliers did not expect during the spring of 2001 that a significant amount of unilateral market power would be exercised in the short-term market during the summer of 2003. For this reason, it was possible to purchase summer of 2003 electricity in California for approximately US$45/MWh. For the same reason, electricity to be “delivered” during the summers beyond 2003 sold for approximately the same price. The above discussion provides a stark illustration of the choices facing final consumers when system conditions arise, exogenously or through the actions of some market participants, to allow suppliers to exercise substantial unilateral market power in the short-term market. These customers either pay prices that reflect the exercise of unilateral market power on the short-term market, or purchase fixed-price forward contract obligations (that subsequently reduce the ability and incentive of suppliers to exercise unilateral market power) at prices that reflect the market power that these suppliers expect to give up by selling these fixed-price forward market obligations. In short, the suppliers can either pay for the market power in the short-term market or pay for this market power on an “installment plan” in the fixed-price forward contracts they sign. This logic also demonstrates that retailers and final consumers can avoid paying prices that reflect expectations about the amount of unilateral market power that will be exercised in the 37
short-term market by purchasing fixed-price long-term contracts far enough in advance of delivery to allow new entrants to compete to sell this energy. At this time horizon to delivery, customers can be reasonably assured of paying a price that does not reflect the exercise of unilateral market power. With the amount of advance notice needed for new entrants to site, permit, construct and bring on line a new generation unit, retailers and large consumers would be assured of being able to purchase fixed-price forward contracts at prices that reflect substantial competition between potential new suppliers and existing suppliers of electricity. In this way, market participants could take the appropriate precautions against the prospect of extremely high short-term prices at some future date, without having to pay forward contract prices that reflect the unilateral market power suppliers expect to be exercised in the short-term market during the delivery horizon. Market participants that signed fixed-price long-term forward contracts during the winter and spring of 2001 in California were not so fortunate. As noted in Wolak (2003b), these market participants had to pay for the market power that suppliers expected to be exercised during the summers of 2001 and 2002 in the prices that they paid for fixed-price forward contracts of up to ten years in duration. By agreeing to a much higher price than US$45/MWh during all years of the contract, these purchasers were able to obtain a fixed-price for the entire duration of the eight to ten-year contract that was significantly less than the forward price of electricity in California during the summers of 2001 and 2002. In this way, entities that signed long-term contracts during the winter and spring of 2001 paid for the market power that suppliers expected to be exercised in the short-term market during the summers of 2001 and 2002 on the installment plan by agreeing to pay prices significantly above US$45/MWh for all years of the contract. It is important to emphasize that the forward contract prices that an existing supplier to the California market was willing to sell energy for during the summers of 2001 and 2002 did not reflect just the market power that that supplier alone expected to exercise in the short-term market, but the amount that this supplier expected would result from the combination of the independent actions of all existing suppliers to exercise their unilateral market power. Specifically, the amount of unilateral market power priced into the forward contracts that each supplier was willing to sell reflected the total (across all suppliers) amount of unilateral market power that each supplier expected to be exercised in the short-term market during that time period. Therefore, expectations about future short-term market power even impacts the price charged for fixed-price forward contracts by suppliers with no ability to exercise unilateral market power in the short-term market. These suppliers can still expect to sell their output in the short-term market at price that reflects the amount of market power that will be exercised in the short-term market even though they have no ability to exercise unilateral market power. Therefore, they must be compensated for this in the price they charge for a fixed-price forward contract covering that time period. This logic suggests an extremely important role for public policy to ensure that independent retailers and large customers are not subject to substantial market power in their forward market purchases. The administrative and legal process to site, permit, construct and bring on line new generation units should be as transparent as possible, involve as many 38
generation technologies as possible, and require the minimum amount of time possible. Any deviations from these minimums could result in independent retailers and larger customers paying higher prices in both the long-term and short-term energy markets because of the market power that suppliers expect to be able to exercise. For example, if suppliers know that there are no viable large generation technologies that can enter and produce electricity within at least five years, then buyers of fixed-price forward contracts negotiated for delivery less than five years in advance will pay for the market power that existing suppliers expect to be exercised in the shortterm market during this time period. Consequently, the more technologies that are allowed to compete to supply energy and the shorter the time lag between conception of a new facility and production from this facility, the less likely independent retailers and larger consumers will have to pay for the exercise of unilateral market power for the fixed-price forward contracts they negotiate one to two years in advance of delivery. This logic has important implications for the discussion in Section 6 of the design of the MOR, the centralized market for standardized forward contracts proposed by the CREG. The discussion of the California experience also illustrates an important difference between hydroelectric-dominated markets and fossil-fuel dominated markets in the duration of the exercise of significant unilateral market power. Because few, if any, electricity markets in the industrialized world have insufficient capacity to meet demand, with a few exceptions the periods when suppliers have the ability to exercise significant unilateral market power in fossilfuel dominated systems are typically of short duration. That is because in most instances retailers and large consumers have purchased significant fixed-price forward contracts far enough in advance of delivery or policymakers have implemented “vesting contracts” at the start of the wholesale market regime to ensure that large suppliers have substantial fixed-price forward market obligations to final consumers. The periods of market power in a fossil-fuel dominated market typically arise when demand is unexpectedly high or certain generation or transmission facilities are temporarily unable to operate because of an outage. This often leaves one or more suppliers with a much greater exposure to the short-term market and they are able to increase their offer prices into the short-term market and still be accepted to supply energy as a result of the reduced competition due to the generation or transmission outage. However, once demand falls or the generation unit or transmission line comes back on line, these suppliers face greater competition and no longer have as great of an ability or incentive to raise prices in the short-term market. The case of a hydroelectric-dominated system is much different because once an energy shortfall occurs it is typically for the entire seasonal or annual hydro cycle. This is particularly the case for Colombia with the possibility of El Nino events. Once low hydro conditions arise, fossil-fuel suppliers now face less competition for their output because the hydroelectric suppliers are attempting to save their water by submitting steeper willingness-to-supply curves, which leaves fossil fuel suppliers with steeper residual demand curves. These residual demand curves unilaterally cause fossil fuel suppliers to submit higher offer prices for the same level of output because they have a greater ability and incentive to exercise unilateral market power. This implies that hydroelectric suppliers now face more inelastic residual demand curves and have a greater ability to exercise unilateral market power. Even hydro-electric suppliers with no ability to exercise unilateral market power must submit a higher offer price in response to the higher offer prices by the fossil fuel suppliers, if they do not want to use their water to produce 39
electricity. This leads to even higher prices and steeper residual demand curves faced by the fossil fuel suppliers, which further enhances their ability and incentive to exercise unilateral market power in the short-term market. System conditions that allow the exercise of unilateral market power can persist for a sustained period of time because, different from the case of a fossil fuel-dominated system, the cause of the reduction in available energy cannot be repaired and brought back on line. The amount of energy available to produce electricity is lower because the rate of water inflows is reduced relative to normal levels. There is little that can be done to correct this problem except hope that it rains or snows. This logic emphasizes the need for extremely high levels (relative to the level final electricity demand) of fixed-price forward contract obligations signed with suppliers far in advance of delivery in wholesale markets dominated by the production of hydroelectric energy, because once a unilateral market power problem arises in the short-term market because of the reduced availability of energy, there are few mechanisms available to market participants to address this problem in the short term besides reducing the demand for electricity. Only a sustained period of water inflows greater than water use can correct the problem, and there is little anyone can do to increase these water inflows. The distinction between hydro-dominated systems and fossil-fuel dominated systems also has implications for new entry decisions. In a hydro-dominated system with adequate generation capacity to serve demand, a potential new entrant considering whether to construct a fossil-fuel unit or other dispatchable unit (that does not use hydroelectric energy) in response to a period of high prices due to the sustained exercise of unilateral market power, must factor in the likelihood that when the unit comes on line water levels may be normal or high, which would imply wholesale prices that do not allow the entrant to recover its costs. For a fossil-fuel dominated system, a potential entrant is less worried that there will be a substantial amount of low-variablecost energy available to compete with its unit and drive energy prices below the level necessary to recover its costs when the unit begins operation, particularly if the new entrant is a combined cycle natural gas-fired (CCGT) generation with a low variable cost of production and the remaining units in the fossil-fuel dominated system are conventional steam turbine units. Thus, the need for an active market for fixed-price forward market obligations negotiated farther in advance of the time horizon necessary to bring on line a substantial amount of new generation capacity is much greater in a hydroelectric-dominated market. This logic can also be understood from a pure risk-management perspective. The risk of a supply shortfall due to insufficient water inflows is far greater than the risk of a supply shortfall in fossil fuel-dominated system. Additional fossil fuels can typically be purchased at a higher price, so preventing a supply shortfall in a fossil fuel-dominated system with adequate generation capacity is just a matter of the fuel price. In a hydroelectric-dominated system with adequate generation capacity, additional water cannot be purchased at any price. Therefore, one way to insure against the circumstance of a true shortage of electricity due to insufficient water or an artificial shortage due to the exercise of unilateral market power because water levels are lower than usual (but not too low that the annual electricity demand cannot be met), is for independent retailers and large consumers to sign a high level of fixed-price forward market obligations relative to their final demand.
40
If hydroelectric suppliers have a high level of fixed-price forward market obligations beyond the level of energy they expect, with a high degree of confidence, to produce from their own units, then they will have an incentive to manage this risk of a true supply shortfall by signing hedging arrangements with new and existing owners of fossil-fuel or other dispatchable generation units that do not rely on hydroelectric energy to ensure that demand can be met for all rates of water inflow. If independent retailers and large consumers sign fixed-price forward market obligations far in advance of delivery then there will be adequate time for the necessary fossil-fuel and dispatchable units to be constructed to ensure that a future true or artificial supply shortfall does not occur. As the above logic should make clear, it is no surprise that virtually all of the sustained periods of the exercise of unilateral market power in wholesale electricity markets have occurred in markets dominated by hydroelectric energy. The seasonal, stochastic, and uncontrollable rate of water inflows implies that once the circumstances arise that allow suppliers to exercise substantial unilateral market power, these conditions are difficult to reverse. Unless there are very high levels of fixed-price forward contract coverage of final demand, consumers can experience substantial harm from this exercise of unilateral market power. Moreover, unless they have high levels of fixed-price forward market obligations, suppliers have a strong incentive to exercise this unilateral market power when these system conditions arise. The prospect of future low electricity prices because water levels increase at a future date for hydroelectric suppliers can significantly dull the incentive for new entry in response to prices that reflect the exercise of substantial unilateral market power. This underscores the substantially greater need for high levels of fixed-price forward contract coverage of final demand signed farther in advance of delivery than the time horizon necessary to build and bring on line new generation capacity. Consequently, particularly in hydroelectric-dominated systems, it may make sense for policy-makers to intervene to ensure that there are high levels of fixedprice forward contract coverage of final demand to ensure that sustained periods of true or artificial scarcity due to the exercise of unilateral market power do not arise during periods when water levels are lower than normal.
3. Systemwide Market Power Issues This section uses the framework presented in Sections 2.2. and 2.3 to analyze several system-wide market power issues. The issue is how quantify the extent to which the pattern of prices of shown in Figure 1.1 is due to the exercise of unilateral market power or increases in fossil fuel input prices and the opportunity cost of water due to lower water storage levels. The second issue is whether providing suppliers with greater the flexibility in the offers they submit into the wholesale market will limit or enhance their ability to exercise unilateral market power. The third issue is what data collected and produced by the market operator should be released, when it should be released, and who it should be released to. The fourth system-wide market power issue is related to first because it is concerned with the question of giving suppliers more flexibility in offering in their willingness to provide automatic generation control (AGC) services. Currently, a supplier’s energy offer price is used both to determine how much energy it sells and the payment it receives for providing AGC services. A final system-wide market 41
power issue is how to allow co-generation units owned by large industrial and commercial customers to participate in the short-term wholesale market.
3.1. Measuring the Extent of Market Power Exercised in the Wholesale Market The theoretical framework presented in Section 2 demonstrates that if all of the residual demand curve realizations that a supplier faces are infinitely elastic, it has no ability to exercise unilateral market power. Therefore, this supplier submits it opportunity cost of producing electricity from each generation unit that it owns as its offer curve because the supplier knows that any attempt to raise the market-clearing price by raising its offer price or reducing its offer quantity will only result in it selling less energy, with no change in the market-clearing price. This logic suggests a methodology for determining the extent to which the observed pattern of prices in Figure 1.1 is due to the exercise of market power by suppliers. Using the insight of Section 2 that a supplier with no ability to exercise unilateral market power submits its aggregate marginal cost function as its offer curve provides a way to compute a counterfactual, no market power, market-clearing price to compare to the actual market clearing price and determine the extent to which actual prices are due to higher input fuel prices and other input cost changes or the exercise of unilateral market power. Borenstein, Bushnell, and Wolak (2002) present a methodology for computing this no market power market-clearing price, what they call the competitive benchmark price, and apply it to the California market over the period June 1998 to October 2000. The authors find significant differences between actual market-clearing prices and the competitive benchmark price during the period June 2000 to October 2000, which is consistent much of the enormous increase in wholesale electricity prices during this time period being due to the exercise of unilateral market power by the large fossil fuel suppliers in California. Figure 3.1 provides a stylized graphic description of computation of the actual price and the competitive benchmark price for a single hour. The upper line is the actual aggregate willingness-to-supply curve for that hour, , which is the horizontal sum of the actual offer , is graphed as a vertical line and the curves of all suppliers. The actual level of demand, intersection of this line with the actual aggregate willingness-to-supply curve, , yields the , point , the actual market-clearing price and quantity pair. The lower line is the competitive benchmark aggregate willingness-to-supply curve, , which is equal to the aggregate of the marginal cost curves of all generation units in the wholesale market. The , and the intersection of the competitive benchmark aggregate willingness-to-supply curve, actual level of demand, , is the market price that would result if no supplier had the ability to exercise unilateral market power, . Note that this competitive benchmark price is also equal to the marginal cost of the highest cost generation unit necessary to meet demand. The computation of the competitive benchmark price allows a decomposition of total wholesale market revenues into: (1) market power rents, (2) competitive market rents, and (3) total variable cost of product. Multiplying the actual price by the actual level of demand, , gives the total generation revenues earned by all suppliers during that hour. This is represented by the entire shaded region in Figure 3.2. This figure shows how these total generation revenues can be divided into the three distinct magnitudes. The market power rents 42
that result from suppliers in the wholesale market exercising unilateral market power is defined as the difference between the actual market price, , and the competitive benchmark price, , times the actual market demand, . The region under the counterfactual aggregate willingness, is the total variable cost of supplying the electricity dispatched. The area to-supply curve and below , is the above the counterfactual aggregate willingness-to-supply curve competitive market rents earned by generators during the period. The Borenstein, Bushnell and Wolak (2002) methodology requires data on the technical characteristics of each generation unit in the system, specifically, its capacity, heat rate, input fuel, forced and planned outage rates, and an estimate of its variable operating and maintenance cost. For fossil fuel-fired generation units, this information can be combined with information on the price of the input fossil fuel for the unit to compute an estimate of the marginal cost of the generation unit, which is the-no-ability-to-exercise-market-power offer curve of a fossil fuel generation unit owner. However, constructing a no-market power offer curve for hydroelectric generation unit owners is a considerably more complex task. Fortunately, there are several relatively straightforward methodologies that yield a slack upper bound on a hydroelectric generation unit owner’s no-market-power willingness to offer curve. Borenstein, Bushnell, and Wolak (2002) implement one of these approaches for their analysis of the California market where a significant amount of energy produced in the state and virtually all of the imports from the Pacific Northwest are from hydroelectric sources. When computing the no-market power opportunity cost of producing electricity for a hydroelectric supplier it is very important to avoid including the rents from exercising unilateral market power in a future period as an opportunity cost of a hydroelectric supplier in the current period. All of these methodologies are designed to compute upward biased estimates of the counterfactual no-market power wholesale market prices which imply downward biased estimates of the cost of the exercise of unilateral market power. We emphasize that the market power rents computed using the difference between the actual and competitive benchmark price are measured at the wholesale market level. The extent to which these higher wholesale prices are passed on to a vertically-integrated supplier’s own retail customers, or indirectly to other retail customers, is not addressed by this methodology. It is important to emphasize that the competitive benchmark price is not a measure of the profitability of individual generation units. Specifically, selling electricity at the competitive benchmark price could earn certain units large variable profits that far exceed the opportunity cost of funds invested in the project, and earn other units variable profits that are insufficient to recover the going-forward fixed costs necessary to continue operation. In addition, competitive benchmark prices provide no guarantee that unit owners will earn as much profits as they or their shareholders would like. The true test of whether a generation unit owner is earning sufficient revenues to recover the opportunity cost of funds invested is whether they are willing to remain in business and willing to sign long-term supply arrangements with other market participants and retail customers. The discussion in Section 1 surrounding Figures 1.1 to 1.3 which characterize the time series behavior of short-term electricity prices, water levels, natural gas prices and the difference between total available capacity and system demand suggest that such an analysis would be 43
worthwhile, because input fossil fuel price changes do appear to part of the reason for the pattern of electricity prices over the past seven months, but not the entire reason.
3.2. The Market Efficiency Benefits and Costs of Offer Curve Flexibility Relative to other wholesale markets operating around the world, the Colombian market rules significantly restrict the flexibility of the offer curves that suppliers can submit. This lack of flexibility in the offer curves that suppliers can submit has implications for the ability of suppliers to exercise unilateral market power and the pattern of wholesale prices throughout the day. Most other markets in the world specify a maximum number of quantity and price steps each generation unit owner can submit in its offer curve. For example, in the Australian wholesale electricity market suppliers are able to submit a maximum of ten price and quantity steps for each generation unit, rather than a single price and quantity pair, as is the case in Colombia. Similar to the case of Colombia, each price step is fixed for the entire day, but suppliers can vary the size of each quantity step across half-hours the day, the length of the pricing periods in the Australian market. The New Zealand wholesale electricity market further increases the flexibility of generation unit owners by allowing them to change both the offer prices and offer quantities each half-hour of the day. There are two competing goals that must be balanced in setting the degree of flexibility across hours of the day in the offer curves that suppliers are allowed to submit. First, suppliers should have sufficient flexibility to express the form of their variable cost function in the offer curves they submit. However, too much flexibility in the offer curves that suppliers can submit allows them to tailor their offer curve during each pricing period to maximize the profits they receive from selling their output. Returning to the discussion in Section 2 surrounding Figures 2.16 and 2.17, the greater the flexibility that suppliers have in the offer curves that they can submit, the more likely it is that they can construct and offer curves that set the ex post profitmaximizing price and quantity pair for each possible residual demand curve realizations. This result follows from the fact that for a the same distribution of the residual demand curve realizations, providing a supplier with more offer curve parameters allows that supplier to increase the expected profits it will earn relative to the case that it has less flexibility in the number of offer curve parameters it is allowed to submit. The supplier can always first replicate the expected profits that it could obtain with less flexibility, and then use the additional flexibility to increase its expected profits beyond that level. This logic would always favor restricting the flexibility of the offer curves that suppliers are able to submit. However, it ignores the fact that a supplier knows that its competitors have a greater ability to undermine its attempts to exercise unilateral market power if they have more flexibility in the offer curves that they can submit. For example, under the Colombian market rules a supplier knows that it must keep its single price offer fixed for the entire day. This supplier will therefore be less likely to set a low value in order to sell more in a lower demand period of the day, because it knows that this offer price can also be used to increase the marketclearing price during a higher demand period of the day. In contrast, if a supplier can change its offer prices across hours of the day, then it would be more likely to set a lower price during lower demand period of the day in order to sell more output and earn higher profits. 44
Price
Figure 3.1: Measurement of the Cost of Unilateral Market Power, Part I SA(p)
PA
SC(p) PC
QA
Price
Figure 3.2: Measurement of the Cost of Unilateral Market Power, Part II SA(p)
PA Market power rents
SC(p)
PC rents Aggregate marginal cost QA
45
A supplier’s attempts to raise prices during the higher demand periods of the day by setting a higher offer price could be foiled by the greater bid flexibility given to its competitors. These competitors have more offer curve parameters to use to undermine the attempts of this supplier to raise market-clearing prices. In summary, granting greater offer curve flexibility to supplier provides each supplier with a greater ability to maximize profits given a fixed distribution of residual demand curves. However, this greater offer curve flexibility could significantly alter the distribution of residual demand curves that each supplier faces so that they face a more elastic distribution of residual demand curves and therefore have less of an ability to exercise unilateral market power. The argument that granting greater bid flexibility increases the elasticity of the residual demand curve distribution that a supplier faces is even stronger in a system dominated by hydroelectric energy like Colombia. Hydroelectric suppliers typically have a reservoir of water and must decide when to convert that water to electricity subject to the constraints that they do not want to run out of water of spill water from their reservoir. By requiring the hydroelectric supplier to submit a single offer price for all of their water in the same hydro chain can cause them not to supply as much electricity during the off-peak hours of the day in order to ensure that they do not sell too much during the peak hours of the day. Giving these suppliers greater offer curve flexibility can allow them to better manage their water use during the day. Currently, the only way a hydroelectric supplier in Colombia can manage the amount of electricity produced from its hydroelectric units is through the hourly capacity offer that it declares for each generation unit. By giving these suppliers the ability to submit more price and quantity increments for each generation unit and change the offer prices for some of these price and quantity increments across hours of the day, hydroelectric suppliers have a greater ability to manage their water use throughout the day. In addition, this greater offer curve flexibility gives the supplier more opportunities to alter its hourly offer curve in order to undermine the attempts of its competitors to exercise unilateral market power. As long as high levels of fixed-price forward contract coverage of final electricity demand negotiated far enough in advance of the delivery date of the electricity to allow new entrants to compete to supply this electricity exist in the Colombian market, it is worthwhile to consider increasing the amount of offer curve flexibility that suppliers are granted. A possible first step would be to increase the number of price and quantity steps for each generation units from one to two to three price increments per generation unit with the quantity increments associated with each price increment varying on an hourly basis. Suppliers could also be permitted to make two to three changes in the values of the three price increments each day. For example, a unit owner could choice three price offers for each 8-hour period of the day. There would be three early morning offer prices, three mid-day price offers, and three evening and night-time price offers. Another reason to increase the number of price and quantity increments a generation unit owner can submit is to reduce the strategic value of owning multiple generation units. Under the current Colombian market rules, the only way for a supplier to be able to submit an upward sloping willingness-to-supply curve with many steps is if it owns multiple generation units. Consequently, a small supplier is disadvantaged relative to a large supplier in the flexibility of 46
the offer curves that it can subm mit. By increaasing the nuumber of pricce steps each generationn unit can subm mit, small su uppliers are placed p at lesss of strategiic disadvanttage relative to large firm ms in the offerr curves thaat they can submit. An additionall potential benefit b of allowing a a larger l number of price steeps for eachh generationn unit is thhat the residdual demandd curves thaat all h more stteps, particuularly aroundd the expectted market clearing-pric c ce for supplierss face will have that hourr. This implies that all suppliers s willl now face smoother s ressidual demannd curves arround the markket-clearing price p which reduces the likelihood of o that supplier will be able a to impleement large pricce increases from withhoolding smalll amounts off generation capacity. c Inn closing this section, it is importantt emphasize that increasiing the flexibbility of the offer curves thhat supplierss are allowedd to submit is i likely to produce, p at most, m a moddest improveement in short-tterm wholesale market performance p . Figure 3.33 illustrates the t sort of chhange in the daily pattern of o average ho ourly prices that is likelly to occur. A hypothettical averagee daily patteern of hourly prrices with th he existing leevel of bid flexibility f is plotted in thhe figure. Each E point on o the hypothetical curve iss the average over all daays in the yeear of the prrice for that hour of thee day. This patttern of pricess shows smaall differencees in average prices acrooss the low and a high dem mand hours of the day beccause of the reluctance (described ( eaarlier) of supppliers to suubmit a low offer price for the entire daay. The morre concave pattern p of average hourlyy prices throughout the day d is what is likely l to resu ult from prooviding greatter offer currve flexibilitty. Supplierrs may be abble to raise pricces more durring the peakk hours of thhe day, but the t greater offer curve fllexibility is likely l to cause them to com mpete vigoroously and set lower averrage prices during d the loow demand hours h nding on thhe pattern of hourly deemand throuughout the day, d the quaantity of the daay. Depen weightedd average prrice with grreater offer curve flexibbility could be lower thhan the quanntityweightedd average priice with currrent level of offer flexibiility. F Figure 3.3: Offer Curvve Flexibilityy and Averaage Prices Throughout T t the Day
47
3.3. Information Release and the Exercise of Market Power There are many market efficiency arguments in favor of the immediate (or with a short time lag) public release of all data submitted to the market and system operator necessary to operate the system and all data produced by the market and system operator. A common argument often made against the immediate release of data is that this makes it more difficult for suppliers to engage in tacit collusion. However, as I discuss below, there are a number of shortcomings associated with this argument that lead me to discount it relative to the market efficiency benefits from immediate full data release. The remainder of this section outlines the arguments for immediate data release. I describe precisely what data should be released and what entities it should be released to. I then assess the arguments against immediate data release and find that although these arguments have theoretical validity there is little, if any credible evidence of their empirical relevance or their direct applicability to the electricity supply industry. Finally, I recommend additional data collection efforts that should be undertaken by the market and system operator. 3.3.1. The role of smart sunshine regulation in improving market efficiency A minimal requirement of any industry-specific regulatory process is to provide “smart sunshine” regulation where the regulator is able to take that data that it has access to and present it to market participants and the public in a manner that clearly identifies the successes, failures and shortcomings in the existing wholesale market design. This data analysis should also point out directions for improvement in the existing market rules. A final role for smart sunshine regulation is to shine the light of public scrutiny on market participant behavior that may be at boundary of what the regulator deems is acceptable. As I discuss in Section 5, there is rarely a bright line between the legal of exercise of unilateral market power and the abuse market power or market manipulation. Knowledge that their behavior can be immediately and transparently observed by the public through the preparation of accessible analyses of this data is likely to be the best way to cause market participants not to test the boundaries of acceptable behavior. A necessary condition for effective smart sunshine regulation is that the regulator has access to all information needed to operate the market and be able to perform analyses of this data and release the results to the public. At the most basic level, the regulator should be able to replicate market-clearing prices and quantities given the bids submitted by market participants, total demand and other information about system conditions to ensure that the market is operated in a manner consistent with what is written in the market rules. A second aspect of “smart sunshine regulation” is public data release. Specifically, all data submitted to short-term market and produced by the system operator should be immediately released to the public. In Colombia, all retailers are required to have high levels of fixed-price forward coverage of their final demand, so little, if any, sales of energy to final consumers should take place through the shortterm market. This implies that the short-term market is operated primarily for reliability reasons and all market participants have a common interest in the reliability of the transmission network, and immediate data release best serves these reliability interests. There should be no limitation on the regulator’s access to data either submitted to the system operator by market participants or produced by the system operator. Besides all of the 48
information needed to operate the energy and operating reserves markets and the transmission network, the regulator should also have the ability to request information from market participants on a confidential basis to perform further analyses. Rather than have ex ante limitation on the type of data it can request, the regulator should have open-ended authority to request information from market participants subject to an economic cost-benefit test. To enforce this authority, the regulator should also have the ability to penalize market participants for failing to provide the requested data in a reasonable period of time. 3.3.2. Public release of data and market efficiency The wholesale markets that currently exist around the world differ considerably in terms of amount of data they make publicly available and the time lag between the date the data is created and the date it is released to the public. Nevertheless, among the industrialized countries there appears to be a positive correlation between the extent to which data submitted or produced by the system operator is made publicly available and how well the wholesale market performs. The Australian electricity market makes all data on bids and unit-level dispatch publicly available the next day. Australia’s National Electricity Market Management Company (NEMMCO) posts this information by market participant name on its website. The Australian electricity market is generally acknowledged to be one of the best performing re-structured electricity markets in the world. On the other hand, the former England and Wales electricity pool kept all of the unit-level bid and production data confidential. Only members of the pool could gain access to this data. It was generally acknowledged as one of the poorer performing electricity markets in the world. The UK government’s displeasure with pool prices eventually led to the New Electricity Trading Arrangements (NETA) which began operation on March 27, 2001. Although these facts do not provide definitive proof that rapid and complete data release enhances market efficiency, the best available information on this issue provides no evidence that withholding this data from the public scrutiny enhances market efficiency. To enhance its value in smart sunshine regulation, public data release should identify the market participant and specific generation unit associated with each bid, generation schedule, or output level. Masking the identity of the market participants, as is done in all US wholesale markets, severely limits the disciplining value of public data release in causing market participants not to test the boundaries of acceptable behavior. Under a system of masked data release, market participants can always deny that they are the ones engaging in the more questionable behavior. The primary value of public data release is that it puts all market participants at risk for explaining their behavior to the public. In all US markets, the very long time lag between the date the data is produced and the date it is released to the public, at least six months, and the fact that the data is released without identifying the specific market participants virtually eliminates much of the potential benefit of public data release. Putting market participants at risk for explaining their behavior to the public is different from requiring them to behave in a manner that it is inconsistent with their unilateral profitmaximizing interests. A number of markets have considered implementing “good behavior conditions” on market participants. The most well-known attempt was the United Kingdom’s (UK) consideration of a Market Abuse License Condition (MALC) as a pre-condition for participating in the wholesale electricity market. The fundamental problem with these “good 49
behavior” clauses is that they prohibit suppliers from engaging in behavior that is in their unilateral profit-maximizing interests that can also often be in the interests of consumers. These “good behavior” clauses do not correct the underlying market design flaw or implement a change in the market structure to address the underlying cause of the harm from the unilateral exercise of market power. They simply ask that the firm be a “good citizen” and not serve the interests of their shareholders by maximizing profits, which can create substantial conflicts of interest for the firm’s managers. For the case of the UK, the MALC anticipated punishing those market participants that exercised significant amounts of unilateral market power. However, one difficulty with this approach is that typically the greatest beneficiaries of the unilateral exercise of market power are the firms that have no ability to exercise unilateral market power. A firm that is supplying all that it is able to produce a price that is elevated by several large suppliers exercising unilateral market power earns substantial profits, whereas the firms exercising unilateral market power sell less output than they would if they were not exercising unilateral market power. One could therefore imagine some firms finding ways to compensate other firms for exercising their unilateral market power so that they can reap greater benefits from these actions. A second difficulty is distinguishing the exercise of significant market power worthy of punishment from expected profit-maximizing behavior. In testimony to the United Kingdom Competition, Wolak (2000) made these and a number of other arguments against the MALC, which the UK Competition Commission eventually decided not to implement. Another potential benefit associated with public data release is that it enables third-parties to undertake analyses of market performance. The US policies on data release also severely limit the benefits to this aspect of a public data release policy. Releasing the data with the identities of the market participant masked makes it impossible to definitively match data from other sources to specific market participants. For example, some market performance measures require matching data on generation unit-level heat rates or input fuel prices obtained from other sources to specific generation units. Strictly speaking, this is impossible to do if the unit name or market participant name is not matched with the generation units. Another benefit of immediate public data release is that it lowers the barriers to new entry into the industry. There are many alternative ways to obtain this data or close substitutes for it that are available to large firms with the resources to purchase or collect it. For example, in the United States, there are third parties that collect secondary market information through surveys of market participants. These entities then sell this information or summaries of it. The large firms can afford to pay the prices that these firms charge, whereas smaller firms may be priced out of the market. Consequently, a clear downside to limiting the release of data is that the smaller firms and new entrants are at a greater information disadvantage relative to larger firms, which is unlikely to enhance the competitiveness of wholesale market outcomes. It is important to emphasize that it is not illegal under competition law virtually countries for market participants to discuss trading strategies or even the form of the offer curves they submit to the short-term market. Suppliers can even explicitly share information this kind of information after the market has operated. Many industry associations in the United States serve this role by gathering information from market participants and then making it available only to 50
their members. Prohibiting public data release only increases the benefits that market participants receive from forming industry associations. Another way that market participants can learn about their competitors’ likely actions is to hire an employee. In the United States, there is a considerable amount of across-company mobility of employees. The essential point of this discussion is that if a market participant would like to learn something about its competitors’ offers, production costs, or output levels, it is possible to obtain it. The only question is how much it costs to collect it and this favors the large firms relative to the small firms and prospective entrants. The long time lag between date the data is produced and the date it is released also greatly limits the range of questions that can be addressed with the data. Taking the example of the California electricity crisis, by January 1, 2001, the date that masked data from June of 2000 was first made available to the public, the exercise of unilateral market power in California had already resulted in more than $5 billion in overpayments to suppliers in the California electricity market as measured by Borenstein, Bushnell, and Wolak (2002). A rigorous analysis of the performance of the California market that was subjected to public scrutiny could not be undertaken until then. Consequently, a long time lag between the date the data is produced and the date it is released to the public has an enormous potential cost to consumers that should be balanced against the benefits of delaying data release. This sequence of events could happen in Colombia if an El Nino event occurred that greatly enhanced the ability of suppliers to exercise unilateral market power. If public data release was delayed, substantial wealth transfers from consumers to producers could occur before the events in the market could be rigorously analyzed and subjected to public scrutiny. 3.3.3. Who should have what data and when they should have it An important aspect of the public data release question is the distinction between data that the regulator can request and receive from market participants and data that must be released to the public. There is a natural boundary between these two types of data. Any data that the system operator must request from market participants or must produce in order to operate the short-term market should be released to the public. This is consistent with the role of the shortterm market as mechanism for suppliers and retailers to buy and sell imbalances relative to their forward market positions. Information about a market participant that is unnecessary to operate the real-time market yet may impact the bidding, scheduling or production behavior of that market participant should not be released to the public. A prime example of this sort of information is the forward contract position of a supplier. As discussed in Section 2, the forward market obligations of a supplier can impact its bidding, scheduling and operating behavior. However, knowledge of this type of information is not needed by the system operator to operate the short-term market. In addition, because of the fundamentally financial nature of forward market transactions sold by electricity suppliers, it is very difficult to get accurate information on the true forward market position of electricity suppliers. Suppliers can re-trade forward market obligations among themselves to yield forward market positions far above or below their expected production of electricity. A number of 51
studies of electricity trading in the US before by Enron meltdown in late 2001 estimated that each electron ultimately delivered through a US wholesale electricity market was bought and sold in forward markets more than five times. For this reason, even if the regulator attempted to collect this forward market data from suppliers on a regular basis it would not be very useful. For example, if the regulator specified a minimum quantity of forward contract sales for each supplier it regulated, these suppliers could undertake forward contract transactions with affiliates not subject to regulatory oversight to meet these minimums. Moreover, those affiliates not subject to oversight by the regulator could then re-construct their holding company’s desired forward contract holdings. Consequently, routinely collecting the forward contract positions of suppliers could cause them to render this information of little or no use to the regulator through these sorts of affiliate transactions. Even if firm-level information on fixed-price forward contract obligations is collected, there is a strong argument for not disclosing firm-level forward contract positions immediately. Only if a supplier is confident that it will produce more than its fixed-price forward contract obligations will it have an incentive to take actions to raise the market price. Suppliers recognize this incentive created by forward contracts when they bid against competitors with fixed-price forward contract holdings. Consequently, public disclosure of the forward contract holdings of market participants can convey useful information about the incentives of individual suppliers to raise market price in both bid-based and cost-based markets, with no countervailing system reliability or short-term market-efficiency enhancing benefits. In this regard, the experience of California is instructive. The lack of long-term contracts between California electricity suppliers and the three load-serving entities in California—Pacific Gas and Electric, Southern California Edison, and San Diego Gas and Electric—was public information. Consequently, all suppliers knew that all other suppliers to California had virtually no fixed-price forward contract obligations to the three large California retailers. This meant that each supplier knew that all of the other suppliers were net sellers of electricity at even very low levels of output from their generation units. Therefore, without any implicit or explicit communication, all suppliers could be confident that all other suppliers would find outputwithholding strategies unilaterally profitable. If the three large California retailers had had significant forward contract obligations from a number of suppliers and the size of their forward contract holdings from each supplier was private information, then no supplier would know the levels of output at which other suppliers are long relative to their forward contract positions. Consequently, keeping forward contract positions confidential can have a beneficial impact on the competitiveness of spot market outcomes, because no supplier knows the critical output levels beyond which other suppliers would like to raise the market price, which makes it more difficult to determine those systems conditions when all suppliers find withholding strategies unilaterally profit-maximizing. A simple example illustrates this point. Suppose there are five firms, each of which owns 100 MW of capacity. In a world without fixed-price forward contracts, all suppliers know that if demand is above 400 MW, then all firms are pivotal in the sense described in Section 2.4 if all other firms supply their maximum possible output. When demand is above 400 MW, all suppliers know that all other suppliers are pivotal, so all suppliers know that unilateral 52
withholding strategies are very profitable. For example, if demand is 450 MW, all suppliers know that at least half of their capacity is needed to meet demand regardless of how much their competitors supply. In contrast, if each of supplier has fixed-price forward contract obligations for 70 MW, then even at a demand of 450 MW, they should all bid very aggressively because each supplier knows that if it does not bid aggressively for at least 70 MW of its capacity it could end up having to meet some its forward market obligations through extremely expensive shortterm market purchases. Suppose that suppliers did not know the forward contract obligations of each their competitors, only the aggregate forward contract quantity, in this case 350 MW. This lack of information should cause some suppliers to put positive probability on the event that some of the remaining suppliers have more than the firm-level average forward contract coverage of 70 MW (= 350 MW divided by 5 Firms). A supplier that believes its competitors have more forward contract obligations would then bid more aggressively for at least 70 MW, its forward contract obligation, to guarantee that it sells at least that amount of energy in the spot market. This example demonstrates the disciplining effect of forward contracts on the spot market behavior of suppliers and the competition-enhancing benefits of uncertainty about the forward contract holdings of a supplier’s competitors. Although the forward contract positions of specific market participants should not be released to the public, the regulator should regularly collect information on the forward contract holdings of electricity retailers. The difference between the quantity of energy the retailer expects to sell (at a retail price that does not vary with the hourly wholesale price) and the retailer’s forward contract holdings is its exposure to short-term price risk. The regulator must monitor the short-term price risk exposure of each retailer because there is a substantial moral hazard problem in electricity retailing. Retailers can sign fixed-price supply commitments with customers and purchase the energy from the short-term market when short-term prices are low and earn high profit levels. To avoid large losses during periods of high short-term prices, the retailer can simply declare bankruptcy. Consequently, the regulator or market monitor must ensure that at all times the retailer has sufficient forward contract coverage for its retail load obligations so that it does not find it expected profit-maximizing to engage in such a high-risk strategy. The regulator must ensure that the retailer finds it expected profit-maximizing to meet its retail load obligations and remain in business during periods with high short-term prices, rather than declare bankruptcy. 3.3.4. Arguments against immediate public data release The usual argument against immediate data release is that suppliers could use this information to coordinate their actions to raise market prices through sophisticated tacit collusion schemes. Although the immediate availability of information on bids, schedules and actual unitlevel production could allow suppliers to design more complex state-dependent strategies for enforcing collusive market outcomes, it is important to bear in mind that coordinated actions to raise market prices are illegal under competition law in virtually all countries around the world. As noted above, it is not illegal for market participants to collect information necessary to enforce tacit collusion through industry association and other private communications.
53
The immediate availability of this data means that the public also has access to this information and can undertake studies examining whether coordinated actions, explicit or tacit, are occurring using this data. As noted earlier, explicit or implicit coordinated efforts to raise prices are unnecessary to raise wholesale electricity prices to levels that impose significant harm to electricity consumers. Therefore, another argument in favor of immediate public data release is that it increases the likelihood of detecting coordinated actions to raise market prices or helps to identify unilateral actions to raise market prices, because any entity could access this data and investigate the validity of their favorite hypothesis. Although the economics literature contains many theoretical models of tacit collusion, there is little, if any, credible empirical evidence that it has occurred in an actual market. This theoretical literature typically relies on the fact that suppliers are attempting to coordinate on a single price or quantity choice, not on a set of offer curves with 100’s of parameters, as it the case in wholesale electricity markets. An important feature of all the tacit collusion models in economic theory is that a supplier is able to verify with some degree of precision that its competitors have defected from the tacit collusive agreement. Detecting whether defection has occurred in complicated by a number of features of the electricity supply industry. The transmission network is subject to outages and de-rates that are beyond the control of generation owners that can significantly impact the price they are paid or the amount of output they sell. Generation unit owners submit extremely rich offer curves each day and individual generation units are subject to outages that are beyond their control, both of which impact the price they are paid or amount of output they sell. This logic provides another argument in favor of providing suppliers in Colombia with more flexibility in the offer curves they submit. This greater flexibility would provide more opportunities for suppliers to defect from a possible explicit or implicit collusive agreement. Coherent arguments in favor of masking the identity of market participants in the publicly released bid, schedule and production data are more difficult to find. Assuming that the concerns with public data release enhancing the ability of market participants to coordinate actions had been addressed, it is difficult to determine what market efficiency-enhancing benefit results from masking the identity market participants. As noted above, masking the identity of the market participant only limits the “sunshine regulation” value of public data release. 3.3.4. Forced and planned outage collection and reporting A final aspect of the data collection and release process is concerned with scheduled outage coordination and forced outage declarations. A major lesson from wholesale electricity markets around the world is the impossibility of determining whether a unit that is declared outof-service can actually operate. Different from the former vertically-integrated regime, declaring a “sick day” for a generation unit--saying that it is unable to operate when in reality it could safely operate--can be a very profitable way for a supplier to withhold capacity from the market in order to raise the wholesale price of electricity. To limit the ability of suppliers to use their planned and unplanned outage declarations in this manner, the market operator and market monitor must specify clear rules for determining a unit’s planned outage schedule and when a unit is forced out.
54
Before the start of each year, suppliers should submit to the system operator a schedule of planned outages for each of their units. The system operator would then compile the planned outage schedules submitted by all suppliers and verify that they do not compromise system reliability. If they do, then the system operator will suggest modifications to achieve a schedule of planned outages for all units consistent with reliable network operation on annual basis. Although the system operator should attempt to accommodate the wishes of each supplier, it must have ultimate authority on setting the final schedule for all planned outages. Once this planned outage schedule is set, it should be released to the public. Modifications of these unitlevel planned outages schedules during the year are subject to the approval of the system operator. These modifications should be released to the public once they are approved. A similar process should be followed for scheduling planned transmission line outages. The system operator should coordinate the planned transmission outage process with all of the transmission owners and the generation unit owners. It should also make the final decision on when both generation units and transmission lines can be taken out for maintenance. To deal with the issue of unplanned generation outages, the system operator should specify the following scheme for outage reporting. Unless a unit is declared available to operate up to its full capacity, the unit is declared fully out or partially out depending on the amount capacity from the unit offered into the market at any price at or below the current offer price cap. This definition of a forced outage eliminates the problem of determining whether a unit that does not offer into the market is actually able to operate. By definition, such a unit should be assumed to be forced out. The system operator should therefore count all capacity from a unit offered in at price at or below the offer price cap as the only capacity available. The remaining capacity of the unit should be defined as forced out. Information on unit-level forced outages according to this definition should be publicly disclosed each day on the system operator’s web-site. This information should also be collected by the regulator. This outage disclosure process cannot prevent a supplier from declaring a “sick day” to raise the price it receives for other energy it sells into the market. However, it can make it more costly for the market participant to do so by registering all hours when a unit does not bid into the market as forced outage hours. For example, if a 100 MW generation unit is neither bid nor scheduled in the spot market during an hour, then it is deemed to be forced out for that hour. If this unit only bids 40 MW of the 100 MW at or below the price or bid cap during an hour, then the remaining 60 MW is deemed to be forced out for than hour. The regulator can then periodically report forced outage rates based on this methodology and compare these outage rates to historical figures from these units before re-structuring or from comparable units from different wholesale markets. This is an example of where the smart sunshine regulation made possible by public data release can cause suppliers not to test the boundaries of acceptable behavior. If a generation unit owner persistently has substantially higher forced outages when it is profitable for these forced outages to occur, the availability of public data to compare across suppliers and reduce the likelihood that suppliers will use their forced outage declarations strategically.
55
It important to emphasize that best strategy for preventing “sick days” by a generation unit owner is making sure that it has a high level of fixed price forward market obligations relative to its expected production of energy. If the supplier has significantly less fixed-price forward market obligations relative to its expected sales in the short-term market, then it may find it profit-maximizing to declare forced outages to raise the price it receives for the energy it does produce. However, with a high level of fixed-price forward market obligations, the supplier has a strong incentive to avoid outages, because when an outage occurs it is likely to sell less energy in the short-term market than its fixed-price forward market obligations, so that high short-term prices implies less profits for the generation unit owner. The amount of capacity a generation unit owner can sell under the recently implemented reliability capacity charge in Colombia should be based on the capacity of the unit multiplied by the 12-month rolling average of the availability factor of the unit computed based on the forced and planned outage rates computed as described above. For example, if the 100 MW unit only offers its entire capacity into the market during half of the hours of the year and nothing in the remaining hours of the year, then it should only be allowed to sell 50 MW of capacity, because this is the average amount of capacity the unit provides to the market. A similar process should be followed for unplanned transmission line outages. The regulator should compile information on the hourly amount of available transmission capacity. As soon as outages or de-ratings occur, this information should be made publicly available. The market monitor should also compile the annual distribution of hourly transmission capacity availability and make this information publicly available. This information can also be used by the regulator and system operator to implement penalty and sanctions schemes for transmission owners that fail to maintain their transmission facilities in a manner consistent with good utility practice. Public disclosure of transmission outages ensures that if suppliers attempt to take advantage of their location in the transmission network to raise the price they are paid for their energy or operating reserves, this can be quickly detected. 3.3.5. Summary and concluding comments This section closes with a summary of the important aspects of the data collection and dissemination process. The regulator should have access to all data submitted to the system operator to run the market and operate the transmission network. This data should be released to the public, identifying the specific generation unit and owner of that generation unit. This data should be released as soon as possible subject to any concerns about rapid data release enhancing the ability of suppliers to coordinate their actions. For the reasons discussed above, I do not believe these concerns should preclude data release the day after actual market operation, as is the case for the National Electricity Market (NEM) in Australia. However, if there are concerns about immediate data release de-grading wholesale market performance, delay data release for one or two weeks should be more than sufficient to limit is usefulness in enforcing tacit collusion. The regulator should also have the ability to request and receive data subject to a costbenefit test. The regulator should collect information on the forward contract holdings of all electricity retailers to ensure that they are prudently managing their short-term risk. For the reasons discussed above, there is likely to be less value in regularly collecting forward contract data from suppliers. The regulator should collect information on the planned 56
outages of generation and transmission facilities throughout the control area and disseminate this information to the public immediately. The system operator should also keep a complete accounting of amount of generation capacity that does not bid into the market at or below the price cap on the spot market during any hour and the amount of transmission capacity that is available each hour. This information should also be disclosed to the public as soon as possible.
3.4. Using the Same Price Offer in Two Markets The Colombia market currently uses the same offer price for a generation unit to determine it sales in the energy market and in the market for automatic generation control (AGC). The discussion of the benefits and costs of offer curve flexibility in Section 3.2 provides the necessary economic theory background to understand the market efficiency tradeoffs in this market rule. The fact that the energy market uses a uniform-price auction and the AGC market uses a pay-as-bid auction ensures that this market rule cannot be optimal for the case that the supplier is unable to exercise unilateral market power in either market. The expected profit-maximizing offer price of a supplier with no ability to exercise unilateral market power in a uniform price auction is substantially different from the expected profit-maximizing offer price of this same supplier in a pay-as-bid auction. As shown in Section 2, an expected profit-maximizing supplier with no ability to exercise unilateral market power in a uniform-price auction would submit an offer price equal to its marginal cost of producing electricity, because a uniform price auction sets the price it is paid equal to the highest accepted offer price needed to meet demand. In contrast, a supplier with no ability to exercise unilateral market power in a pay-as-bid auction would not find it expected profit-maximizing to submit an offer price equal to its marginal cost, because that is the price it would be paid for its output if its offer was accepted. Therefore, even a supplier with no ability to exercise unilateral market power could be expected to submit an offer price that is higher than its marginal cost of producing electricity. This logic implies that if the marginal cost of producing energy for the short-term market is the same as the marginal cost of providing AGC, an expected profit-maximizing supplier with no ability to exercise unilateral market power is unlikely to submit an offer price equal to the economically efficient offer price for either market, because setting the efficient price for one market would imply setting an inefficient offer price for the other market. Specifically, submitting its marginal cost to the energy market implies that the supplier would earn no variable profits from selling AGC because it would only receive its cost for providing it. Submitting a higher offer price than its marginal cost, so that it would earn variable profits from selling AGC, would reduce the profits that it would earn from selling energy in the short-term market. If the marginal cost of providing short-term energy differs from the marginal cost of providing AGC, then it is still very unlikely that a supplier with no ability to exercise unilateral market could find a single offer price that is simultaneously the economically efficient offer price for both markets. This fact is the primary source of the market efficiency costs associated using the same offer prices for the two markets. The market efficiency benefits from this requirement stems from the fact that it limits the ability of suppliers to exercise unilateral market power in both markets. By the logic of Section 57
3.2, for the same distribution of residual demand curves in each market, using only one offer price to maximize expected profits from sales in both markets cannot result in greater expected profits than would be case if the supplier was able to set a different offer price in each market. Consequently, the decision to allow suppliers to submit different offer prices in each market should depend on how competitive the AGC market is, because less offer curve flexibility could reduce the amount of market power exercised in the AGC market at the expense of higher prices in the short-term energy market relative to the case of separate offer prices for both markets. Because Colombia is dominated by hydroelectric energy, which is typically ideally suited to provide AGC, the market for this product has the potential to be very competitive, so the market efficiency benefits of different offer prices for each market is likely to outweigh the market power mitigation benefits of single offer price. Nevertheless, one requirement for allowing separate offer prices for short-term energy and AGC is that more generation units commit to installing the necessary equipment to provide AGC. An additional mechanism to consider would be to require retailers to purchase a certain fraction of their annual expected AGC needs in fixed-price forward contracts far in advance of delivery, which for the reasons discussed in Section 2, would limit the incentive of suppliers to exercise unilateral market power in the AGC market if they are given the ability to submit different offer prices into the short-term energy market and AGC market.
3.4. Allowing CoGeneration Units to Participate in the Wholesale Market A final way to limit the ability of large suppliers to exercise unilateral market power in the short-term energy market is to allow co-generation units or on-site generation units built by industrial and commercial customers to sell the energy they do not consume into the short-term wholesale market. This market rule change would be straightforward to implement except that all commercial and industrial consumers must pay a 20% tax on their electricity consumption to fund, in part, the electricity consumption subsidies paid to low-income residential electricity consumers in Colombia. If these industrial and commercial consumers built generation units and purchased their net electricity consumption (total amount consumed less the amount produced from their own generation units) from the wholesale market, this could result in substantial loss in tax revenues for the electricity subsidies. However, the additional source of supply from these new generation units would face existing suppliers with additional competition, particularly during the periods when these suppliers are likely to have substantial ability to exercise unilateral market power in the short-term market. Consequently, if the difficult issue of replacing the tax revenues paid by industrial and commercial customers can be dealt with, there are likely to be benefits to all electricity consumers from the increased competition that existing suppliers face from energy sold in the short-term market from co-generation and other on-site generation units.
4. Local Market Power Issues This section first introduces the concept of local market power as distinct from systemwide market power in order to provide the necessary analytical framework to address two issues related to this concept. Suppliers can possess substantial local market under certain system 58
conditions in the wholesale market regime because of their location and the location of final demand in the transmission network. Local market power has been particularly problematic in the United States because of the limited amount of investment in transmission capacity that occurred throughout the country from the late 1970’s until very recently. This has necessitated the development local market power mitigation mechanisms in all United States wholesale markets to limit the behavior of suppliers when they possess the ability to exercise substantial local market power. I show that the negative and positive reconciliation payment mechanisms in the Colombian short-term market are a form of a local market power mitigation mechanism. I then suggest changes to this mechanism that should improve wholesale market performance. I then discuss an issue related to the local market power problem: whether to allow suppliers to submit start-up cost offers and receive explicit compensation for these start-up costs as well as for the energy they produce.
4.1. Origins of the Local Market Power Problem Local market problems arise because the existing transmission network in virtually all existing wholesale electricity markets operating around the world is poorly suited to support the geographic extent and magnitude of electricity trading required for a workably competitive wholesale market. A key feature of all transmission networks owned by vertically-integrated utilities is that they were designed to take advantage of the fact that the same entity owned and operated the transmission and distribution network, as well as the vast majority of generating units needed to meet all load in a given geographic area. Particularly, around large population centers and in geographically remote areas, the vertically-integrated utility used a mix of local generation units and transmission capacity to meet the annual demand for electricity in the region. Typically, the vertically-integrated utility supplied the region’s baseload energy needs from distant inexpensive units using high-voltage transmission lines. It used expensive generating units located near load centers to meet periodic demand peaks in the area throughout the year. This combination of local generation and transmission capacity to deliver distant generation was the least-cost strategy for serving the utility’s load in the former regime. The transmission network that resulted from this strategy by the vertically-integrated utility for serving its retail customers creates local market power problems in the new wholesale market regime because now the owner of the generating units located close to the load center may not own, and certainly does not operate, the transmission network. The owner of the local generation units is often unaffiliated with the retailers serving customers in that geographic area. Consequently, during the hours of the year when system conditions require that some energy be supplied from these local generation units, it is profit-maximizing for the owners to bid whatever the market will bear for any energy they provide. This point deserves emphasis: the offers of the generation units within the local area must be taken before lower-priced offers from other generation units outside this area because the configuration of the transmission network and location of demand makes these units the only ones physically capable of meeting the energy need. Without some form of regulatory intervention, these suppliers must be paid at their offer price in order to be willing to provide the needed electricity. The configuration of the existing transmission network and the geographic distribution of generation capacity ownership in virtually all wholesale markets around the world 59
results in a frequency and magnitude of substantial local market power for certain market participants that if left unmitigated could earn the generation unit owners enormous profits and therefore cause substantial harm to consumers. Regulatory intervention in the form of what is typically referred to as local market power mitigation (LMPM) mechanism is necessary to limit the exercise of local market power. There are three main features of a LMPM mechanism. The first is how to determine whether a supplier possesses significant local market power worthy of mitigation. The second is determining the payment received by a supplier when it has been mitigated. The third element is how market prices should be determined when some suppliers have been mitigated under the LMPM mechanism. Following a discussion of the generic example of local market power along with an application of the LMPM mechanism currently in place in the Colombian market, I discuss possible improvements to Colombian LMPM mechanism.
4.2. Local Market Power Mitigation in Colombian Wholesale Market To provide a concrete example that illustrates the general local market power problem and the specific application of local market power mitigation to the Colombian market, consider the 3-node DC-load-flow example shown in Figure 4.1. All 2,637 MW of load is concentrated at node 3 and demand is price inelastic. There are generation units located at each of the nodes in the network with the offer curves given in Figure 1. Each transmission link is the same length and is therefore assumed to have the same resistance. However, the link between nodes 2 and 3 has a maximum capacity of 600 MW. The other two links have sufficient capacity so that only the 600 MW link between nodes 2 and 3 is ever binding. Because this example ignores the impact of line losses on energy flows, a feasible set of energy schedules for the generators located at the three nodes satisfies the following two constraints: (1) the total amount of energy supplied by each generator equals the total demand at node 3 and (2) the flow on the link between nodes 2 and 3 is less than or equal to 600 MW. I employ a 3-node example because it is the simplest transmission network model that can illustrate the local market power problem and account for the impact of loop flow. Because of the configuration of the transmission network and the geographic location of demand, the generator located at node 3 must supply some energy or the first constraint necessary for a feasible schedule will be violated. Because of Kirchoff's Laws governing power flows, a 1 MW injection of energy at node 1 will lead to 1/3 MW flow from node 1 to node 2 and node 2 to node 3, and a 2/3 MW flow from node 1 to node 3. Similarly, a 1 MW injection at node 2 will lead to a 1/3 MW flow from node 2 to node 1 and node 1 to node 3 and 2/3 MW flow from node 2 to node 3. Consequently, defining qi as the amount of energy injected at node i, we can write the transmission constraint on flows between node 2 and 3 as 1/3 q1 + 2/3 q2 # 600. Consequently, any values q1, q2 and q3 that sum to 2,637 and satisfy this inequality constraint represent a feasible set of generation schedules. Multiplying both sides of this inequality by 3 yields the expression, q1 + 2 q2 # 1800. Written in this form, it is clear that the constraint on the transmission capacity between nodes 2 and 3 implies that the generator at node 3 must produce a substantial amount of energy or the constraint q1 + q2 + q3 = 2,637 will be violated. The minimum possible amount energy that must be supplied from node 3 is 2,637 – 1,800 = 837. This occurs when the generation units at node 1 produce 1,800 MW and the generation units at node 2 produces zero MW. 60
Figure 4.1: Three-Node Network Model Generation at 1
Load at 3
P
P
4
2
2000
Q
600 MW Maximum Transfer Capacity From Node 2 to Node 3
2637
Q
1 2
3 Generation at 3
Generation at 2 P
P
5.9 5
1.03 1 63
Q
900 61
Q
Consequently, the generator at node 3 is a local monopolist for at least 837 MW under this combination of the transmission network configuration and demand conditions. The generator at node 3 is pivotal in the sense defined in Section 2.4 for 837 MW, because regardless of the price it bids to supply this amount of energy, physical constraints in the transmission network imply that this quantity of energy from the generation units at node 3 must be accepted or the constraint that supply equals demand at node 3 will be violated. It is important to emphasize that one implication of a 3-node network model is that if the generator at node 2 supplies any amount of energy, the generator at node 3 becomes pivotal for a quantity of energy larger than 837. It is important to note that the congestion management scheme used by the system operator does not impact the extent to which suppliers have the ability to exercise local market power. The behavior of all firms owning generating units determines whether the firm owning local generation possesses significant local market power and the magnitude of local market power that this firm can exercise. Particularly in a looped (as opposed to radial) transmission network, how a firm that owns multiple generating units operates its units in one geographic area can impact the amount of available transmission capacity to serve load in a geographic area where it owns other generating units. 4.2.1. Relationship between reconciliation payment mechanism and LMPM mechanism Applying the Colombia market rules to this example shows the relationship between the local market power problem and the positive and negative reconciliation issue. Under the Ideal Dispatch, the three offer curves at each location would be aggregated to produce an aggregate offer curve. Consistent with the Colombian market rules, the ideal dispatch ignores transmission constraints in the network. The price at which this aggregate offer curve intersects the aggregate demand of 2,637 MW is equal to $2.173, which implies Pspot = $2.173. Intersecting this price with the offer curve at each node, yields for the following values for the Ideal Quantity at each location: = 173, = 2,464, and = 0. This solution assumes that there is at least at much generation capacity at each node as the value of the Ideal Quantity at that location. Because of the configuration of the transmission network, this dispatch is not technically feasible. Solving for the least cost dispatch necessary to meet system demand that respects the transmission constraints and loop flow yields, the following values for the Actual Quantities: = 1,643, = 78, and = 915. This solution assumes there is at least as much generation capacity at each node as the value of the Actual Quantity. This solution requires both positive and negative reconciliation payments. In particular, the suppliers at nodes 1 and 3 would receive positive reconciliation payments because their Actual Quantity exceeds their Ideal Quantity. According to the Colombia market rules, for generation unit not providing AGC, the positive reconciliation payment is equal to RECPos = (PRPos)x(qActual – qIdeal) where PRPos = min([CSC + CTC + COM + OCV] + CAP/GSA , POffer ), where CSC = the input fuel cost, CTC = the fuel transportation cost, COM = variable operating and maintenance cost, OCV = other variable costs for thermal plants, CAP = Start-up costs, GSA = total security 62
generation for the start-up day, and POffer = offer price of generation unit. These suppliers would also receive Pspot for their Ideal Generation. It important to emphasize that the supplier receiving a positive reconciliation payment is guaranteed to at least recover of its start-up costs if its offer price is above [CSC + CTC + COM + OCV] + CAP/GSA. For a supplier that knows or is confident that it is required to operate because of transmission constraint, this fact implies that the supplier has little incentive to submit an offer price below [CSC + CTC + COM + OCV] + CAP/GSA. The supplier at node 2 would make a negative reconciliation payment because it is producing less than its ideal generation. If it not providing AGC, this generation unit owner it would pay RECNeg = (PRNeg)x(qIdeal – qActual), where PRNeg = ½ x (POffer + Pspot ), but it would also receive Pspot for its Ideal Generation. Another way to view this payment stream is that the supplier receives Pspot or its Actual Quantity and ½ x (Pspot – POffer ) for the difference between qIdeal and qActual. The modifications of the basic reconciliation payment mechanism to account for the provision of AGC complicates the discussion of the payments generation unit owners receive, but does not change the incentives that generation unit owners face for submitting price offers described below. 4.2.2. Analysis of performance of Colombian reconciliation payment mechanism Using data on hourly aggregate energy market revenues from 1 January 2003 to 30 June 2009 and aggregate negative and positive reconciliation payments and hourly values of these two magnitudes at the plant level from 1 January 2003 to 6 February 2009, I establish several empirical regularities associated with the operation of the Colombian local market power mitigation mechanism up to 6 February 2009. Because of recent data release constraints implemented by the CREG, the positive and negative reconciliation data is not available beyond 6 February 2009. This fact prevents an analysis of these issues beyond the date in this report. Moreover, it is important to emphasize that it very unlikely to be illegal for any market participant to share information on the negative and positive reconciliation payments that it received from 6 February 2009 to 30 June 2009 with any other market participant. Consequently, it is unclear what public benefit is served by keeping this information confidential. Figure 4.2 presents the 30-day volume-weighted average of the short-term prices and average generation revenue including positive and negative reconciliation payments. The average generation revenue for an hour is computed by first summing the total energy market revenues, total positive reconciliation payments and total negative reconciliation payments for that hour and dividing this sum by total system load for that hour. This calculation is repeated for each hour from 1 January 2003 to the 6 February 2009 and then the 30-day volume-weighted average of these hourly magnitudes is computed and plotted in Figure 4.2. Figure 4.3 plots difference between the average short-term price and the average generation revenues (including positive and negative reconciliation payments). Comparing the two lines in Figure 4.2 or the scales on the vertical axis in Figures 4.2 and 4.3 demonstrates that total reconciliation payments are not significant percentage of total wholesale market revenues. 63
Figures 4.4 to 4.7 present this same figure at the plant level for the Chivor, Gustape, Guavio, and San Carlos plants. These figures are all qualitatively similar to Figure 4.2, suggesting that these plants obtain a very small fraction of their total revenues from reconciliation payments. Figures 4.8 and 4.9 tell a very different story from Figures 4.4 to 4.7. These figures reproduce the average price and average revenue (including reconciliation payments) for Tebsa and Termoflores 1. For these two plants, reconciliation payments often comprise more than one-third and almost one-half of their average revenues, particularly during the past seven months. These figures suggest two stylized facts about the Colombia reconciliation payment mechanism. First, total payments are typically a small fraction of total wholesale energy market revenues. Second, for some generation units, positive and negative reconciliation payments are a significant fraction of the total revenues they earn from participating in the Colombian market. 4.2.3. Analysis of reconciliation payment mechanism as a LMPM mechanism Viewing the Colombian negative and positive reconciliation mechanism as a local market power mitigation mechanism suggests a several possible modifications to it that can improve the efficiency of the short-term energy market. In this section, I assess the design of the Colombian mechanism from the perspective of the three-step process for designing a local market power mitigation mechanism described in Section 4.1. The first step of a LMPM mechanism is to determine when a supplier possesses significant local market power that is worthy of mitigation. The Colombian mechanism considers a generation unit worthy of mitigation whenever there is a difference between its Ideal Quantity and its Actual Quantity. No consideration is given as to whether the generation unit faces significant competition for the difference between its Ideal and Actual Output in the case of a positive reconciliation payment. Negative reconciliation payments are treated the same way. The generation unit automatically receives a negative reconciliation payment if Ideal Output exceeds Actual Output, regardless of the amount of competition the supplier faces for this energy reduction. Because a generation unit’s Ideal Quantity is determined the day after its Actual Output is determined, there are variety of options for determining whether the supplier is worthy of market power mitigation. For example, the market operator could compute the residual demand curve faced by each generation unit taking into account transmission constraints as described in Section 2 and set some maximum inverse elasticity at the spot price that determines whether the supplier is worthy of mitigation. A more discerning mechanism for determining whether a generation unit is worthy of mitigation can provide stronger incentives for unit owners to submit offer prices closer to their marginal cost of producing electricity, which will limit the amount of positive and negative reconciliations payments. If generation unit owner knows that any time Actual Generation differs from Ideal Generation it will be mitigated, the unit owner will have a stronger incentive to distort its offer price in an effort to increase its positive or negative reconciliation payment.
64
Figure 4.2: Wh holesale pricees and averagge revenue in ncluding reconciliation paayments: System-wide 200 175
Price ($/kWh)
150 125 100 75 50 25 0 Jan 2003
Jan 2004
Jan 2005
J 2006 Jan
Ja an 2007
Ja an 2008
Jan n 2009
Avv. revenue including recconciliation payyments
Spot price
Source: Neeón. Short-term m prices and averrage revenue aree a 30-day volum me-weighted mooving average. Short-term pricees: 1 Jan 2003 to t 30 Jun 2009. Average revenuue including recoonciliation paym ments: 1 Jan 20033 to 31 Mar 20099.
Figure 4.3: Differencce between wholesale w shorrt-term pricees and averaage revenue: System-widee
Source: Neón. N Differencee between 30-daay volume-weigghted moving avverage of short-term prices andd average revenuue. Sample periiod: 1 Jan 2003 to 31 Mar 2009.
65
Figure 4.4: Wholesale prices and average revenue including reconciliation payments: Chivor 200 175
Price ($/kWh)
150 125 100 75 50 25 0 Jan 2003
Jan 2004
Jan 2005
Jan 2006
Jan 2007
Jan 2008
Jan 2009
Av. revenue including reconciliation payments
Spot price
Source: Neón. Short-term prices and average revenue are a 30-day volume-weighted moving average. Short-term prices: 1 Jan 2003 to 30 Jun 2009. Average revenue including reconciliation payments: 1 Jan 2003 to 31 Mar 2009.
Figure 4.5: Wholesale prices and average revenue including reconciliation payments: Guatape 200 175
Price ($/kWh)
150 125 100 75 50 25 0 Jan 2003
Jan 2004
Jan 2005
Jan 2006
Jan 2007
Jan 2008
Jan 2009
Av. revenue including reconciliation payments
Spot price
Source: Neón. Short-term prices and average revenue are a 30-day volume-weighted moving average. Short-term prices: 1 Jan 2003 to 30 Jun 2009. Average revenue including reconciliation payments: 1 Jan 2003 to 31 Mar 2009.
66
Figure 4.6: Wholesale prices and average revenue including reconciliation payments: Guavio 200 175
Price ($/kWh)
150 125 100 75 50 25 0 Jan 2003
Jan 2004
Jan 2005
Jan 2006
Jan 2007
Jan 2008
Jan 2009
Av. revenue including reconciliation payments
Spot price
Source: Neón. Short-term prices and average revenue are a 30-day volume-weighted moving average. Short-term prices: 1 Jan 2003 to 30 Jun 2009. Average revenue including reconciliation payments: 1 Jan 2003 to 31 Mar 2009.
Figure 4.7: Wholesale prices and average revenue including \ reconciliation payments: San Carlos 200 175
Price ($/kWh)
150 125 100 75 50 25 0 Jan 2003
Jan 2004
Jan 2005
Jan 2006
Jan 2007
Jan 2008
Jan 2009
Av. revenue including reconciliation payments
Spot price
Source: Neón. Short-term prices and average revenue are a 30-day volume-weighted moving average. Short-term prices: 1 Jan 2003 to 30 Jun 2009. Average revenue including reconciliation payments: 1 Jan 2003 to 31 Mar 2009.
67
Figure 4.8: Wholesale prices and average revenue including reconciliation payments: Tebsa 200 175
Price ($/kWh)
150 125 100 75 50 25 0 Jan 2003
Jan 2004
Jan 2005
Jan 2006
Jan 2007
Jan 2008
Jan 2009
Av. revenue including reconciliation payments
Spot price
Source: Neón. Short-term prices and average revenue are a 30-day volume-weighted moving average. Short-term prices: 1 Jan 2003 to 30 Jun 2009. Average revenue including reconciliation payments: 1 Jan 2003 to 31 Mar 2009.
Figure 4.9: Wholesale prices and average revenue including reconciliation payments: Termoflores 1 200 175
Price ($/kWh)
150 125 100 75 50 25 0 Jan 2003
Jan 2004
Jan 2005
Jan 2006
Jan 2007
Jan 2008
Jan 2009
Av. revenue including reconciliation payments
Spot price
Source: Neón. Short-term prices and average revenue are a 30-day volume-weighted moving average. Short-term prices: 1 Jan 2003 to 30 Jun 2009. Average revenue including reconciliation payments: 1 Jan 2003 to 31 Mar 2009.
68
This point directly leads to the second step in the local market power mitigation mechanism—what to pay the mitigated supplier. For case of positive reconciliations, paying the generation unit the higher of the market price and its variable cost has a number of favorable market efficiency properties. However, it is important to only include true volume-variable costs in the regulated variable cost measure. Suppliers will often attempt to convince the regulator that many fixed costs, such as start-up, fixed operating and maintenance costs, capital costs should be included in its regulated variable costs. Only verifiable costs that vary with the level of output of the generation unit should be included in these variable costs. The Colombian short-term market does not currently guarantee start-up cost recovery. Suppliers that do not receive reconciliation payments must recover both their variable production costs and start-up costs from revenues they receive from selling the unit’s output at the marketclearing price. Guaranteeing start-up cost recovery for a unit receiving positive reconciliation payments creates an incentive for unit owners that know a unit’s Actual Output will exceed its Ideal Output to submit offer prices significantly above their unit’s variable cost so that PRPos will equal [CSC + CTC + COM + OCV] + CAP/GSA and they will receive start-up cost recovery. This asymmetry between the short-term energy market and the positive reconciliation mechanism in how start-up costs are recovered creates strong incentives for generation unit owners that know Actual Output will exceed Ideal Output to submit offer prices substantially higher than the unit’s variable cost of production. Consequently, if the short-term energy market does not guarantee start-up cost recovery, the positive reconciliation payment mechanism should not guarantee start-up cost recovery. A mitigated unit should be paid the minimum of the unit’s offer price and its volume-variable cost of production. The regulator may wish to consider using a benchmark approach to computing a unit’s volume variable costs. For example, rather than asking a generation unit owner for its variable cost, the regulator would collect information on the unit’s heat rate and then use international data on input fossil fuel prices and variable operating and maintenance costs for comparable units to construct a benchmark variable cost for the unit. If the unit owner reduces its actual costs below this benchmark, then it can keep the difference. If it does not, then it must pay for the difference in reduced profits. The advantage of this procedure for computing a unit’s regulated volume-variable cost is that it avoids disputes with the unit’s owner over what are prudently incurred costs and it provides strong incentives for the owner to reduce the unit’s actual variable costs. For the case of negative reconciliations, there is a question of whether suppliers should actually receive compensation for the difference between their Ideal Output and their Actual Output, because they are effectively being paid for energy that they cannot provide. Moreover, the current compensation mechanism creates a strong incentive for a supplier that knows it will receive a negative reconciliation payment to submit the lowest possible offer price, because the difference between its Ideal Output and Actual Output is paid one-half of the difference between the short-term price and the unit’s offer price. The way to maximize the amount a supplier receives from this scheme is to submit the lowest possible offer price. This strategy will tend to increase the value of the unit’s Ideal Output and increase difference between Pspot and POffer, both of which increase the value of ½ x (Pspot – POffer )(qIdeal - qActual), the negative reconciliation payment. Suppliers are still paid the short-term price for their Actual Output, but this negative 69
reconciliation payment mechanism provide strong incentives for unit owners that know the unit’s Actual Output will be less than it Ideal Output to distort their offer price far below their variable cost of production in order to maximize the reconciliation payment they receive. The California faced a very similar problem with its multi-settlement zonal market that existed from April 1998 to April 2009. Suppliers would schedule units in the day-ahead market that they knew, with at least a high probability, could not actually produce output in real-time because of transmission or other system reliability constraints within the zone. The supplier would then submit a very low, and in many cases negative, willingness-to-curtail curve into the real-time market and get paid back for the difference between its day-ahead schedule and realtime output at this offer price because this offer had to be accepted out of merit order in the realtime market. An example illustrates the nature of this problem. Suppose the supplier sells 100 MW in the day-ahead market at $50/MWh but it knows that intra-zonal transmission constraints imply that it can only supply 10 MW from this unit in real-time. Consequently, the supplier submits an offer price of $10/MWh to supply less energy in real-time. Under the California market rules, a supplier is paid as-bid for providing out-of-merit-order-in-the-zone, incremental or decremental energy. Suppose the real-time price was also $50/MWh, but the supplier’s decremental energy offer had to be accepted. In this case the supplier would receive a net profit of ($50/MWh $10/MWh) x (100 MWh – 10 MWh), the difference between the day-ahead price that it sold the 90 MWh that it does not actually produce and $10/MWh, the price it must pay back for providing 90 MWh less energy in real-time. It is important to emphasize that this supplier is being paid for doing virtually nothing besides selling 100 MWh in the day-ahead market and only producing 10 MWh. The supplier receives the day-ahead price for 100 MWh and it receives an out-of-merit-order real-time dispatch instruction from the market operator to provide 90/MWh less than its day-ahead schedule at $10/MWh. Certain suppliers became very adept at figuring out when they would be needed to supply less energy in real-time because of intra-zonal constraints and would in submit negative offer prices for decremental energy to increase the difference between the day-ahead price and the offer price that the market operator was willing to receive for decrement energy. For example if the supplier had submitted a decremental energy offer price of -$30/MWh (the price offer floor in the real-time market) it would have received the much larger revenue stream of ($50/MWh + $30/MWh) x (100 MWh – 10 MWh). This strategy became so popular that it received its own name, the “DEC Game”, because it involved submitting decremental energy bids to the real-time market to undo day-ahead schedules that could not be produced because of transmission constraints. The negative reconciliation payment mechanism in Colombia shares many of these same features. For that reason, it may make sense to significantly limit the payments received for providing negative reconciliations. One approach would be simply to pay nothing for negative reconciliations, but continue to pay the market-clearing price for the supplier’s Actual Output. Different from the California market, the unit owner in Colombia did not schedule its Ideal Output using a day-ahead financial market (as was the case in California). A unit’s Ideal Output
70
in Colombia is determined after actual market operation and after the unit’s Actual Output is known. Typically, payments are made to generation units to provide incentives for efficient market outcomes in both the short-term and long-term. The negative reconciliation payment is rewarding a generation unit owner for being located in an area where its energy cannot be injected into the transmission network. For this reason, it makes little economic sense to make negative reconciliation payments to generation unit owners, so long as they are receiving the market-clearing price for the output they do produce, as it currently the case. This payment mechanism provides strong incentives for unit owners to submit offer prices below their variable costs to ensure a large Ideal Output and a large difference between the market price and their offer price. Over the long-term, this scheme rewards generation unit owners for locating in regions where they are unable to sell all of the electricity they are willing to produce, which is clearly inefficient. Because the immediate elimination of the negative reconciliation payment mechanism will result in a revenue loss to some generation unit owners and the transmission upgrades needed to allow these units to sell their energy take time to construct, a gradual phase-out of the negative reconciliation payment mechanism may be worth considering. The CREG or the SSPD could identify a set of transmission upgrades throughout Colombia that would significantly reduce the need for negative reconciliation payments. Once these upgrades have been completed the negative reconciliation payment mechanism could then be eliminated from the Colombian market and suppliers with an Actual Output below their Ideal Output would only be paid the market-clearing price for their Actual Output. The third step of the local market power mitigation mechanism is how to determine the market-clearing price received by unmitigated suppliers. The Colombian mechanism pays these suppliers the price determined by the intersection of the aggregate supply curve that ignores all transmission constraints with the actual aggregate demand. This has the advantage that it is straightforward to compute, but the disadvantage that it results in a potentially large volume of positive and negative reconciliation payments, particularly for certain generation units as shown in the previous section. The above analysis and the discussion in Section 4.2.3 suggest another approach to market power mitigation for the Colombian market. These results indicate that certain generation units receive a significant fraction of their total revenues from reconciliation payments, despite the fact these payments in aggregate are a small fraction of total short-term market revenues. Consequently, one possible approach to the positive reconciliation problem is to designate certain generation units as regulated must-run units and pay them a regulated rate of return in exchange for the market operator being able to set their dispatch levels at whatever is necessary for reliability reasons each hour of the day. Their supply would be then be netted off against the aggregate demand in the short-term market price-setting process. The usual pricesetting process would operate with this reduced level of demand to set the market-clearing price. The reduced level of demand and the full network model with these must-run units operating at the levels set by the market operator would then be used to compute the Actual Quantity for each generation unit. 71
The amount of both positive and negative reconciliations would be substantially reduced because the demand used to set both the Actual Quantity and Ideal Quantity for the remaining generation units would be reduced by the amount of the pre-dispatched regulatory must-run units. Moreover, as noted earlier there is little economic rationale for paying for negative reconciliations. With a much lower volume of negative reconciliations that argument carries even more weight. For positive reconciliations, supplier could be paid their regulated variable cost as described above. To determine which units are designated as regulatory must-run, the regulator could set a critical maximum amount of positive reconciliation payments as a percent of the unit’s wholesale energy revenues, that if exceeded in the previous year or month, causes a unit to be designed as a must-run unit for the next year or month. It is likely that consumers would benefit from this approach to local market power mitigation relative to the current approach because the system operator could concentrate its reliability must-run dispatches in these regulatory must-run units that are guaranteed full cost recovery and significantly limit the amount of positive reconciliation payments to other generation units. The remaining generation units now have less incentive to distort their price and quantity offers for the prospects of substantial positive and negative reconciliation payments, so the efficiency of the short-term market should improve. A longer term approach to dealing with reconciliation payment problem is to implement locational marginal pricing (LMP) in the Colombian short-term energy market. The full transmission network model and the offer curves of suppliers would be used to set locational marginal prices by minimizing the as-offered cost of serving demand at all locations in Colombia. Because all relevant operating constraints are modeled in the price-setting process, there would be no difference between a unit’s Ideal and Actual Output, although generation units at different locations could be paid different prices because of transmission constraints. The use of locational marginal pricing would not eliminate the need for a LMPM mechanism in Colombia, because suppliers that know they must operate can submit very high offer prices and still be accepted to provide energy and be paid a price that is greater than or equal to their offer price. A locational marginal pricing market would, however, eliminate the need for both positive and negative reconciliation payments because there would be no difference between Ideal Output and Actual Output for a generation unit because all relevant operating constraints are modeled in both the Ideal and Actual dispatches. 4.2.3. Concluding comments on local market power mitigation Viewing the current positive and negative reconciliation payment mechanism as form of local market power mitigation yields a number of insights. First, the existing negative reconciliation payment scheme provides a strong incentive for suppliers to set their offer price below their variable cost of production to cause negative reconciliations, similar to the DEC Game that occurred in the former zonal California market. Because the Ideal Output is determined after, not before the unit’s Actual Output is known and it does not involve any firm financial commitment on the part of the unit’s owner, there is little economic rationale for making negative reconciliation payments if the owner is paid the short-term price for its Actual Output. Because total reconciliation payments appear to be concentrated in a few generation units, a lower cost-to-consumers approach may be to designate a number of must-run generation units, guarantee them full cost recovery for the some sustained period of time and concentrate all 72
must-run dispatches because of local transmission constraints in these units. This would minimize the need for positive reconciliation payments from other generation units and likely increase the competitiveness of wholesale market outcomes because all suppliers would have less of incentive to submit offer prices that differ from their variable cost in an effort to increase the positive and negative reconciliation payments they receive.
4.3. Incorporating StartUp Cost Offers Into ShortTerm Energy Market Since the start of the Colombian market, the system operator has only used the energy offer curve submitted by suppliers to determine the market-clearing price paid to the Actual Output of all suppliers. A number of stakeholders have argued for allowing suppliers to submit start-up costs into the day-ahead market and have guaranteed start-up cost recovery either through a higher energy price or an explicit payment for the unit’s start-up costs and the CREG is considering a modification to the short-term market rules to allow this to occur. This section considers the market efficiency properties of this proposed change. I find little theoretical evidence for making this change or little empirical evidence from Colombian market outcomes to suggest that it would improve the performance of the short-term market. The best available evidence indicates that this change would increase total wholesale energy costs to Colombia consumers. I suggest a study that could be performed that to provide more definitive evidence on whether market efficiency would be harmed by guaranteeing start-up cost recovery. 4.3.1. Identifying source and magnitude of problem The first question that should be asked about this proposal is: Why does the existing market design for start-up cost recovery create market inefficiencies and why have these market inefficiencies taken so long to appear? The Colombian market has been operating for more than ten years and the start-up cover recovery issue does not appear to have been raised as a major issue until now. Moreover, it is puzzling why this is a source of market inefficiencies in a wholesale market dominated by hydroelectric capacity, which has virtually no start-up costs and is therefore well-suited to being turned on and off on a daily basis. Before making a change in market rules that is very likely to increase total wholesale energy costs to Colombian consumers, it is very important to identify tangible market efficiency benefits from this market rule change or why market performance has been so adversely impacted that a market rule change is needed. Some commentators have argued that the lack of guaranteed start-up cost recovery are a major reason that many generation unit owners submitted offer prices that were substantially higher than their unit’s variable cost of production over the past seven months. As discussed in the previous section, part of the explanation for suppliers submitting high offer prices is the asymmetry in how start-up cost recovery is treated in the short-term energy market versus the positive reconciliation payment mechanism. Suppliers that know, or estimate with a high probability, that one or more of their units will have a higher Actual Output than Ideal Output have a strong incentive to submit high offer prices in order to ensure that they will receive a positive reconciliation payment that recovers their start-up costs. Arguments have only been made that if suppliers had the ability to submit start-up offers and receive guaranteed recovery of these costs they would be less likely to submit price offers for their energy above their marginal cost. The empirical evidence from a number of US markets 73
that allow suppliers to submit start-up and energy offer curves does not provide clear empirical evidence in favor of this logic. Suppliers that received guaranteed start-up cost recovery still have a strong financial incentive to exercise all available unilateral market power in setting their energy offer prices. As the discussion in Section 2 demonstrates, if these suppliers did not possess the ability to impact market prices through their offer price behavior they would submit offer price equal to their marginal cost of production. The only reason that a unit’s start-up cost should be relevant to the offer price of a supplier with no ability to exercise unilateral market power is if the amount of revenue the supplier expects to earn in excess of its variable operating costs is less its start-up costs. This problem should only be relevant for fossil-fuel fired units that expect to operate for a short period of time, not for baseload coal-fired or natural gas-fired units that start-up and shut down infrequently. Because more than 60% of the installed capacity in Colombia is hydroelectric, there seems to be little reason to use fossil fuel-fired generation units to meet short duration system demand peaks. Hydroelectric units have extremely low start-up costs, relative to even the least expensive fossil fuel-fired unit and for that reason appear well-suited to manage the system peaks. Moreover, because these peak demand periods are also likely to be the high-priced periods of the day a hydroelectric supplier with no ability to exercise unilateral market power is likely to want to sell more energy during these periods as well. Another argument against providing guaranteed recovery of start-up costs is that it unnecessarily increases the costs that final consumers must pay with no apparent corresponding economic benefit. Shop owners cannot not charge customers daily fees that recover the fixed cost of keeping their shops open. Instead, the owner must recover these start-up costs and the variable cost of the products sold from the prices charged for products consumers purchase. As a consequence, some days the store owner earns more revenues than its total costs of operating the store that day and in other days it does not. What matters on a yearly basis is that sum of total revenues from products sold minus total costs is positive. If that is the case, then the store owner will remain in business. The same logic can be applied to generation unit owners. Some days they earn revenues far in excess of their total production costs and start-up costs and other times they can earn less. If over the course of the year total revenues exceed total costs, the unit will remain in business. Just like a store owner, a generation unit owner does not decide to close a facility each day because there is the prospect of revenues in far excess of total costs during future days. Promising the generation unit owner start-up cost recovery every time it turns on, almost guarantees that consumers will pay more for their electricity. Unless the generation unit owner is willing to provide refunds to consumers on the days that it earns revenues substantially in excess of its actual start-up and variable costs, it is difficult to see the rationale for guaranteeing start-up cost recovery each time the supplier operates. 4.3.2. Alternative solutions to startup cost recovery The need to allow hydroelectric supplier to manage their water use within the day so that fossil-fuel units do not need to start-up and run for a short period of time to meet system peaks is another reason for introducing greater flexibility into the offer curves that suppliers are allowed 74
to submit. Consequently, rather than introducing a start-up cost offer into the day-ahead market, which could significantly complicate the pricing-setting process, a superior strategy may be to allow greater flexibility in the energy offer curves that suppliers can submit so that hydroelectric energy suppliers can sell more water during the peak periods of the day and eliminate the need to turn on fossil fuel units for a short period of time during these times of the day. It is difficult to see the difference between the economic logic that does not guarantee that a shopkeeper will recover it total costs every day it opens its store and the economic logic that does not guarantee that a generation unit owner recovery of its start-up and variable operating costs every time it turns on. The one dimension where this parallel logic may break down is that the consumer could likely still purchase the products it wants without a local store, some electricity consumers may not be served if a local generation unit decides to exit the industry. However, if a generation unit owner decides to exit the industry and the system operator still needs it to serve load because of its location in the transmission network, then the system operator can offer the generation unit as full cost of service guarantee to remain in business in exchange for being used as a must-run generation unit as described above. If it is determined that a start-up will be implemented and start-up cost recovery will be guaranteed, then a strategy that mitigates the potential cost to electricity consumers from this policy is to guarantee start-up cost recovery net of market revenues over the longest horizon possible less than one year. For example, the market operator could keep a running total for each generation unit of its accumulated variable costs and start up costs for the year and as long as the total revenues earned from selling energy and ancillary services over a pre-specified time horizon exceeds the unit’s total start-up costs and variable costs over this same time horizon, the generation unit owner will be deemed to have recovered its start-up costs and no additional payments to the generation unit owner are needed. If the total annual revenues received by the unit owner do not exceed the total start up and variable costs over the year for the unit, then the owner could receive a “make whole” payment that makes up the difference. To protect consumers against paying for too many starts, the minimum time horizon over which a unit should be guaranteed start-up cost recovery is a month. This netting of the revenues against operating and start-up costs should also occur across all units owned by each supplier rather than on a unit-by-unit basis. Specifically, if one unit receives more revenues than its operating and start-up costs, and another unit does not, if the sum of these operating revenues from both units exceeds the start-up and operating costs from both units, the supplier should not receive an additional payment for start-up cost recovery. The netting of revenues and costs across all units owned by a supplier accounts for the fact that there are significant portfolio effects associated with how suppliers achieve total cost recovery for all of their generation units. On some days or under certain system conditions one generation unit may earn revenues substantially in excess of costs and on other days or under other system conditions this may be the case for other units in the supplier’s generation portfolio. Another issue concerns whether suppliers should be guaranteed offer price recovery versus variable cost recovery. There is a substantial possibility of over-recovery of the supplier start-up and variable operating costs if offer cost (both start-up and the energy offer price) recovery is required instead of actual variable (both start-up and energy) cost recovery. A 75
supplier that submits an extremely high offer price is guaranteed to recover this offer price and the start-up cost offer, which could lead to substantial additional payments to generation unit owners beyond short-term energy market revenues for start-up cost recovery. The final issue concerns how to treat start-up costs offers in the pricing algorithm. The most straightforward approach would be to only use energy offer prices rather than start-up costs offer in the pricing algorithm. This would allow the market operator to maintain the current straightforward price-setting process. Incorporating start-up costs into the process of computing the market price and a generation unit owner’s Ideal Output changes the process from solving for the intersection of an aggregate offer curve with an aggregate demand curve, to solving a mixed integer programming problem, because consideration of the binary decision of whether to turn on generation unit must be considered jointly with how much energy to take from that generation unit. 4.3.3. Recommended study to determine the appropriate course of action This issue could benefit from the further analysis to determine whether market efficiency would be reduced or enhanced by guaranteeing start-up cost recovery. To undertake this study, information on the start-up and variable operating costs of all of the generation units in Colombia should be collected. Information on the distribution of water inflows and system demand should also be collected. This information would then be used to solve a stochastic dynamic programming model for the optimal dispatch of all generation units in Colombia to minimize the discounted present value of start-up and variable operating costs over the distant future. The solution to this model would yield an estimate of the annual least cost pattern of generation unitlevel start-up and operating decisions for all generation units in Colombia. If fossil fuel units start-up and shutdown less frequently under this least cost solution than has actually occurred on an annual basis, then the market efficiency argument for guaranteeing start-up recovery cost is considerably weakened for the following reasons. If the least cost solution involves hydroelectric suppliers managing the daily system peaks and the fossil-fuel suppliers turning on and off less frequently, then by guaranteeing startup cost recovery, fossil fuel suppliers will have less of an incentive to work out an inter-temporal trade with the hydroelectric suppliers to achieve this least cost solution. Because thermal suppliers are guaranteed start-up cost recovery, they will have little incentive to reduce the frequency that that they start-up and shutdown units. However, if start-up cost recovery must come from sales of energy and operating reserves only, then the fossil fuel suppliers will have an incentive to sign hedging arrangements with hydroelectric suppliers to achieve the least cost solution. These hedging arrangement would likely cause thermal suppliers to operate at a higher level of output throughout the entire day (and avoid having to turn on and off during the day) and that more hydroelectricity energy would be produced during the higher demand hours of the day to meet the system peaks and less produced during the remaining hours of the day. This inter-temporal trade is likely to be acceptable to both the fossil-fuel and hydroelectric suppliers for the following reasons. The fossil fuel suppliers would favor it because it allows them to avoid paying for as much start-up and no-load costs each day, yet they still produce roughly the same amount of energy or more energy during the day. The hydroelectric suppliers would favor it because they would use roughly the same amount of water during the 76
day, but sell more of it during the high-priced hours of the day. It is important to emphasize that if start-up cost recovery is guaranteed then fossil fuel suppliers are significantly less likely to be willing to engage in this inter-temporal trade because they no longer avoid the loss of start-up costs. This logic has the important implication that even if the least cost solution to operating the Colombia electricity supply industry is for hydroelectric suppliers to manage the system peaks with few within-day starts by fossil-fuel generation units, if start-up cost recovery is guaranteed the market mechanism is very unlikely to implement this least cost solution. Instead the higher cost solution of more frequent starts by fossil-fuel generation units will occur. Only if start-up cost recovery is not guaranteed will the market mechanism be likely to implement the least cost solution. For this reason, a market rule change that guarantees start-up cost recovery should only be implemented if there is convincing evidence that it will improve market efficiency. 4.3.4. Summary and conclusions on startup cost recovery Although guaranteeing the recovery of start-up costs limits the number reasons that suppliers have to submit offer curves in excess of their marginal costs, the likely outcome of this change in the offer curve is higher, not lower, average wholesale energy costs because, different from the market for all other products, generation unit owners will be guaranteed to never lose money from operating their units, no matter how long these units operate. The argument for guaranteeing start-up cost recovery is further weakened by the large hydroelectric capacity share in the Colombian electricity supply industry. Hydroelectricity units have extremely low start-up costs and are therefore ideally suited to operating for short periods of time to manage system demand peaks during the day. This logic provides further support for the arguments in favor increasing the flexibility in energy offer curves discussed in Section 3. Finally, because the Colombian market has operated for more than ten years without this start-up cost guarantee, it seems reasonable to expect a clear and compelling reason, backed up by strong empirical evidence as a basis for any change in this market rule. I propose one empirical study that could provide the necessary evidence.
5. Market Monitoring Issues This section consider of aspects of the market monitoring process. The first question is how to determine if suppliers are exercising unilateral market power. The second issue concerns the general question of how to distinguish abuse of market power or market manipulation from the exercise of unilateral market power. This section asked whether the market monitoring process should focus on finding abuse market power or market manipulation and punish market participants found to be abusing their ability to exercise unilateral market power. An alternative approach to finding and punishing the abuse of market power is proposed that is likely to be less costly to implement and more effective at improving market performance. The third issue discussed in this section is the role of CSMEM, the independent market monitoring committee. Specific questions addressed include: What are its rights and responsibilities? How should it interact with the CREG and the SSPD? Should it determine if suppliers abused their market power or violated a market rule? 77
5.1. Determining if Suppliers are Exercising Unilateral Market Power As discussed in Section 2, privately-owned suppliers have a fiduciary responsibility to their shareholders to exercise all available unilateral market power. Taking all legal actions to maximize the return on their shareholders’ investment is equivalent to maximizing profits, which is equivalent to exercising all available unilateral market power. There is ample empirical evidence from market participant behavior in wholesale electricity markets from around the world that suppliers maximize expected profits. Wolak (2007) uses supplier offer data from the Australian electricity market to test a number of implications of the assumption of unilateral expected profit-maximizing behavior and finds little evidence against this hypothesis. McRae and Wolak (2009) provide evidence from the New Zealand wholesale market that suppliers set their offer prices in response to competitive conditions—specifically, the four large suppliers submit higher offer prices when they have a greater ability and incentive to exercise unilateral market power. Three of the firms in analyzed by McRae and Wolak (2009) are governmentowned, which implies that firms concerned with maximizing the payments they make to the government or keeping the retail prices paid by their captive customers low have a strong incentive to take actions to maximize profits they earn from selling electricity in the short-term wholesale market, which implies that these entities also exercise unilateral market power. This discussion emphasizes that, for the purposes of the market monitoring process, the key question is not whether suppliers exercise unilateral market power, because they have extremely strong incentives to do so. The empirical evidence suggests that they are also very skilled at doing so. Moreover, if firm is serving it fiduciary responsibility to its shareholders then it should be exercising all available unilateral market power. Consequently, the important question for regulatory policy is: What is the size of the market inefficiencies, specifically the market power rents, caused by these actions, and are these market power rents sufficiently large to justify regulatory intervention? If so, what kind of regulatory intervention? The competitive benchmark analysis methodology described in Section 3.1 provides a useful answer to the market power rents side of this question. The regulatory process and independent market monitor can determine the relevant regulatory cost of taking action and the risk of making a mistake by taking action.
5.2. Distinguishing Abuse of Market Power from the Exercise of Market Power Distinguishing abuse of market power or market manipulation from the exercise of unilateral market power is difficult to do. Many observers would argue that it is impossible to do. At a minimum there is no bright line distinction. One view of abuse of market power is that it entails using illegal actions to exercise market power. For example, if burning down a competitor’s power plant allows a supplier to raise the market price this could be called an abuse of market power. However, there are already laws against arson, so it seems redundant to have a law that says that a supplier can’t use arson to raise market prices. Another view of abuse of market power is that it involves exercising excessive amounts of unilateral market power, but this view fails prey to the problem that one’s definition of excessive market power depends on one’s perspective. A more vexing question that must be answered in order to make a legal determination that firm has abused its market power is a finding of intent on the part of the market participant. 78
Specifically, did the firm by its unilateral actions intend to abuse its ability to exercise unilateral market power? For example, a firm could earn revenues vastly in excess of its variable costs, thereby achieving what many might call excessive profits. However, determining that the firm accomplished this by intentionally abusing its ability to exercise unilateral market power is extremely difficult to do without a clear definition of what combination of unilateral actions and market outcomes constitute the abuse of market power and whether there other ways for these market outcomes to occurs without the supplier’s intentional actions. For all of these reasons, I believe that attempts by regulatory bodies or market monitors to find entities that abuse their market power or manipulate the market and punish these market participants is very unlikely to have economic benefits that exceed the administrative and legal costs of these actions. This approach is also unlikely to provide incentives for market participants to improve system reliability or overall market efficiency. The procedure devised by the CSMEM for detecting abuse of market power provides compelling example of how difficult it is to determine if supplier has abused its market power. The CSMEM procedure is firmly grounded in economic theory and provides strong evidence that the supplier in question has both the ability to exercise unilateral market power and intended to exercise its unilateral market power. The CSMEM procedure first sets a critical value on the inverse elasticity of the residual demand curve that the supplier faced. If the supplier’s actual inverse elasticity exceeds this critical value then the supplier is deemed to have a significant ability to exercise unilateral market power. This methodology is clearly consistent with the theoretical framework developed in Section 2. The second step of the CSMEM procedure compares the actual market price with a counterfactual market price computed using the supplier’s offer prices from the previous day. If the actual price exceeds this counterfactual price then the supplier’s change in offer price from the previous day is determined to have been profitable. This step of the methodology provides strong evidence that the supplier’s actions to raise the market price were intentional. However, the missing evidence is whether these intentional actions to raise the market price constitute an intentional abuse of market power or are simply the result of the legal exercise of unilateral market power. For this reason, I propose focusing the market monitoring and regulatory oversight process on limiting the economic harm that consumers are subjected to by actions that regulators and market monitors might think constitute the abuse of market power. Rather than focus on preventing the exercise of unilateral market power or the abuse of market power the regulatory process should focus on preventing market participant behavior that is detrimental to system reliability and wholesale market efficiency. This process attempts to implement the following cost-benefit criteria. If the economic benefits an individual supplier or groups of suppliers receives from a unilateral action is less than the economic costs that this action imposes on all other market participants, then this behavior should be eliminated because it is degrading overall market efficiency. There are two types of behavior that fall into this category. The first is just factual violations of market rules. For example, if supplier fails to make its capacity available to the 79
market when there is contract that says they should, then the supplier should pay the fine stipulated in the contract. The second type of behavior is the more nebulous behavior that regulators and market monitors might think is market power abuse or market manipulation. 5.3. Ensuring Compliance with Market Rules Profiting from market rule violations does not require the ability to exercise unilateral market power because small firms with no ability to exercise unilateral market power can profit market rule violations if the market rules are poorly designed. Nevertheless, these actions can degrade both system reliability and market efficiency. This section provides guidelines for designing market rules that ensure market participant compliance. The primary mechanism for ensuring compliance is penalties or sanctions for market rule violations. This penalty and sanction mechanism should focus primarily on verifiable market rule violations. Determining a market rule violation should involve as little judgment as possible on the part of the market operator or regulator. An analogy to a speeding ticket is useful. If the regulator measures the speed of the car using a publicly verifiable measuring device and finds that the car’s speed exceeds the posted limit, then the regulator should assess a pre-specified penalty. The penalties and sanctions process should not involve a finding of intent in order for the regulator to assess a penalty. An example of a market rule violation covered by this mechanism is a failure to comply with contractual terms implied by a bid into the wholesale market. One example is a market participant submitting an offer to supply given quantity of energy within a given response time and failing to meet this response time—the supplier offers to provide 50 MWh of energy in 10 minutes from the time the unit is called. If the supplier fails to provide any of the purchased energy when it is called upon, the unit owner should be penalized for failing to meet this contractual commitment. The California market provides a concrete example of the increased costs of system operation that can result from the system operator not having the ability to ensure compliance with its market rules. During the first three years of operation of the market, suppliers would often refuse dispatch instructions from the real-time market operator based on offers they submitted. Refusing a dispatch instruction can be a very effective mechanism for a supplier to raise the market price. For example, a supplier might receive a dispatch instruction for 100 MWh from a unit with an offer price of $50/MWh. Suppose that this supplier also has an offer for 30 MWh at $100/MWh and 70 MWh at $300/MWh and it knows that there are very few MWhs offered in above $50/MWh. Consequently, it would be expected profit-maximizing in the absence of penalties for violating market rules, for the supplier to refuse to respond to the dispatch instruction for 100 MWh at $50/MWh in hopes of having the 30 MWh at $100/MWh accepted and set the market price or a portion of the 70 MWh at $300/MWh taken and set the market price. Although this incentive to refuse dispatch instructions exists in all markets, it was especially problematic in California because this behavior would impact the price the supplier would receive for all output sold in the real-time market. Particularly during the period May 2000 to June 2001 many suppliers sold a substantial amount of their output in the real-time market with no forward contract coverage, so that virtually all of their output was paid this elevated price. Besides raising the market price, suppliers refusing to respond to dispatch 80
instructions required the California Independent System Operator (CAISO) to carry more generation reserves because they could not be sure that all of the bids in the real-time market would respond to a dispatch instruction. The CAISO also had to make purchases outside of formal market mechanisms to ensure that enough energy was available to meet demand, which further increased the cost of wholesale energy. A second guideline for ensuring compliance with the market rules is that the penalty for a market rule violation should be sufficiently high to make it unilaterally unprofitable for a market participant to violate the rule. During the early years of electricity re-structuring in the United States, the Federal Energy Regulatory Commission (FERC) limited the magnitude of the penalties a supplier had to pay for violating the market rules to the profits gained from this violation. Under this penalty scheme, firms had little to lose from violating market rules because their violation may not be detected and, even if it is detected, they are not made any worse off than if they had followed the rules in the first place. Clearly, larger penalties to deter market rule violations were necessary and eventually FERC implemented these sorts of penalties. The third guideline is that the mechanisms for imposing penalties and sanctions should be set in advance and the relationship between a specific market rule violation and the amount of the penalty assessed should be as transparent as possible. Returning to the above example of failing to comply with a dispatch instruction, the system operator could require that the supplier either find a like replacement for the power the unit is unable to provide or require the owner to make the payments necessary to hold harmless all market participants for its failure to meet its contractual obligations. Making the relationship between a specific market rule violation and the penalties assessed as transparent as possible achieves two goals. First, it limits the opportunities for the system operator and regulator to exercise discretion in setting penalties. Second, it allows market participants to formulate the best possible cost-benefit assessment associated with a specific market rule violation. The fourth guideline is that the penalty associated with a market rule violation should not exceed the harm this market rule violation causes to all market participants. This guideline addresses the tendency regulators often have to set penalties sufficiently high to deter market participants from engaging in behavior that has any likelihood of violating the market rules. However, excessive penalties also have a cost. They cause market participants to focus on avoiding being penalized for a market rule violation rather than on producing electricity in a least cost manner or purchasing wholesale electricity in a least cost manner. For example, setting the penalty for failing to respond to a dispatch instruction too high could cause suppliers to avoid participating in the wholesale market or to downgrade the maximum amount of energy they are willing to sell from each of their generation units. 5.4. Persistent Behavior Detrimental to System Reliability and Market Efficiency This section describes a general mechanism for determining if a supplier engages in persistent behavior detrimental system reliability and market efficiency and what the appropriate standards are for determining when market operations should be suspended. Electricity markets are, by definition, centralized market mechanisms where the actions of some market participants can impact the ability of other market participants to sell their output or buy the energy necessary to serve their retail customers. There can only be a one market operator for each transmission 81
network. The need to deliver energy through a common transmission and distribution network suggests that all market participants have a common interest in preventing behavior that significantly degrades system reliability and market efficiency because it reduces their expected profits from participating in the wholesale market. This aspect of the market monitoring/regulatory process addresses the concerns typically voiced by parties claiming market manipulation or abuse of market power, but it avoids the virtually impossible task of demonstrating that a market participant actually manipulated the market or abused their market power. Whether actions constitute market manipulation depends on one’s perspective. Viewed from one perspective, all suppliers that attempt to impact the price they are paid through their own unilateral actions are engaging market manipulation. The extent of unilateral market power possessed by a supplier is typically measured by its ability to move market prices through its unilateral actions. Consequently, a blanket prohibition of market manipulation written into the market rules seem to prohibit suppliers from maximizing profits given the actions of their competitors, actions that will lead to market outcomes that benefit consumers when all suppliers face sufficient competition. This is why there is no explicit prohibition against market manipulation under United States antitrust law—it amounts to prohibiting behavior that is a major driver of the benefits of competitive markets. The prohibition of behavior that is detrimental to system reliability and market efficiency focuses on identifying and eliminating detrimental behavior by market participants, rather than on punishing this behavior. Penalties and sanctions are a last resort, when all other options for eliminating the behavior have been tried; including asking the market participant to stop because of the significant harm this behavior is imposing on other market participants. There is a potential downside to giving the regulator the ability to make such a finding. To the extent that the regulator is influenced by the political environment, it may be tempted to intervene to pursue political ends rather than allow politically favored electricity retailers to pay higher prices for electricity or politically favored suppliers to receive lower prices for the electricity they produce. That is why the regulator must follow a well-defined process before it is allowed to make a finding of persistent behavior harmful to system reliability and market efficiency or to suspend market operations temporarily. The major difficulty associated with implementing this market rule is that the regulator would have to infer from a market participant's behavior whether it is offering or operating its capacity in manner intended to harm system reliability or market efficiency. If the regulator or market monitor identifies behavior that is detrimental to system reliability and has direct evidence, such as a written confession, that the market participant engaged in this behavior with full knowledge that it significantly harmed system reliability or market efficiency, penalties may be imposed without first going through the administrative process described below. However, it seems very unlikely that the regulator would have direct evidence of intent, particularly if there is a market rule that imposes significant penalties on the market participants that have been shown to have engaged in this type of behavior. Enforcing a "behavior detrimental to system reliability and market efficiency" provision is more difficult if this market rule also imposed the very reasonable requirement that this detrimental behavior must also have 82
a significant impact on market outcomes. This would require the regulator to make the often very subjective determination of what constitutes a "significant" market impact. Despite these difficulties with determining “intent” and “significant market impacts,” an administrative procedure along the lines discussed below can adequately address these complications in making the finding of "intent to impose significant harm." 5.4.1. Determining intent to harm system reliability or market efficiency A necessary first step in any process to determine intent is the ability to demand and receive information from market participants. This reinforces the need for a pre-condition for participation in the wholesale market that each entity agree to provide, in a timely manner, all information necessary for the regulator to undertake an investigation of intent to cause significant harm to system reliability or market efficiency. As discussed above, this agreement to provide information should be subject to the constraints that the information request is necessary to undertake the current investigation and it does not impose costs on the market participant that are out of line with the alleged harm that the market participant is imposing. The regulator should implement the following multi-stage process for determining intent and impose penalties commensurate with the harm caused by these actions. It is counterproductive for the regulator to prohibit actions that are difficult to define and even more difficult to determine if they occur, such as market power abuse or market manipulation. Prohibiting these ill-defined activities without first finding “intent” and “significant harm” will cause market participants to avoid behavior that often enhances market efficiency and system reliability that might be interpreted as one of these prohibited actions. Instead, the regulatory process for determining intent should recognize that it is extremely difficult to distinguish legitimate profit-maximizing behavior from actions that intend to harm competition and market efficiency without some exchange of information between market participants and regulator. In addition, behavior that might be interpreted by some observers as market power abuse or market manipulation is often rendered unprofitable by the actions of other market participants. Consequently, these sorts of market efficiency or system reliability problems can often be solved through information provision to the market at large, thereby eliminating the need for further action. A key feature of this market rule is a transparent process for identifying intentional behavior detrimental to system reliability or market efficiency. This should include a process for taking the actions necessary to stop this behavior or the harm that it causes. The focus of this process should be on stopping, as quickly as possible, intentional behavior that the regulator determines causes significant harm to market efficiency and system reliability. The first step in this process is to identify behavior that is likely to harm to market efficiency or system reliability. Two findings are necessary for the process to continue to the next step. The regulator must first determine if this behavior is persistent, and if it has the potential to impose significant harm either because it is persistent or extremely harmful when it does occur. The next stage of the process involves alerting all market participants to the existence of this behavior and publicly disclosing the identity of the market participant engaging in it. The goals of this stage of the process are to subject this market participant to public 83
scrutiny and to provide all market participants with information that they can use to take actions that attempt to render this behavior unprofitable. Public disclosure is very important step in the process of determining intent because all market participants, including the market participant engaging in the behavior, know that the regulator has publicly stated that this behavior is harmful to system reliability or market efficiency. Consequently, continued behavior by this market participant that imposes significant harm provides strong evidence in favor of a finding of “intent to harm.” In most cases, this stage of the process will put an end to the behavior or the harm it causes. However, in those instances when the actions are sufficiently profitable to the market participant or group of market participants that they continue to cause significant harm, the regulator should initiate a formal investigation of intent. To do this the regulator needs the ability to request and receive in a timely manner the information from the offending market participant necessary to make a credible determination of intent to impose harm. An important goal of this information gathering effort is for the market participant to provide information to the regulator demonstrating that there is no direct causal link between market participant’s behavior and harm to system reliability or market efficiency. If the regulator’s information gathering efforts reveal substantial evidence of a direct causal link between this market participant’s behavior and the presumed harm, then the regulator should find that this market participant did intend to harm system reliability or market efficiency. If there is an affirmative finding of intent, the regulator may need to collect additional information to determine the appropriate magnitude of penalties. The requirement to provide this information would be a contractual obligation between the system operator and each market participant that is a pre-condition for participation in the market. For this reason, the regulator should have the authority to impose penalties on this market participant for failure to comply with reasonable and necessary information requests in a timely manner. The willingness of each market participant to be subject to these penalties should also be a pre-condition to participation in the wholesale market. If the regulator makes an affirmative finding of intent it would then be required to set the appropriate level of penalties. These penalties should be at least as large as the harm caused by the market participant’s actions. The results of the investigation and the regulator’s rationale for its recommended level of penalties should be subject to judicial review. As should be clear from the above discussion, the major focus of this process is on eliminating the harmful behavior as soon as possible, not on assigning blame or imposing penalties. Only when public disclosure of the actions and the regulator’s own investigation fails to stop or eliminate the harm associated with this behavior should the regulator attempt to determine intent and assign penalties for this behavior. 5.4.2. Suspension of market operations To guard against the possibility that there may be circumstances when the unilateral profit-maximizing actions of market participants can lead to enormous harm to consumers, the regulator should have the ability to suspend market operations temporarily. An example of such 84
a mechanism is the “guardrails to competition” approach discussed in Wolak (2003c). This mechanism relies on the competitive benchmark analysis discussed in Borenstein, Bushnell, and Wolak (2002). It sets a prospective measure of the extent to which electricity prices over a rolling 12-month horizon can exceed the competitive benchmark level. If the difference between the quantity weighted average market price over the previous 12 months exceeds the quantity weighted average competitive benchmark price computed using the methodology outlined in Borenstein, Bushnell, and Wolak (2002) over the previous 12 months by more than $5/MWh then an automatic regulatory intervention would be triggered. In Wolak (2003c), I argue that this intervention should be a 12-month period of cost-ofservice prices for all suppliers. The idea behind this intervention is that it is viewed as sufficiently Draconian, yet credible to implement, so that suppliers never allow this benchmark to be violated. For example, rather than exercise substantial market power in the spot market, a supplier will sign forward contracts or other spot price hedging arrangement to improve spot market performance before these guardrails are exceeded. 5.4.3. Prevention of consumer harm The important message to take away from this discussion is that attempting to determine market power abuse or market manipulation is an extremely difficult and administratively challenging task. Instead, the regulatory process should focus on preventing the adverse effects of this sort of behavior, the harm to consumers of electricity. A temporary high price that may be the result of a supplier taking advantage of a transitory transmission outage or reliability constraint does cause significant harm to consumers relative to a sustained period of high prices caused by a supplier or group of supplier persistently behaving in a manner that reduces system reliability or wholesale market efficiency. For this reason, the regulatory process should focus on preventing these sorts of outcomes and not be as concerned with finding and punishing instances of the abuse of market power or market manipulation. As noted earlier, all market participants have a common interest in enhancing grid reliability and market efficiency, attempts to find and punish market power abuse and market manipulation can run contrary to achieving these goals.
5.3. The Role of Independent Market Monitoring Committee The independent market monitoring committee such as the CSMEM is perhaps the most important contributor to providing “smart sunshine regulation” for the Colombian electricity supply industry. It is extremely time-consuming and technically challenging to understand how the electricity supply industry operates. For the average consumer or journalist, the amount of technical know-how needed to make an informed judgment about how the electricity supply industry is performing is far beyond their technical abilities. However, because of the essential role that electricity plays in the lives of most consumers, it is important that citizens believe that a wholesale electricity market is benefitting them relative to what would be possible under an alternative industry structure. This is where an independent monitoring committee such as the CSMEM can play a very important role. They have the technical expertise necessary to understand how the market works. More important, they have no economic stake in the market and therefore can be relied 85
upon to provide an unbiased assessment of how the market is performing. Independent market monitoring committee can take the raw data submitted to the market and produced by the market and present it in compelling manner to make their points about how the market is performing. They are the “honest brokers” in the market oversight process that the press, the political process, and the public at large can rely on for an unvarnished analysis and assessment of how the market is performing. For this reason, the independent market monitoring committee must have access to market data and all confidential data collected by the regulator immediately. They must also have the freedom to perform analyses that they view as necessary to assess the performance of the market. Their credibility as an “honest broker” will be severely undermined if they do not have immediate access to this information. To the extent that the information they receive is limited relative to what the regulator receives, claims can be made that any analysis they perform is incomplete or lacking because it does not account for this missing information. The value of these analyses is that they are as comprehensive as necessary to answer the question posed, so the utmost effort should be devoted to providing the committee with the best information possible. If there are concerned about confidentiality then limitations can be placed on how the results of their analysis are released. For example, summary statistics do not reveal confidential can be presented, but the committee should not be denied the ability to work with confidential data that the regulator has access to, or its credibility and usefulness will be undermined. Besides performing these analyses of the market performance a second role of the monitoring committee is disseminating the results to the public. To this end, it is very important that the committee come up with a set of vital signs to measure the health of a market similar to a patient’s pulse and blood pressure. The idea is to develop these indexes on the health of the market and explain their meaning to stakeholders, the public, the press, and the political process so that all of these entities can become more adept at understanding when the market is in poor health. Computing and reporting these indexes in a consistent manner over time can help to provide valuable input to the market design process. Substantially different values for these indexes relative to their typical levels can help the regulator and independent market monitor diagnose the problem with the market and suggest solutions that are more likely to improve market performance. The market monitoring committee can also perform analyses of market outcomes that justify a proposed market rule change. A more important role for the committee is to demonstrate that a proposed market rule change is unnecessary, which can save the regulator and market participants significant costs. Implementing market rules changes without a clear empirical basis that a problem exists and the proposed solution will address it, could harm rather than improve market performance. There are many examples of these sorts of market rules changes from wholesale markets around the world. Given the tremendous amounts of data available from these markets and the increasing technical expertise to analyze it, making decisions without a firm theoretical and empirical basis has a significant downside. A market monitoring committee with the technical expertise and access to data necessary to undertake these analyses can limit the number of unnecessary or harmful market rule changes.
86
The major lesson from more than 20 years of electricity industry re-structuring is that process of continuous improvement in the market design and regulatory oversight process is necessary. After a market design challenge is solved, the market participants respond and another arises. The independent market monitor is a key component of this process of continuous improvement. Its role is to monitor the vital signs of the market, provide both empirical and theoretical analysis of these vital signs and provide the results of this analysis to the regulatory process, the political process, the press, and public at large in manner that can collect these entities to take actions to produce market outcomes that benefit all electricity consumers. An important area where the independent market monitor can provide valuable input to the process of continuous improvement is in regulatory oversight and market and system operation. The independent market monitor can provide analysis of the behavior of these entities that can be used to improve how they function to better serve the interests of electricity consumers and producers. A significant fraction of the analyses market performance by independent market monitors in the United States are devoted to providing suggestions for improving regulatory oversight and market and system operation. An important aspect of the independent market monitor’s role as an honest broken in the process of continuous improvement of the market is interacting with and soliciting input from stakeholders. Specifically, an important potential role for an independent market monitoring committee such as the CSMEM is to have periodic meetings with stakeholders to review the performance of the market and hear their concerns. Hearing different perspectives on an issue in a public forum and having the opportunity to question stakeholders allows the independent market monitoring committee to obtain the complete picture of an issue. After soliciting input from stakeholders and the market and system operator, the independent market monitoring committee can provide a more comprehensive and credible analysis of the issues and provide a more effective remedy. Another important component of serving as an honest broker in the market design and oversight process is that an independent market monitoring committee such as the CSMEM should have no formal powers to issue penalties or sanctions or determine if a supplier has abused its market power or manipulated the market. All of these determinations should be left to the regulatory process because they involve subjective judgments which must involve due process. Instead, the independent market monitoring committee should restrict itself to providing fact-based theoretical and empirical analysis of the market performance and of perspective market rule changes. All of the power of the committee should come from the force and logic of its analysis and arguments. If the committee is granted formal decision-making authority, once it makes a decision, it loses some of its ability to be an impartial analyst. It now has past decisions that it would like to justify as correct, which implies that it may no longer have an incentive provide an unvarnished assessment of the performance of the market. To avoid the appearance of a lack of objectivity and impartiality, it is essential that the independent market monitoring committee have no formal powers beyond the ability to have access to all data the regulatory process has access to and the ability to issue analyses of market performance and opinions on proposed market rule or regulatory oversight changes to the public. 87
Although it has no formal powers, an independent market monitoring committee such as the CSMEM should still have the ability to make recommendations to regulatory authorities relating to these issues. For example, if the regulator decides to implement a market power mitigation mechanism based on some critical value of the inverse elasticity of the residual demand curve, I would expect the independent market monitoring committee to provide recommendations on the appropriate value. If the regulator is deciding to implement a market rule change, I would expect the independent market monitoring committee to provide an opinion on the advisability of this market rule change. However, it important to recognize that these recommendations should be based on market efficiency and system reliability concerns. Equity concerns should be the domain of the regulatory process, because determinations of equity require due process.
6. Broader Electricity Industry Issues There are two issues raised by stakeholders that are not directly related to the operation of the short-term market that still impact the long-run performance of the electricity supply industry in Colombia. The first is concerned with the operation of the natural gas market in Colombia. Natural gas drives the majority of fossil fuel-fired generation units in Colombia. Recently, there have been a number of complaints by stakeholders about gas availability and pricing for electricity generation. This section argues natural gas pricing and regulation in Colombia introduces a significant source of inefficiencies in the operation electricity supply industry. I suggest changes to the regulatory oversight and pricing process to address these market inefficiencies. The second topic is the standardized fixed-price forward contracts market proposed by the CREG called the MOR. The MOR has the potential to significantly reduce the risk of extreme wholesale price events and increase the competitiveness of both fixed-price forward contract market and the short-term energy market. However, I believe several modifications of the proposal are necessary to achieve these goals. I discuss these modifications and the rationale for them.
6.1. Natural Gas Pricing in Colombia The price of natural gas sold by Ecopetro from the Gaujira field is set by the CREG using a formula based on the price of New York Harbor fuel oil. This pricing formula is used in spite the fact that Colombian natural gas can only be sold in Colombia and Venezuela. Moreover, the price of New York Harbor fuel oil fluctuates with the world price of oil, which bears little relation to the cost of exploring, drilling for, and extracting natural gas in Colombia. This indexing scheme introduces substantial unnecessary volatility in the price of natural gas in Colombia with little, if any, corresponding economic efficiency benefits for the natural gas or electricity supply industries. The price of natural gas set according to this formula is not the opportunity cost of using this Colombian natural gas. Setting the price of natural gas according to this formula is similar to setting the opportunity cost of water in Colombia based on the wholesale price of electricity in New York. Although it is true that wholesale price of electricity in New York can be used to determine the opportunity cost water in New York, water stored in Colombia cannot be sold as 88
electricity in New York. Because Colombia does not have a liquefied natural gas export facility, Colombian natural gas also cannot be sold as electricity in New York or used to displace fuel oil consumed in New York. This natural gas pricing policy is simply a wealth transfer from electricity producers and consumers to natural gas producers, the magnitude of which changes based on the behavior of the world price oil, which is largely unrelated to cost of extracting natural gas in Colombia. Any stable price that recovers Ecopetrol’s total cost producing natural gas would have superior market efficiencies properties for the electricity supply industry, because it would be lower than the average natural gas price computed using existing formula and substantially less volatile. This price would have the additional economic benefit of making natural gas-fired electricity less expensive and better able to compete against with hydroelectric energy suppliers in the shortterm market. Natural gas-fired electricity generation unit owners would be subject to far less input fossil-fuel price risk and be more willing to sign fixed-price long-term contracts with electricity retailers because of this. Both of these factors would significantly improve the performance of the wholesale electricity market. One possible pricing formula that would achieve these goals is if the CREG committed to a price in year t that is equal one plus the percentage increase in the consumer or producer price index during year t-l times the price in year t-1, or mathematically, P(t) = P(t-1)(1+X(t-1)), where P(t) is the price of natural gas in year t and X(t-1) is rate of change in the consumer or producer price during year t-1. For example, if the price this year is $5/MCF and rate of aggregate consumer or producer price inflation over the past year is 20 percent, next year’s price would be $6/MCF. A commitment to this pricing formula into the distant future would stabilize natural gas prices in the current year and in future years and improve the performance of the short-term market and long-term contracting market for electricity. In addition to allowing natural gas producers to recover their exploration, drilling, and production costs, this pricing formula would reduce their incentive to withhold natural gas from the wholesale market. This pricing formula would give natural gas producers far greater certainty about what they could sell their natural gas for in future years relative to the existing pricing formula that is tied to the very volatile world price of oil. Because of the significant future price volatility built into current pricing formula, Colombian natural suppliers currently have an incentive to withhold output during lower-priced periods so that they can be assured of having sufficient supplies to sell during the higher priced-periods. In general, uncertainty in the regulated price of natural gas creates incentives for natural gas suppliers to withhold their natural gas from the market in the current period for the prospect of sales at high natural gas prices in the future. Consequently, a general recommendation for natural gas regulation in Colombia is to commit to greater future natural gas price certainty. If all natural gas suppliers know the price they will receive for selling natural gas into the distant future, they will have less incentive to withhold natural gas from existing natural gas-fired generation unit owners for the prospect of sales at high natural gas prices in the future. Until the natural gas transportation infrastructure in Colombia and neighboring countries is enhanced to allow sales of natural gas throughout Latin America or a liquefied natural gas export infrastructure is developed for Colombia, the price of 89
natural gas in Colombia must remain regulated. To ensure that natural gas price regulation benefits Colombian natural gas and electricity consumers, as much future price certainty as possible should be introduced. For example, CREG could commit the pricing formula for field j of P(t,j) = P(t-1,j)(1+X(t-1)), where P(t,j) is the price of natural gas for field j in period t. The initial price in period t=0, P(0,j), would be set individually for each field to ensure full cost recovery. The CREG would commit to these pricing formulas until it determined the transportation infrastructure was sufficient to support a competitive wholesale market. At that time, the price of natural gas could be set through market mechanisms. The United States natural gas market followed a very similar pattern of development, where initially there was wellhead price regulation until an adequate natural transportation network existed in the United States to allow wellhead price de-regulation. The market pricing of natural gas subject with regulated pricing of natural gas transport is the current wholesale natural gas pricing paradigm throughout Unites States.
12
300
10
250
8
200
6
150
4
100
2
50
0 Jan 2003
NY Residual Fuel Oil price (UScents/gallon)
Wellhead natural gas price (US$/MCF)
Figure 6.1: Regulation of Colombian wholesale natural gas price, 2003–2009
0 Jan 2004
Jan 2005
USgas
Jan 2006
Jan 2007
Colombia gas
Jan 2008
Jan 2009
USfuel oil
Source: Ecopetrol (Guajira regulated wellhead price), Energy Information Administration (US oil and natural gas prices). Colombia gas and US fuel oil prices: monthly, Jan 2003 to Jun 2009. US natural gas prices: monthly, Jan 2003 to Apr 2009.
6.2. Centralized Market for Standardized Forward Contracts for Energy A centralized market for standardized forward contracts for energy could improve the performance of the short-term energy market and provide insurance against water supply shortfalls and high-priced periods due to El Nino events. However, there are a number of features of the standard forward market for energy proposed by the CREG, known as the MOR, that should be re-considered in order to achieve these goals. First, regulated energy procurement efforts should focus on the forward market for energy more than three years into the future. 90
Second, retailers should be able purchase more or less than their expected future demand for electricity in the MOR forward market. Finally, the clearinghouse function of the MOR should account for the divergent sizes and financial conditions of participants. 6.2.1. Missing forward markets in Colombian electricity supply industry Historically, there has been no prohibition against an independent entity establishing a centralized market for standardized forward contracts for electricity in Colombia. At any time since the start of the market, an entrepreneur could have designed standardized fixed-price forward contracts, establish a centralized exchange for trading these contracts, and charge market participants for the services this exchange provides. The fact that such market does not exist provides strong evidence that the revenues an entrepreneur could earn are insufficient to recover the costs of setting up and operating this centralized forward market. Consequently, any economic argument for establishing a centralized market for standardized fixed-price forward contracts must be based on the logic that there are societal benefits from having such a market that cannot be captured by the private entrepreneur. Two potentially significant sources of societal benefits from the existence of a centralized market for standardized fixed-price forward contracts that cannot be captured by a private entrepreneur are: (1) an improved ability to set the regulated price of wholesale electricity that retailers are allowed to pass-through in the final retail price they charge to regulated customers, and (2) an increased volume of transactions in forward market products with a societal benefits greater than the total private benefits. A market for standardized forward contracts will set prices for energy to be delivered at pre-specified dates in the future through a formal market-clearing mechanism with publicly observable prices rather than through bilateral negotiations. A major problem with using individually-negotiated bilateral contract prices to set a retailer’s regulated wholesale price is that, as noted in Section 2, several retailers own a significant amount of generation capacity or have affiliates that own a significant amount of generation capacity. Consequently, these retailers may not have the strongest possible incentive to negotiate the lowest possible contract price with their affiliates, because a higher forward contract price would result in a higher regulated retail price. Using forward contract prices set through a publicly observable auction mechanism that all retailers in Colombia participate in is less likely to be subject to this criticism because all buyers and sellers of the same forward contract sold in the centralized market pay the same market-clearing price. Because of this incentive, the average forward contract price paid by retailers for purchases through in the centralized market for standardized forward contracts market may be less than the average forward contract price paid by retailers through bilateral forward contract purchases. No private entrepreneur could capture this source of benefits to final electricity consumers because the market operator only earns revenues from the trading charges paid by market participants and not from the fact that average forward contract prices are lower because this market exists. This is the first source of societal benefits from a centralized forward market that a private entrepreneur cannot capture. It is generally acknowledged that most important reliability challenge in the Colombian electricity supply industry is ensuring an adequate supply of energy at reasonable prices during an El Nino event. As discussed in Section 2, the least-cost way to maximize the likelihood that 91
this goal will be achieved is to have a significant fraction of final electricity demand hedged in fixed-price forward contracts for energy signed far enough in advance of delivery to allow new entrants to compete to sell this electricity. For sizeable natural gas-fired and coal-fired power plants, the time necessary to site, construct, and bring on-line a new generation unit is typically in excess of two years. For hydroelectric plants, the time lag between the decision to site the plant and when it begins operation can be substantially longer than three years. Consequently, in order to allow a significant number of new entrants to compete to sell fixed-price forward contracts for energy, these contracts must be signed at least three years in advance of delivery. Existing and new generation unit owners can be expected to be willing to sell fixed-price forward contracts that begin delivery three or more years in the future. However, without explicit regulatory intervention, there is likely to be very little demand for these contracts from final electricity consumers. Final consumers may want electricity price certainty for the next one or two years, but beyond that time horizon the demand from retail electricity consumers for wholesale price hedging instruments is likely to decline. For example, many of these consumers may not even expect to be living in the same hour more than two years in the future. Consequently, despite the strong reliability justification that fixed-price forward contracts signed three or more years in advance of the delivery date provide insurance against El Nino events, the demand for these fixed-price forward contracts is unlikely to be large enough to provide adequate insurance against an El Nino event. This logic implies that a second justification for a centralized market for standardized fixed-price forward contracts market is that it can provide a straightforward mechanism for the CREG to ensure that Colombian retailers purchase adequate insurance against El Nino events. This would be accomplished by the CREG mandating that each retailer purchase prespecified minimum quantities of standardized fixed-price forward contracts starting delivery in three or more years in the future. For example, each retailer could be required to purchase certain minimum fractions of its current demand in fixed-price forward contracts beginning delivery three, four, and five years in the future. Retailers could purchase more than this minimum amount, but at the conclusion of each auction, each retailer must verify that is has purchased at least the pre-specified minimum quantity of the standardized fixed-price forward contract at each delivery horizon three years and beyond. Retailers that purchase more than this minimum quantity can sell it at a later date or hold it as a hedge against its wholesale energy purchases from the short-term market. Insurance against an El Nino event is provided by the fact that a significant fraction of the wholesale price risk associated with purchasing the aggregate demand for electricity in Colombia has been hedged at a delivery horizon that allows new entrants to compete to provide this energy. Consequently, if an El Nino event occurs or is determined to be extremely likely to occur one to two years in the future, the short-term price of electricity could be expected to increase, but electricity retailers and final electricity consumers are protected because they have hedged the majority of their short-term price risk in standardized fixed-price forward contracts in advance of the date that the El Nino event is known to have began. This logic also illustrates why the societal benefit argument is not as compelling for establishing a standardized forward contracts market to trade products that begin delivery less 92
than or equal to two years in the future. Retailers have a much stronger incentive to sign fixedprice forward contracts delivering energy one to two years in the future because final consumers are willing to make commitments to purchase energy up to two years in the future. Thus, there is significantly less need for explicit regulatory intervention to ensure that there is adequate demand for these products by retailers. In addition, mandating that retailers purchase a significant fraction of their final demand in fixed-price forward contracts at delivery horizons less than or equal to two years into the future may not provide insurance against an El Nino event, if the existence of an El Nino event is recognized before a significant fraction of final demand has been hedged. The following example provides a justification for the previous sentence. Suppose that an El Nino event is determined to have occurred or is predicted to occur within in the next year. Suppose that El Nino events are also know to last one year. Suppliers recognize that an El Nino event results in substantially less water available to produce electricity and this implies higher short-term electricity prices because fossil fuel units will produce a larger share of the electricity consumed and because of increased ability all suppliers have to exercise unilateral market power in the short-term market. Under these assumptions, any fixed-price forward contract negotiated for delivery at a horizon less than two years in the future should be at a price that is at least as high as the average short-term price that suppliers expect to exist over the delivery period of the contract. For example, if suppliers expect that average short-term prices will be $80/MWh over the next two years because of the El Nino event, then any fixed-price forward contract making deliveries over this time period will sell at a price of at least $80/MWh, in order to compensate the supplier for the short-term market revenues it expects to receive over the duration of the fixed-price forward contract. For this reason, purchases of standardized forward contracts at delivery horizons less than or equal two years into the future is unlikely to provide insurance against an El Nino event. Because these events can be predicted up to one year in advance and they are expected to last up to one year, retailers purchasing fixed-price forward contracts will simply pay for the market power suppliers expect to be exercised in the short-term market over the next two years in the fixed-price forward contracts they purchase. However, if a substantial amount of new generation capacity could be brought on line in less than two years, then El Nino insurance could still be provided by fixed-price forward contracts purchased far enough in advance for potential new generation unit owners to compete to provide this energy. Because it actually takes longer than two years for a substantial amount of new generation capacity to be brought on line and time between the recognition of an El Nino event and the time that its impacts are no longer felt by the short-term electricity market can be at least two years, only fixed-price forward contracts purchased more than two years in advance of delivery can provide wholesale price insurance for final consumers against an El Nino event. The societal benefit argument for a centralized market for standardized fixed-price forward contracts in Colombia implies that CREG should focus its efforts on developing an active market for fixed-price forward contracts starting delivery more than two years in the future. This centralized market could also trade products starting delivery two years or less in the future. Most of the supply of fixed-price forward contracts starting delivery in two years or less should come from holders of fixed-price forward contracts purchased in previous years, rather than through the sale of new fixed-price forward contracts. 93
6.2.3. The role of multiple buyers in the forward market To ensure that prices in the MOR reflect competitive conditions in the market for fixedprice forward contracts at each delivery horizon, the buyers of fixed-price forward contracts should have the maximum flexibility to purchase more or less than their expected demand for wholesale electricity, subject to at least purchasing the minimal amount needed to provide insurance to final consumers against an El Nino event. The current MOR requirement of a single buyer of these fixed-price forward contracts purchasing a pre-specified inelastic demand at each delivery horizon enhances the ability of suppliers to exercise unilateral market power this market. With a single buyer purchasing a fixed quantity of energy regardless of the market price as specified in the current MOR proposal, the only source of residual demand elasticity faced by any supplier is the price offers of its competitors. Allowing retailers to determine the amount they would like to purchase at each delivery horizon subject to the requirement that its holdings are above the regulatory minimum for each delivery horizon would increase the elasticity of the residual demand curve faced by all suppliers for all of the fixed-price forward contracts they sell. This would reduce the amount of unilateral market power suppliers are able to exercise in the market for standardized fixed-price forward contracts. For example, a retailer could purchase more fixed-price forward contracts for energy beginning delivery four years from now than its expected demand for wholesale energy four years from now if it believes that the current forward price for energy is less than it expected the short-term energy price to be four years from now. These actions are the first way that allowing retailers to purchase forward contracts for energy with some flexibility to alter their demand increases the elasticity of the residual demand that each supplier faces. The second mechanism that increases the elasticity of the residual demand curves that all suppliers face is due to the fact that retailers are also able to resell previously purchased fixedprice forward contracts if they hold more than the minimum amount of contracts required for that delivery horizon. For example, a retailer could buy contracts for delivery four years in the future and hold them and sell some of them the following year in the market for contracts beginning delivery three years in the future. This increased source of supply for contracts beginning delivery three years in the future would increase the elasticity of the residual demand curve that all suppliers face for selling this product, which reduces the amount of unilateral market power they are able to exercise. Granting retailers more flexibility in when and where they purchase their hedges for short-term wholesale price risk does not limit the ability of the CREG to use MOR prices to set the wholesale price of energy implicit in a regulated retail price. The CREG could simply define a pre-specified index of MOR prices for a given delivery period and this price would be the regulated wholesale price implicit in that retailer’s regulated retail price. Retailers would be free to purchase fixed-price forward contracts sold on the MOR or enter into other hedging arrangements outside the MOR as long as they maintained the minimum holdings of MOR contracts mandated by the CREG at each delivery horizon. However, if its other forward contract trading activities allowed a retailer to reduce the average price it paid for wholesale
94
energy, the retailer’s shareholders would benefit. If these activities caused the retailer to pay a higher average price for wholesale energy, its shareholders would bear this additional cost. The following example illustrates how this mechanism might work. Suppose that the CREG sets the forward contract price index for the present period as the following weighted average. It is composed of the MOR price for forward contract purchases 5-years in advance of delivery with a weight 0.40, 4 years in advance of delivery with a weight of 0.3, 3 years in advance of delivery with a weight of 0.2, 2 years in advance of delivery with a weight of 0.075 and 1 year in advance of delivery with a weight of 0.025. Multiplying each weight by the respective MOR price gives the retailer’s regulated wholesale price implicit in its regulated retail price for the delivery period. The retailer would be free to engage in additional forward contract purchases and sales in the MOR subject to the minimum hedging requirements. Moreover, the retailers would also be able to enter into other bilateral hedging arrangements outside of the MOR. Any profits or losses that result from these trading activities would be paid to or paid by the firm’s shareholders. Allowing each retailer to purchase fixed-price forward contracts outside of the MOR is likely to further increase the short-term market power mitigation benefits of fixed-price forward contract purchases by retailers beyond what is possible from purchasing the same total quantity of fixed-price forward contracts from the MOR. The following example illustrates how this mechanism could work. Suppose that the wholesale market is composed of one large supplier that owns 50 percent of the generation capacity and the remainder of the generation capacity is owned by a number of small firms with no ability to exercise unilateral market power. Suppose for simplicity that all suppliers and retailers are risk neutral. The forward contract prices offered by all of the suppliers—the single large firm and each of the small firms—would be very similar because all of the suppliers should be willing to sell forward contracts at the opportunity cost of their short-term market sales, which is equal to the contract-quantity-weighted-average expected spot price over the duration of the forward contract. This spot price would reflect the market power that all suppliers expect to be exercised in the short-term market. Consequently, even though each small supplier has no ability to exercise unilateral market power in the short-term market, it would only be willing to sell forward contracts at an average price that reflects the market power it expects the large firm to be able to exercise in the short-term market, because that is what each small supplier expects it could sell its output at in the short-term market. In spite of the fact that all firms can be expected to offer similar prices for fixed-price forward contracts, by concentrating their fixed-price forward contract purchases in the large generation unit owner, retailers will limit the incentive this large firm has to exercise unilateral market power in the short-term market for the reasons discussed in Section 2. However, there is no analogous short-term market power mitigation benefit from purchasing fixed-price forward contracts from the small firms because they have no ability to exercise unilateral market power in the short-term market. Requiring retailers to participate in a centralized market for fixed-price forward contracts for energy where buyers and sellers compete anonymously will prevent retailers focusing their fixed-price forward contract purchases where they can provide the greater short-term market power mitigation benefits, because it is impossible for a buyer to know or specify which supplier 95
it is buying from in an anonymous centralized market. By allowing retailers to enter into bilateral transactions outside of the MOR, they are able to focus their bilateral forward contract purchases on the suppliers that they believe have the greatest ability to exercise unilateral market power in the short-term market. By purchasing additional fixed-price bilateral contracts from these suppliers and selling bilateral fixed-price forward contracts to the smaller suppliers, they can re-balance their fixed price forward contract holdings to achieve the greatest short-term market power mitigation benefits for a given quantity of fixed-price forward contract holdings. This section has demonstrated that it is possible to achieve virtually all of the retail-priceregulation benefits of the MOR without mandating a single buyer with an elastic demand. It has also highlighted the additional short-term and forward energy market competitiveness benefits of allowing all retailers to purchase and sell fixed-price forward contracts in the MOR subject to minimum fixed-price forward contract quantity holdings at each horizon to delivery. Finally, this section has shown the short-term market power mitigation benefits of allowing purchases and sales of bilateral fixed-price forward contracts by retailers with specific suppliers. For all of these reasons, allowing retailers to buy and sell in the MOR and buy and sell bilateral forward contracts is likely to maximize the competitiveness of the MOR, the bilateral contract market, and the short-term energy market. 6.2.4. Counterparty risk management issues The MOR proposal involves a centralized market for standardized fixed-price forward contracts that all retailers and suppliers can participate in. Because a centralized market such as the MOR would involve anonymous transactions between buyers and sellers of fixed price forward contracts, the problem of managing counterparty risk becomes far more complex than is the case with bilateral contracting where the buyer and seller of the contract can negotiate the financial terms and conditions of the contract to ensure that each party fulfills its contractual obligations. For example, if a supplier sells a bilateral contract to a retailer or final consumer that has long history of prompt payment, it can offer this customer more favorable financial terms than a customer that is more costly to obtain payment from. The customer that is more costly to collect payment from will typically receive less favorable financial terms because of the additional expected costs the seller must incur to obtain payment. The centralized market operator is typically the counterparty for all purchases and sales of the standardized fixed-price forward contracts. The centralized market operator can establish a clearinghouse to compute the net position of each market participant in standardized fixedprice forward contracts and adjust the financial terms and conditions for each market participant to make transactions through the centralized market reflect that participant’s net position with respect to the clearinghouse. For example, if a participant sells a fixed-price forward contract in the centralized market and then buys it back at a later date, it has a zero net position in the centralized market. If these transactions had taken place in the bilateral contract market with different counterparties, this participant would be the seller of the contract to one counterparty and the buyer of the contract to the other counterparty. Therefore, the existence of a centralized market can reduce the cost of managing counterparty risk because all transactions associated with the centralized market are seen by the clearinghouse.
96
However, a potential downside of the centralized market being the counterparty to all transactions is that the cost of default by any party must be paid by all other participants in the centralized market. This can create a moral hazard problem for the centralized market operator because market participants that are likely to default know that they will not bear the full cost of their default. Alternatively, market participants that are unlikely to default know that they will bear a greater share of these costs and will be less likely to want to trade through the centralized market, particularly if these costs are recovered through a trading charge. In other centralized markets such as the New York Stock Exchange or Chicago Board of Trade this problem is solved by setting financial solvency requirements and approval by existing participants as preconditions for participation in the centralized market. Less financially solvent entities typically use members of these organizations to trade on their behalf. The member of centralized market makes the trade through the centralized market and a bilateral transaction between the member and the less financially solvent entity is used to manage the counterparty risk without creating a moral hazard problem for the centralized market operator. Retailers and large consumers in Colombia differ substantially in their ability to pay, so the potential moral hazard problem associated with allowing all of these entities to participate in the MOR under the similar financial terms and conditions could be substantial. Therefore, before the start of the MOR a mechanism should be put in place to ensure that less financially solvent entities are not subsidized by more financial solvent participants. One approach is to establish minimum financial solvency requirements to be a member of the MOR and allow less financially solvent retailers to make their purchases and sales in MOR products through members of the MOR. The CREG or the SSPD could establish the criteria to become a member of the MOR and determine whether an entity meets these criteria. Moreover, they could also make the determination that an entity is no longer eligible to be a member of the MOR. It is extremely important to address this potential moral hazard problem before the start of the market rather than wait until the first market participant defaults on their financial obligations, because the magnitude of this default cost when it occurs could be substantial. However, by acknowledging for the potential for this problem and monitoring for its existence should contain the harm that is created by defaults.
7. Major Recommendations and Directions for Future Research This report has pointed out a number of aspects of the existing electricity market design in Colombia that could be contributing to the high short-term prices observed over the past seven months. These issues were classified into four broad categories: (1) system-wide market power issues, (2) local market power issues, (3) market monitoring issues, and (4) broader electricity market issues. Market rule and regulatory oversight changes were also proposed to address each of these issues and improve the performance of both the short-term energy market and market for energy and operating reserve price hedging instruments. A number of these recommendations could take some time and effort to implement, so some prioritization may be helpful. The highest priority recommendations relate to public data release and the market monitoring function. The independent market monitoring committee must have immediate access to all data submitted to and produced by the market operator and submitted to and 97
produced by the relevant regulatory authorities—the CREG and the SSPD. All data submitted to and produced by the market operator should also be released to the public as soon as possible after the market operated. The independent market monitoring committee should also have the ability to produce reports analyzing confidential data that been provided to the CREG and SSPD that can be made publicly available. Although it is important to protect confidential business information collected by the CREG and SSPD, there are many ways present summary statistics from this information in a manner that protects its confidentiality yet still provides valuable input to the public dialogue. As noted several times in the report, the best performing wholesale electricity markets in the world are not those that had the best market design from the start, but those with the most proactive regulatory oversight and market monitoring processes. Electricity market design is an extremely complex task involving power systems engineering, economic analysis, mathematical programming, and political economy, to name a few of the major disciplines involved. All existing wholesale electricity markets around the world have defects, the most successful ones are those that are able to identify these defects as quickly as possible and determine the appropriate course of action to correct them. As also noted in the report, often the appropriate course of action is to allow market participants and the existing regulatory rules to operate as it is designed. The independent market monitoring committee can be very helpful for distinguishing between market performance problems requiring explicit regulatory intervention and those that are best left to market participants and the existing regulatory process to sort out. Any market rule change has many intended and unintended consequences, both of which should be explored fully before any new market rule is implemented. Otherwise, there is a significant risk that a market rule change that solves one problem will create an even larger problem. There is also a significant benefit to making as much data as possible available to the public so that it is possible to discuss the results on any analysis in public forum. As noted in the report, stakeholder input is a vital component of the market monitoring and regulatory oversight process. Stakeholders often provide perspectives on an issue that can significantly enrich a quantitative analysis based on market outcome data. A public forum where all stakeholders are allowed hear and comment on the results of a quantitative analysis performed by the independent market monitoring committee and the committee is allowed to respond to stakeholder comment is most likely to produce best possible information for the regulatory decision-making process. A second important aspect of the market monitoring process is how to best manage the exercise of unilateral market power. Rather that attempt to find and punish the abuse of market power, a less costly strategy that is likely to improve long-run market performance is to focus on preventing behavior harmful to system reliability and market efficiency. The report outlines procedures designed to limit the harm to other market participant experience as result of some suppliers exercising unilateral market power that is harmful to system reliability or market efficiency. In order to quantify the magnitude of economic harm caused by the exercise of unilateral market power, the independent market monitoring committee may wish to implement the competitive benchmark pricing analysis described in Section 3.1. These prices provide valuable information to market participants and the public at large about magnitude of consumer harm caused by the exercise of unilateral market power.
98
The second major set of recommendations relates to the positive and negative reconciliation payment mechanism. The effectiveness of these mechanisms should be reviewed from the perspective that they currently service as a local market power mitigation mechanism for the Colombian market. Viewed from this perspective, there is little economic rationale for paying for negative reconciliations. Guaranteeing start-up cost recovery in positive reconciliation payments and not for sales in the short-term market provides incentives for suppliers that know they are needed to operate because of a local reliability constraint to submit price offers into the short-term market far in excess of their variable cost. Eliminating the guaranteed recovery of start-up costs for positive reconciliation payments would provide suppliers with the stronger incentives to submit price offers into the short-term market closer to their variable cost of production. Finally, designating some generation units as reliability mustrun units and guaranteeing full cost recovery in exchange for the system operator having the ability to use them to manage local transmission constraints can significantly reduce the magnitude of reconciliation payments. The third major issue of whether to guarantee start-up cost recovery from the short-term market is an excellent example of a proposed market rule change that should be critically analyzed for its impacts on market performance before it is implemented. As noted in the report, it is likely that implementing this market rule change would detract from market efficiency rather than improve it. Section 4.3 argued that guaranteeing start-up cost recovery could prevent the Colombia market from realizing a lower cost solution that involves an intertemporal trade between fossil fuel and hydroelectric suppliers. This section also suggested study which could be undertaken to determine whether market performance would be enhanced or harmed by guaranteeing start-up cost recovery. The final major issue concerns the design of the MOR, the centralized market for standardized forward contracts proposed by the CREG. Section 6.2 points out that it is possible to allow individual retailers to participate in the MOR and allow them to buy and sell bilateral contracts outside of the MOR and still realize a major benefit of the MOR as market price that can be used to set the regulated wholesale price implicit in the retail price charged to regulated final consumers. This section also emphasizes that in order for the MOR to provide credible insurance against an El Nino events, the design should focus on sales on fixed-price forward contracts beginning delivery three or more years into the future, instead of products beginning delivery in two years or less. The regulatory price-setting process for natural gas is an important longer-term issue for the electricity market performance. A general set of recommendations for revising the natural gas price-setting process in Colombian was suggested. This is another area that could benefit from a more detailed and comprehensive study. As should be clear from the discussion in Section 6.1, the potential benefits to Colombian electricity consumers from a more coherent national natural gas regulatory framework are likely to be substantial.
99
References Borenstein, Severin, Bushnell, James and Wolak, F.A. (2002) "Measuring Market Inefficiencies in California's Restructured Wholesale Electricity Market", American Economic Review, 92 (2002), pp. 1376-1405. (*) McRae, Shaun D. and Wolak, Frank A. (2009) “How Do Firms Exercise Unilateral Market Power? Evidence from a Bid-Based Wholesale Electricity Market,” March. (*) Wolak, Frank A. (2000b) “Comments on the Office of Gas and Electricity Markets (Ofgem) License Condition Prohibiting Abuse of Substantial Market Power,” submission to United Kingdom Competition Commission, July. (*) Wolak, F.A. (2003a) "Measuring Unilateral Market Power in Wholesale Electricity Markets: The California Market 1998 to 2000", American Economic Review, May 2003, 425-430. (*) Wolak, F.A. (2003b) "Diagnosing the California Electricity Crisis," The Electricity Journal, August/September, 11-37. (*) Wolak, Frank A. (2003c) “Sorry, Mr. Falk: It’s Too Late to Implement Your Recommendations Now: Regulating Wholesale Markets in the Aftermath of the California Crisis,” The Electricity Journal, August, 50‐55. (*) Wolak, F.A. (2007a) "Quantifying the Supply-Side Benefits from Forward Contracting in Wholesale Electricity Markets", Journal of Applied Econometrics, volume 22, 2007, 1179-1209. (*) Wolak, F.A. (2007b) “Regulating Competition in Wholesale Electricity Supply,” forthcoming in NBER Regulation Policy Volume, edited by Nancy Rose (*) (*) = available from http://www.stanford.edu/~wolak.
100