Article pubs.acs.org/JACS
Tunable Cu Enrichment Enables Designer Syngas Electrosynthesis from CO2 Michael B. Ross,†,‡ Cao Thang Dinh,‡,§ Yifan Li,†,∥ Dohyung Kim,⊥ Phil De Luna,‡,# Edward H. Sargent,*,‡,§ and Peidong Yang*,†,‡,∥,⊥,¶,□ †
Department of Chemistry, ⊥Department of Materials Science and Engineering, and □Kavli Energy Nanosciences Institute, University of California, Berkeley, Berkeley, California 94720, United States ‡ Bio-Inspired Solar Energy Program, Canadian Institute for Advanced Research, Toronto, Ontario M5G 1Z8, Canada § Department of Electrical and Computer Engineering, University of Toronto, Toronto, Ontario M5S 3G4, Canada ∥ Chemical Sciences Division and ¶Materials Sciences Division, Lawrence Berkeley National Laboratory, Berkeley, California 94720, United States # Department of Materials Science and Engineering, University of Toronto, Toronto, Ontario M5S 3E4, Canada S Supporting Information *
ABSTRACT: Using renewable energy to recycle CO2 provides an opportunity to both reduce net CO2 emissions and synthesize fuels and chemical feedstocks. It is of central importance to design electrocatalysts that both are efficient and can access a tunable spectrum of products. Syngas, a mixture of carbon monoxide (CO) and hydrogen (H2), is an important chemical precursor that can be converted downstream into small molecules or larger hydrocarbons by fermentation or thermochemistry. Many processes that utilize syngas require different syngas compositions: we therefore pursued the rational design of a family of electrocatalysts that can be programmed to synthesize different designer syngas ratios. We utilize in situ surfaceenhanced Raman spectroscopy and first-principles density functional theory calculations to develop a systematic picture of CO* binding on Cu-enriched Au surface model systems. Insights from these model systems are then translated to nanostructured electrocatalysts, whereby controlled Cu enrichment enables tunable syngas production while maintaining current densities greater than 20 mA/cm2.
■
synthesis.2,4,5,8,9 Desirably, the syngas electrosynthesis catalyst will operate at room temperature, in a single reactor, and with high efficiency and production rates. These attributes, combined with the ability to tailor the composition of syngas for each downstream process (such as 0.6 H2:CO for Fischer− Tropsch reactors, 2 H2:CO for methanol synthesis, and 0.3−1 H2:CO for syngas fermentation),4,5,8,9 would provide a flexible platform for integration with existing chemical infrastructure. Several electrocatalytic systems provide either rapid reaction turnovers or a variety of syngas compositions; however, there exist no prior reports of a single electrocatalyst that exhibits high production rates (at low overpotential) combined with systematic and wide-ranging syngas composition control.10−15 Herein, we report a strategy where the composition of syngas produced by a nanostructured Au electrocatalyst can be finely controlled using Cu underpotential deposition while maintaining high geometric current densities (production rates) at low overpotentials for CO2RR (Figure 1a). Within this scope, underpotential deposition provides a quantitative and system-
INTRODUCTION Relentless improvements in renewable energy generation provide new opportunities for storing and harnessing electrical energy. In particular, increasingly abundant and inexpensive sources of electrons provide synthetic opportunities to replace conventional chemical processes with renewable powered ones.1−5 In addition to mild reaction conditions, these renewable powered electrochemical reactions could enable decreased production costs relative to conventional approaches, particularly for the production of feedstock chemicals from CO2.2,6 However, CO2 reduction reaction (CO2RR) electrocatalysts have several remaining fundamental and performancerelated challenges, particularly related to low production rates, limited product versatility, and poor energy efficiencies.6,7 Although direct electrosynthesis of multicarbon products remains elusive, catalytic efficiencies and production rates for single-carbon products, such as CO and formic acid, provide more immediate opportunities for electrochemical CO2 valorization. Synthesis gas (syngas) made using renewable powered CO2RR is particularly attractive because it can subsequently be upgraded to longer hydrocarbons by Fischer−Tropsch chemistry, syngas fermentation, and individual small-molecule © XXXX American Chemical Society
Received: May 12, 2017
A
DOI: 10.1021/jacs.7b04892 J. Am. Chem. Soc. XXXX, XXX, XXX−XXX
Article
Journal of the American Chemical Society
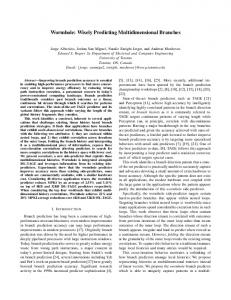
Figure 1. Cu enrichment of Au surfaces enables tuning the composition of electrosynthesized syngas. (a) Scheme depicting the relationship between Cu-enriched Au surface, in situ characterization of CO* coordination, and syngas composition. (b) Calculated d-band electronic states for increasingly Cu-enriched Au surfaces.
atic means by which the ratio of Au and Cu atoms at the surface can be tuned. Such control changes the electronic structure at the catalyst surface,7,16,17 which we hypothesized would influence CO binding and thereby provide a method for tuning the relative selectivity of CO electrosynthesis and the hydrogen evolution reaction (HER).18,19 In situ surfaceenhanced Raman spectroscopy (SERS) is used to interrogate changes in the coordination and binding characteristics of adsorbed CO (CO*) on model Au SERS substrates. In turn, fundamental insights from both in situ SERS and density functional theory (DFT) calculations are translated from model systems to nanostructured electrocatalysts that provide high electrochemical activity (>20 mA/cm2) for the most industrially relevant syngas compositions.
■
RESULTS AND DISCUSSION Design of Cu-Enriched Model Electrocatalysts. We focus on structures in which Au surface atoms are replaced with Cu atoms in ordered monolayers; this serves as an approximation of surfaces that are increasingly Cu-enriched (Figure 1b). Indeed, the calculated projected density of states, which describes the electronic states at the surface, shows each Cu-enriched slab has distinct electronic properties. Importantly, these differences are most pronounced in the d-band electrons that dominate molecular adsorption, suggesting that Cuenriched slabs should exhibit catalytic activity distinct from pure Au and Cu or their alloys.18−20 To realize such architectures, electrochemical underpotential deposition (UPD) was used to control the extent of Cu enrichment (Figure 2a). UPD occurs when the electrochemical deposition of a less noble species onto a more noble metal is thermodynamically favorable, but the deposition of the less noble species onto itself in unfavorable. This enables precise control over metal deposition because UPD is self-terminating at a single monolayer.21 Additionally, the use of Au as a substrate provides a platform where the binding of CO* can be monitored in situ with SERS, a nondestructive technique where the Raman scattering of surface-adsorbed molecules can be enhanced by 105−1010.22 By combining the precision of UPD with the sensitivity of SERS, one can manipulate the electronic and geometric properties of the catalyst surface (Figure 1b), by virtue of changing the extent of Cu enrichment, while monitoring changes in CO*.
Figure 2. Sub-monolayer Cu underpotential deposition on Au SERSactive model electrodes. (a) Scheme of Cu underpotential deposition. (b) Cyclic voltammograms for increasingly wide Cu underpotential deposition windows (no Cu, yellow; 1/3 of the window, orange; 2/3 blue; and 3/3 purple). (c) Scanning electron micrographs of a roughened Au SERS-active electrode before (top, yellow box) and after (bottom, purple box) deposition of Cu using the full (3/3) underpotential deposition window; scale bars are 100 nm. (d) Representative Au (top) and Cu (bottom) X-ray photoelectron spectra (here from the 3/3 window Cu underpotential deposition).
Synthesis and Characterization of Au Architectures Enriched by Cu Underpotential Deposition. Cu-enriched Au electrodes were synthesized by electrochemical roughening, which renders them SERS-active, followed by Cu UPD (Figure 2b, S1, Methods), where stable cyclic voltammetry (CV) traces are indicative of Cu (sub)-monolayer deposition. Throughout this work three potential windows were used that correspond to approximately 1/3 monolayer CuUPD (Θ = 1/3), 2/3 B
DOI: 10.1021/jacs.7b04892 J. Am. Chem. Soc. XXXX, XXX, XXX−XXX
Article
Journal of the American Chemical Society
Figure 3. In situ spectroscopic and theoretical characterization of CO* binding. (a) Scheme depicting in situ SERS during CO electrosynthesis. (b) Waterfall plot of typical SER spectra as a function of potential for the fully Cu enriched Au electrode (V vs RHE). (c) Waterfall plot of SER spectra for different Cu UPD coverages at −0.3 V vs RHE. (d) Calculated vibrational frequencies for CO bound on Cu-enriched Au slab models (from Figure 1). Solid lines indicate CO* at Cu sites, dashed lines indicate CO* at Au sites, and the narrow dashed trace (bottom) is for gas-phase CO at the same level of theory. (e) Renderings of optimized slab geometries for the different CO* adsorption sites. (f) Calculated adsorption energies for CO* at Au sites (blue squares) and Cu sites (red circles) as well as for H* (gray diamonds).
species (1450/1200 cm−1) and water (1600 cm−1), both from the electrolyte.25,26 At an applied potential of −0.2 V vs RHE, a peak at ∼2100 cm−1 is observed that is attributed to CO* on the atop position (Figure 3b).26,27 As a function of potential, both the relative intensity and position of νC−O change; variations in intensity can be understood by changes in the relative concentrations of CO* at the surface.26 The redshifting of νC−O at more negative potentials is due to the electrochemical Stark effect, a phenomenon where the electrostatic field at an electrode can shift the vibrational frequencies of an adsorbate (Figure S4).23 Overall, these data indicate that electrochemically synthesized CO can be detected in situ and that the νC−O characteristics observed here are consistent with past observations.26,27 To understand how Cu enrichment influences CO*, one can compare νC−O for increasing extents of Cu enrichment at a fixed potential (Figure 3c). At −0.3 V (and at −0.5 V vs RHE, Figure S5), it is clear that νC−O red-shifts with increasing Cu coverage (a roughened Cu sample is provided for reference).25,28 These data are indicative of CO* adsorption in distinct chemical environments, where the changing coordination environment is reflected in νC−O.23 To better understand the relationship between chemical environment and νC−O, DFT calculations were performed on CO adsorbed on increasingly Cu-enriched Au(111) slabs (Figure 3d and e, Figure S6). For the intermediate Cu enrichments (Figure 3e), CO can be adsorbed at either Cu sites (Figure 3d, solid) or Au sites (Figure 3d, dashed). Overall, the trend is consistent with the experiment where νC−O red-shifts for increasingly Cu-rich surfaces (Figure S7), although there is some site-dependent variation observed (note that previous comparisons of calculated and experimentally measured νC−O exhibit disagreements between 20 and 50 cm−1).29
monolayer CuUPD (Θ = 2/3), and one full monolayer CuUPD (Θ = 1). Although previous literature has shown that ordered Cu monolayers can form on single-crystalline Au surfaces, the broad features in the voltammograms indicate that Cu is deposited onto a variety of coordination environments on the polycrystalline Au surface.21,23 Further characterization indicates that the extent of Cu enrichment is indeed controlled while the electrode morphology is maintained after UPD. Scanning electron microscopy (SEM) does not indicate restructuring of the SERS-active nanoscale features (Figure 2c), while X-ray photoelectron spectroscopy (XPS) confirms that wider UPD windows increase the ratio of Cu to Au atoms at the surface (Figure 2d, Table S1). Additionally, SER spectra of the Au substrate before and after UPD indicate the displacement of adsorbed chloride remaining after the roughening procedure without showing any new features related to Cu−O bonding that would form after bulk Cu deposition (Figure S2). Finally, analysis of the 2p2/3 XPS and Cu L3M45M45 Auger spectra suggest that the UPD Cu may be primarily in a metallic state (Figure S3), consistent with recent studies of full Cu monolayers on Au.24 Together, these data show that UPD can be used to controllably enrich Au surfaces with Cu while preserving the nanoscale morphology that will provide Raman enhancement. In Situ Spectroscopic Interrogation and Theoretical Analysis of CO* Binding. To monitor the electrosynthesis of CO in situ, the electrode was mounted within a CO2RR electrochemical cell integrated with a confocal Raman microscope (Figure 3a, top). This allows one to probe the vibration of the C−O bond (νC−O) in CO* in situ as a function of applied potential (Figure 3a, bottom). Before the application of bias on the fully Cu-enriched electrode (∼1 monolayer Cu, Figure 3b, gray), the primary peaks observed are (bi)carbonate C
DOI: 10.1021/jacs.7b04892 J. Am. Chem. Soc. XXXX, XXX, XXX−XXX
Article
Journal of the American Chemical Society Qualitatively, the red-shifting of νC−O with increasing Cu content can be understood through analysis of the CO−metal interaction, which can be described by charge donation to the metal surface by the highest occupied molecular orbital (HOMO, 5σ) of CO, which leads to charge back-donation into its lowest unoccupied molecular orbital (LUMO, 2π*).29,30 Within this model, the result of charge transfer to the antibonding 2π* orbital is a longer C−O bond and a redshifted νC−O. Due to their respective d-band positions (Figure 1b), this is consistent with what one would expect trending from pure Au to pure Cu.17 Additionally, red-shifting of νC−O is typically associated with a stronger metal−CO interaction.29 Although shifts in νC−O often exhibit a linear relationship with the C−metal bond length and with the energetics of adsorption, deeper analysis of these Cu-enriched Au architectures reveals a departure from this behavior, which is discussed further in text S2 and Figures S7−S11. These data, along with Bader charge (the electronic charge density) analysis (Figure S11) at both the adsorption site and at the nearest neighbor atoms, affirm that Cu enrichment directly changes the electronic structure and molecular coordination environment on Au surfaces.19,20,31 Importantly, despite the simplistic nature of the DFT model slabs compared to the polycrystalline electrodes measured in solution, the dominant trends observed in the experiments are captured by the DFT calculations. Having shown that Cu enrichment of Au can systematically alter the coordination environment of CO*, we now consider how these differences affect CO2RR and its competition with HER.17,20,31 Thermodynamic adsorption energies (ΔGAds) were calculated for CO* and H* (Figure 3f) for all extents of Cu enrichment (Figure 3d). If we first compare adsorption on Au(111) and Cu(111) surfaces, it is seen that ΔGAds is more positive (less favorable) for both CO* and H* on Au. Additionally, a difference of ∼0.5 eV is observed between CO* and H* on Au(111), whereas on Cu(111) there is a difference of only ∼0.25 eV; this difference explains the more favorable release of CO* from Au.17 Similarly, all of the Cu-enriched Au surfaces exhibit more favorable H adsorption than CO adsorption. On average, increasing extents of Cu enrichment increase the favorability of both CO* and H* adsorption, a trend that is in general agreement with the red-shifting νC−O trend observed in situ. At the more energetically favorable Cu sites, the difference between ΔGAds for CO* and H* narrows to 0.05−0.2 eV, suggesting increased competition between HER and CO2RR.18 Moreover, calculations comparing the (111), (110), and (100) facets exhibit a similar narrowing of ΔGAds between CO* and H* (Figures S12, S13, Table S3). Together, these data suggest that Cu enrichment, and the site dependence that results from it, can profoundly influence competition between CO electrosynthesis and H2 production.18 In particular, intermediate Cu enrichments will increase HER relative to CO 2RR, providing a means by which the composition of synthesis gas can be controlled. As such, we set out to translate these concepts from a model system to a tunable syngas electrocatalyst with high production rates. Realization of a Tunable Syngas Electrocatalyst. Au nanoneedle electrodes, which take advantage of field-induced reagent concentration (Figure 4a), were chosen as a platform that provides high CO selectivity at low overpotentials with high current densities (>20 mA/cm2).32 The Au nanoneedles were enriched with submonolayers of Cu using UPD in an analogous fashion to the model electrodes (Figure 4b), after which their catalytic performance was evaluated in CO2-
Figure 4. Cu enrichment enables control over syngas composition on high-performance Au nanostructured electrocatalysts. (a) Scanning electron micrographs of Au nanostructured needle electrodes (scale bars: 1 μm, top, and 5 μm, bottom). (b) Cyclic voltammograms for increasingly wide Cu underpotential deposition windows (no Cu, yellow; 1/3 of the window, orange; 2/3 blue; and 3/3 purple). (c) Partial current densities (left axis) and production rates (right axis) at −0.65 V vs RHE for CO (red circles) and H2 (black squares) as a function of Cu monolayer deposition. (d) Controlling syngas (H2:CO faradaic efficiencies) composition as a function of both Cu deposition (yellow squares, no Cu; orange circles, 1/3 Cu UPD window; blue triangles, 2/3 Cu UPD window; purple inverted triangles, 3/3 Cu UPD window) and applied potential.
saturated 0.5 M KHCO3. During electrosynthesis high current densities are maintained for all catalysts (Figure S14); importantly, the ratio of the production of CO and H2 is sensitive to the extent of Cu enrichment (Figure 4c, Figures S15, S16). To explicitly characterize the composition of the electrosynthesized syngas, the ratio of H2 and CO faradaic efficiency is compared for all Cu enrichments (Figure 4d). Overall, increasing extents of Cu enrichment result in greater H2 production (increased HER rates), as predicted by the Cuenriched Au model surfaces. Importantly, this trend is consistent both with the insights gained above from in situ SERS and DFT but also with previous studies of AuCu alloy nanoparticles.20 For the two highest extents of Cu enrichment, the H2:CO ratio can be tuned to match the syngas compositions used for Fischer−Tropsch synthesis of hydrocarbons (0.6), throughout the range of compositions used for emerging fermentation and short-chain thermochemical synthesis (0.3−1), and to approach the ideal ratio for methanol synthesis (2).2,8,9 Importantly, after 8 h of electrosynthesis both the bare Au and 3/3 Cu UPD enriched Au electrocatalysts exhibit stable syngas ratios and >70% retained activity (Figure S17). Moreover, SEM shows that the nanoscale morphology is preserved and XPS suggests that UPD Cu remains at the surface.
■
CONCLUSION We have shown that controlled Cu enrichment of Au surfaces results in electrocatalysts that can synthesize a range of syngas compositions at high production rates. In situ SERS and DFT D
DOI: 10.1021/jacs.7b04892 J. Am. Chem. Soc. XXXX, XXX, XXX−XXX
Article
Journal of the American Chemical Society
(4) Foit, S. R.; Vinke, I. C.; de Haart, L. G. J.; Eichel, R.-A. Angew. Chem., Int. Ed. 2017, 56, 5402−5411. (5) Hernandez, S.; Farkhondehfal, M. A.; Sastre, F.; Makkee, M.; Saracco, G.; Russo, N. Green Chem. 2017, 19, 2326−2346. (6) Montoya, J. H.; Seitz, L. C.; Chakthranont, P.; Vojvodic, A.; Jaramillo, T. F.; Nørskov, J. K. Nat. Mater. 2016, 16, 70−81. (7) Seh, Z. W.; Kibsgaard, J.; Dickens, C. F.; Chorkendorff, I.; Nørskov, J. K.; Jaramillo, T. F. Science 2017, 355, eaad4998. (8) Jiao, F.; Li, J.; Pan, X.; Xiao, J.; Li, H.; Ma, H.; Wei, M.; Pan, Y.; Zhou, Z.; Li, M.; Miao, S.; Li, J.; Zhu, Y.; Xiao, D.; He, T.; Yang, J.; Qi, F.; Fu, Q.; Bao, X. Science 2016, 351, 1065−1068. (9) Munasinghe, P. C.; Khanal, S. K. Bioresour. Technol. 2010, 101, 5013−5022. (10) Huan, T. N.; Ranjbar, N.; Rousse, G.; Sougrati, M.; Zitolo, A.; Mougel, V.; Jaouen, F.; Fontecave, M. ACS Catal. 2017, 7, 1520− 1525. (11) Kumar, B.; Brian, J. P.; Atla, V.; Kumari, S.; Bertram, K. A.; White, R. T.; Spurgeon, J. M. ACS Catal. 2016, 6, 4739−4745. (12) Li, Y. C.; Zhou, D.; Yan, Z.; Gonçalves, R. H.; Salvatore, D. A.; Berlinguette, C. P.; Mallouk, T. E. ACS Energy Lett. 2016, 1, 1149− 1153. (13) Delacourt, C.; Ridgway, P. L.; Kerr, J. B.; Newman, J. J. Electrochem. Soc. 2008, 155, B42. (14) Sheng, W.; Kattel, S.; Yao, S.; Yan, B.; Liang, Z.; Hawxhurst, C.; Wu, Q.; Chen, J. G. Energy Environ. Sci. 2017, 10, 1180−1185. (15) Li, Q.; Fu, J.; Zhu, W.; Chen, Z.; Shen, B.; Wu, L.; Xi, Z.; Wang, T.; Lu, G.; Zhu, J. J.; Sun, S. J. Am. Chem. Soc. 2017, 139, 4290−4293. (16) Calle-Vallejo, F.; Koper, M. T. M.; Bandarenka, A. S. Chem. Soc. Rev. 2013, 42, 5210. (17) Hansen, H. A.; Varley, J. B.; Peterson, A. A.; Nørskov, J. K. J. Phys. Chem. Lett. 2013, 4, 388−392. (18) Back, S.; Kim, J.-H.; Kim, Y.-T.; Jung, Y. ACS Appl. Mater. Interfaces 2016, 8, 23022−23027. (19) Kim, D.; Resasco, J.; Yu, Y.; Asiri, A. M.; Yang, P. Nat. Commun. 2014, 5, 4948. (20) Liu, P.; Nørskov, J. K. Phys. Chem. Chem. Phys. 2001, 3, 3814− 3818. (21) Herrero, E.; Buller, L. J.; Abruña, H. D. Chem. Rev. 2001, 101, 1897−1930. (22) Haynes, C. L.; McFarland, A. D.; Duyne, R. P. V. Anal. Chem. 2005, 77, 338A−346A. (23) Leung, L. W. H.; Weaver, M. J. J. Am. Chem. Soc. 1987, 109, 5113−5119. (24) Friebel, D.; Mbuga, F.; Rajasekaran, S.; Miller, D. J.; Ogasawara, H.; Alonso-Mori, R.; Sokaras, D.; Nordlund, D.; Weng, T.-C.; Nilsson, A. J. Phys. Chem. C 2014, 118, 7954−7961. (25) Batista, E. A.; Temperini, M. L. A. J. Electroanal. Chem. 2009, 629, 158−163. (26) Wuttig, A.; Yaguchi, M.; Motobayashi, K.; Osawa, M.; Surendranath, Y. Proc. Natl. Acad. Sci. U. S. A. 2016, 113, E4585− E4593. (27) Rodriguez, P.; Garcia-Araez, N.; Koverga, A.; Frank, S.; Koper, M. T. M. Langmuir 2010, 26, 12425−12432. (28) Heyes, J.; Dunwell, M.; Xu, B. J. Phys. Chem. C 2016, 120, 17334−17341. (29) Gajdo, M.; Eichler, A.; Hafner, J. J. Phys.: Condens. Matter 2004, 16, 1141−1164. (30) Sung, S. S.; Hoffmann, R. J. Am. Chem. Soc. 1985, 107, 578−584. (31) Lopez, N.; Nørskov, J. K. Surf. Sci. 2001, 477, 59−75. (32) Liu, M.; Pang, Y.; Zhang, B.; De Luna, P.; Voznyy, O.; Xu, J.; Zheng, X.; Dinh, C. T.; Fan, F.; Cao, C.; de Arquer, F. P. G.; Safaei, T. S.; Mepham, A.; Klinkova, A.; Kumacheva, E.; Filleter, T.; Sinton, D.; Kelley, S. O.; Sargent, E. H. Nature 2016, 537, 382−386. (33) Kong, Q.; Kim, D.; Liu, C.; Yu, Y.; Su, Y.; Li, Y.; Yang, P. Nano Lett. 2016, 16, 5675−5680.
calculations enabled the elucidation of how surface electronic structure can be tuned by Cu enrichment to influence CO binding, which in turn dictates competition between CO and H2 electrosynthesis. This work is consistent with continued improvements in CO2RR that are enabled by better understanding of the catalytic interface and the exploration of new electrocatalyst compositions.7,19 Moreover, the fundamental catalytic concepts described herein are applicable outside of CO and H2 electrosynthesis; they provide insights relevant for the production of other small molecules, hydrocarbons, and fuel mixtures such as hythane (CH4 and H2). Finally, the high performance and stability of these catalysts could facilitate their integration into a broader CO2-recycling scheme.2,12,33
■
ASSOCIATED CONTENT
* Supporting Information S
The Supporting Information is available free of charge on the ACS Publications website at DOI: 10.1021/jacs.7b04892. Detailed materials and methods, theoretical details, additional electrochemical characterization, potentialdependent SER spectra, optimized geometries used in theoretical calculations, analysis of spectroscopic trends, full projected densities of states for all materials, facetdependent binding strength calculations for *CO and *H, and additional electrocatalytic analysis (PDF)
■
AUTHOR INFORMATION
Corresponding Authors
*
[email protected] *
[email protected] ORCID
Michael B. Ross: 0000-0002-2511-0594 Yifan Li: 0000-0003-2146-2266 Dohyung Kim: 0000-0003-0201-9082 Peidong Yang: 0000-0003-4799-1684 Notes
The authors declare no competing financial interest.
■
ACKNOWLEDGMENTS This work was supported by the CIFAR Bio-Inspired Solar Energy Program (Postdoc Fellowship) and by the Director, Office of Science, Office of Basic Energy Sciences, Chemical Sciences, Geosciences, & Biosciences Division, of the U.S. Department of Energy under Contract No. DE-AC0205CH11231 within the Catalysis Research Program (FWP No. CH030201). XPS data were collected at the Molecular Foundry, which is supported by the Director, Office of Science, Office of Basic Energy Sciences, of the U.S. Department of Energy under Contract No. DE-AC02-05CH11231. M.B.R. gratefully acknowledges support from the CIFAR Bio-Inspired Solar Energy Program. P.D.L. wishes to thank the Natural Sciences and Engineering Research Council (NSERC) of Canada for support in the form of the Canadian Graduate Scholarship−Doctoral Award. D.K. acknowledges support from Samsung Scholarship.
■
REFERENCES
(1) Chu, S.; Cui, Y.; Liu, N. Nat. Mater. 2016, 16, 16−22. (2) Jhong, H.-R. M.; Ma, S.; Kenis, P. J. A. Curr. Opin. Chem. Eng. 2013, 2, 191−199. (3) Kim, D.; Sakimoto, K. K.; Hong, D.; Yang, P. Angew. Chem., Int. Ed. 2015, 54, 3259−3266. E
DOI: 10.1021/jacs.7b04892 J. Am. Chem. Soc. XXXX, XXX, XXX−XXX