Hindawi Publishing Corporation Mathematical Problems in Engineering Volume 2014, Article ID 162521, 8 pages http://dx.doi.org/10.1155/2014/162521
Research Article A Robust Collaborative Filtering Approach Based on User Relationships for Recommendation Systems Min Gao,1,2 Bin Ling,3 Quan Yuan,1 Qingyu Xiong,1,2 and Linda Yang3 1
School of Software Engineering, Chongqing University, Chongqing 400044, China Key Laboratory of Dependable Service Computing in Cyber Physical Society, Ministry of Education, Chongqing 400044, China 3 School of Engineering, University of Portsmouth, Portsmouth PO1 3AH, UK 2
Correspondence should be addressed to Min Gao;
[email protected] Received 12 August 2013; Revised 10 December 2013; Accepted 30 December 2013; Published 19 February 2014 Academic Editor: Xing-Gang Yan Copyright © 2014 Min Gao et al. This is an open access article distributed under the Creative Commons Attribution License, which permits unrestricted use, distribution, and reproduction in any medium, provided the original work is properly cited. Personalized recommendation systems have been widely used as an effective way to deal with information overload. The common approach in the systems, item-based collaborative filtering (CF), has been identified to be vulnerable to “Shilling” attack. To improve the robustness of item-based CF, the authors propose a novel CF approach based on the mostly used relationships between users. In the paper, three most commonly used relationships between users are analyzed and applied to construct several user models at first. The DBSCAN clustering is then utilized to select the valid user model in accordance with how the models benefit detecting spam users. The selected model is used to detect spam user group. Finally, a detection-based CF method is proposed for the calculation of item-item similarities and rating prediction, by setting different weights for suspicious spam users and normal users. The experimental results demonstrate that the proposed approach provides a better robustness than the typical item-based kNN (k Nearest Neighbor) CF approach.
1. Introduction Nowadays, personalized recommendation systems have been widely used as an effective way to help people cope with information overload [1, 2]. It automatically adjusts, restructures, and presents tailored information for individuals by analyzing user information, creating one-to-one relationship, or understanding user needs in different contexts [3–6]. Until now, CF is the most popular approach used in personalized recommendation systems. Approaches for CF recommendation can be grouped into two general classes [7–11]: user-based and item-based. Both the typical user-based and item-based CF approaches, however, suffer from “Shilling” attacks [12] because users of online systems can multiply their profiles and identities nearly indefinitely. Thus, the systems that depend on such profiles would be subject to control by an attacker bent on making the system recommend as he or she desires [12– 17]. It is a common knowledge that some users’ ratings in recommendation systems are more valuable than those of others. If there is an approach that makes the credit ratings
(or ranks, weights) of spam users [15] made up by an attacker less than those of normal users, the antiattack ability of recommendation systems would be improved. There are several kinds of relationships between the users usually used in item-based CF, such as similarities and correlations. In this paper, an approach based on these relationships is proposed to calculate the relative weights of users and to improve the attack resistant ability of typical item-based CF approaches further. The proposed approach is constructed by the following four steps: three kinds of relationships between users are selected to construct user models; a density-based clustering algorithm is then used to select the best user model; the model is then applied to detect spam users; the detection results are incorporated into an approach for the calculation of item-item similarities and rating prediction. Finally, the experimental results illustrate that the proposed approach is able to provide a better robustness (the stability of prediction and hit ratio) than (1) a mostly used item-based kNN CF (similarity-based CF) recommendation approach and (2) other robust recommendation approaches.
2
Mathematical Problems in Engineering IF i1F
···
IS
I0
ikF
i10
···
𝜎(i1F ) · · · 𝜎(ikF ) Null · · ·
il0
i1S
···
IT S im
i1T
···
inT
S S Null 𝛿(i1 ) · · · 𝛿(im ) 𝛾(i1T ) · · · 𝛾(inT )
Figure 1: The general form of an attack profile.
The rest of this paper is organized as follows: Section 2 presents the background of item-based CF approaches and their related problems. Section 3 presents the proposed methods for how to select user models, how to detect and mark suspicious spam users and normal users, and how to calculate item-item similarities and predictions according to the detection. Section 4 presents experimental results of the proposed approach on MovieLens dataset and analyzes if the approach is effective in comparison with the typical item-based CF approach and other robust recommendation approaches. Section 5 draws conclusions.
2. Background and Associated Problem of Item-Based CF Approaches CF is the mostly used and most successful recommendation technique to date [18–20]. The traditional CF, user-based CF, is to predict the rating of an item for a target user based on the opinions of other like-minded users. It was remarkably successful in the past, but some potential challenges have arisen [21] such as problems in scalability, that means that the computational complexity is growing rapidly with the number of users. The item-based CF has been proved to solve the problem [9]. Both the user-based and item-based CF approaches, however, suffer from “Shilling” attacks. 2.1. Shilling Attack Problem. An attack that influences a recommendation system is to arrange with a group of users, named shills [20] or spam users [14], to enter the system and vouch for items in question. Their ratings are intended to mislead other users. The attacks are, therefore, called shilling attacks (or profile injection attacks [12]). An attack consists of a set of attack profiles (also named attack ratings). An attack model is an approach to construct attack profiles. The general form of an attack profile is shown in Figure 1 [14]. Suppose that there are 𝑝 items in total in a recommendation system; an attack profile consists of 𝑝-dimensional vector of ratings. The 𝑝-dimensional vector can be divided into 4 sets: 𝐼𝐹 , 𝐼0 , 𝐼𝑆 , and 𝐼𝑇 . Here, 𝑝 = |𝐼𝐹 | + |𝐼0 | + |𝐼𝑆 | + |𝐼𝑇 | = 𝑘 + 𝑙 + 𝑚 + 𝑛. 𝐼𝐹 (𝑖1𝐹∼ 𝑖𝑘𝐹 ) is a set of randomly selected filler items. 𝑆 ) is a set of selected 𝐼0 (𝑖10∼ 𝑖𝑙0 ) is a set of unrated items. 𝐼𝑆 (𝑖1𝑆∼ 𝑖𝑚 items which have some relationships with the target items. 𝐼𝑇 (𝑖1𝑇∼ 𝑖𝑛𝑇 ) is a set of target items. Several attack models have been identified, such as random attack and average attack [13], and the newer models, bandwagon and segment model [22]. The bandwagon attack model is designed by giving high ratings on the most popular items [14] with the following
characteristics: (1) 𝐼𝑆 : all items in 𝐼𝑆 are the most popular items that are assigned to 𝑟max (𝛿(𝑖𝑘𝑆 ) = 𝑟max ); (2) 𝐼𝐹 : all items in 𝐼𝐹 are assigned to random values that are in line with normal distribution (𝜎(𝑖𝑘𝐹 ) = 𝑟𝑎𝑛𝑑𝑜𝑚 V𝑎𝑙𝑢𝑒𝑠); (3) 𝐼𝑇 : all items in 𝐼𝐹 are assigned to 𝑟max (𝛾(𝑖𝑘𝑇 ) = 𝑟max ). The segment attack model is designed to push an item to a targeted group (segment) of users with known or easily predicted preferences [22]. It has the following characteristics: (1) 𝐼𝑆 : all items in 𝐼𝑆 are assigned to 𝑟max (𝛿(𝑖𝑘𝑆 ) = 𝑟max ); (2) 𝐼𝐹 : all items in 𝐼𝐹 are assigned to 𝑟min (𝜎(𝑖𝑘𝐹 ) = 𝑟min ); (3) 𝐼𝑇 : all items in 𝐼𝐹 are assigned to 𝑟max (𝛾(𝑖𝑘𝑇 ) = 𝑟max ). Research in the area of shilling attacks has made significant advances in last years. User-based CF makes recommendations by finding peers with preference profiles; consequently, the profiles with biased data may result in biased recommendations easily. Item-based CF looks for items with similar profiles and makes predictions based on a user’s own ratings of the peer items; therefore, the item-based CF also suffers from the attacks. Random attack and average attack models are successful against the user-based CF algorithms; however, they fall short of having a significant impact against the item-based CF algorithms [13]. The newer models, bandwagon and segment model, are quite successful against item-based CF algorithms [22]. In these attack models, random and bandwagon attacks belong to low knowledge attacks [13] which need minimal knowledge of recommendation systems and user profiles. For experimental purpose, the bandwagon attack is adopted in the paper since it is a low knowledge attack and quite successful against item-based CF. 2.2. Shilling Attack Resistant CF. A number of recent studies have been focusing on the robust CF, due to the vulnerability of the recommendation systems that are easily to be attacked. O’Donovan and Smyth [23] proposed that the trustworthiness of users should be taken into consideration in recommendation systems. Their trust models can improve the predictive accuracy. Massa and Avesani [24] proposed a robust CF approach, also called trust-based CF, based on “web of trust.” The approach increases the coverage of recommendation systems while preserving the quality of predictions, especially for new users. However, the predictive accuracy and the coverage of recommendation systems are not the essential metrics for robust recommendation systems [25]. Zhang [26] proposed a trust-aware CF based on users’ multiple interests. He proposed a topic-level trust model and a CF approach based on the model. The approach improves the robustness of the recommendations. However, all those three levels of the trust model are based on the number of user ratings. The relationships and weights among users are essential to a recommendation system. Yu et al. [27] proposed a reputation-based approach for decoding information from noisy, redundant, and intentionally distorted sources. Zhou et al. [28] proposed correlation-based reputation algorithm to solve the ranking problem of rating systems. Shang et al. [29] presented that relevance information can outperform the mostly used Pearson correlation coefficient under the
Mathematical Problems in Engineering
Input Rating matrix
User model (s)
User weighting
3
Output Rating predicting
Item-item similarity computing
Predicted ratings
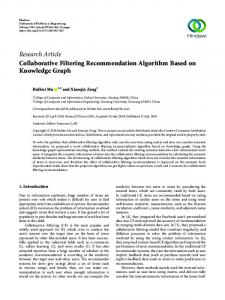
Figure 2: The architecture of the proposed CF approach.
standard collaborative filtering framework, especially for sparse data set. Thanks to these researches because we are provided with valuable input to our approach. In the paper, the user models are formed by the relationships of users, in which not only the numbers of user ratings but also the ratings themselves are taken into account. Three kinds of mostly used relationships between users are selected to construct user models firstly. The best user models then are experimentally selected for detecting and weighting users. The rating weights for the users are incorporated into a typical item-based CF finally. The proposed models and the approach can further improve the robustness of recommendation approaches. They will be discussed in detail in Section 3.
than same ratings [29]. In the paper, this relationship is called interest similarity, shortly named In Sim, which represents how two users are interested in the items, in a recommendation system. In addition to those relationships, Gao and Wu [21] pointed out that the covariance between ratings is an important measure because it represents the linear dependence between the ratings of users. In practice, however, correlation coefficient (Corr coef ) instead of covariance is usually used in measuring the linear dependence between two variables because it gives a value between −1 and 1 inclusive. The linear dependence is also usually used as user similarity in recommendation systems. Thus, in the paper, the linear dependence (L depd) is considered as the third relationship in the model, which means how the ratings of two users change together. Therefore, these three kinds of relationships, interest similarity, rating similarity, and linear dependence, are taken into consideration in the research. The interest similarity of users 𝑢 and V can be calculated by (1). The more items have been rated by both user 𝑢 and V, the closer the users are [19]. We define 𝐼(𝑢) as the set of items rated by the user 𝑢; 𝐼(V) is similar to 𝐼(V). 𝐼(𝑢, V) is the set of items rated by both users 𝑢 and V. Consider
3. User Relationships-Based Robust CF To achieve a robust collaborative recommendation approach, the spam users are detected based on users’ relationships and the detection results, represented by weights, are incorporated into item similarity computing (see Figure 2). The paper adopts the definition of robustness for collaborative recommendation, the ability to make recommendations despite noisy product ratings [23]. The approach takes the rating matrix as input and takes predicted ratings as output. In data modeling module, three kinds of user relationships are taken into consideration, which are interest similarity, rating similarity, and rating linear dependence. In user weighting module, clustering-based detection results are applied to produce the weights of users. Then the weights are incorporated into item-item similarity calculations and further predictions. 3.1. The Analysis of User Relationships. There are different relationships between users in a recommendation system, just as there are various relationships in any social group. The relationships are exploited to construct user models for the detection of spam user. Traditionally, ratings similarity is the most used relationship between users in recommendation systems [18]. The rating similarity is shortly named R Sim to measure how much two users’ ratings are similar to each other. The rating similarity, however, is only one aspect of the user relationship. There are other relationships behind the ratings [29]. For example, which many items are rated by both user 𝑢 and user V; the ratings are extremely different, however. In this case, the rating similarity of them is very low. Nevertheless, there should be a similarity between them is high since the rating sets of them are similar. Especially, if the data set is very sparse, rating on same items is more important
𝐼𝑛𝑆𝑖𝑚(𝑢,V) =
|𝐼 (𝑢) ∩ 𝐼 (V)| . |𝐼 (𝑢) ∪ 𝐼 (V)|
(1)
The rating similarity of users 𝑢 and V can be calculated by Cosine, the most used measure for the calculation of similarities among users (see (2)). Here, the rating 𝑟𝑢,𝑖 means how the user 𝑢 prefers the item 𝑖. The rating 𝑟V,𝑖 is similar to 𝑟𝑢,𝑖 . 𝐼 is the set of items. onsider 𝑅𝑆𝑖𝑚(𝑢,V) =
∑𝑖∈𝐼 𝑟𝑢,𝑖 𝑟V,𝑖 √∑𝑖∈𝐼 (𝑟𝑢,𝑖 )2 √∑𝑖∈𝐼 (𝑟V,𝑖 )2
.
(2)
The linear dependence between the ratings of user 𝑢 and those of user V can be calculated by Pearson Corr coef (see (3)). The Corr coef is defined as the covariance of the variables divided by the product of their standard deviations. Consider 𝐿 𝑑𝑒𝑝𝑑 (𝑢, V) =
∑𝑖∈𝐼(𝑢)∩𝐼(V) (𝑟𝑢,𝑖 − 𝑟𝑢 ) (𝑟V,𝑖 − 𝑟V ) 2
√∑𝑖∈𝐼(𝑢)∩𝐼(V) (𝑟𝑢,𝑖 − 𝑟𝑢 ) √∑𝑖∈𝐼(𝑢)∩𝐼(V) (𝑟V,𝑖 − 𝑟V )
2
.
(3)
Here, 𝑟𝑢 is the average of the 𝑢’s ratings on the items in 𝐼(𝑢) ∩ 𝐼(V), 𝑟𝑢 = ∑𝑖∈𝐼(𝑢)∩𝐼(V) 𝑟𝑢,𝑖 /|𝐼(𝑢) ∩ 𝐼(V)|; 𝑟V is similar to 𝑟𝑢 . So far, three relationships form three matrixes R Sim, In Sim, and L depd. Table 1 shows three pair correlations between R Sim, In Sim, and L depd matrices before and after bandwagon attacks with 10% attack size and 10% filler size. 3.2. Construction of User Models. The combinations of the matrixes, In Sim, R Sim, and L depd, can form seven different
4
Mathematical Problems in Engineering
Correlations (In Sim, R Sim) (In Sim, L depd) (R Sim, L depd)
Before attacks 0.627 0.097 0.103
After attacks 0.540 0.119 0.103
0.8 0.7 0.6
0.5 0.45 0.4 0.35 0.3 0.25 0.2 0.15 0.1 0.05 0 [−1 ∼ −0.9] (−0.9 ∼ −0.8] (−0.8 ∼ −0.7] (−0.7 ∼ −0.6] (−0.6 ∼ −0.5] (−0.5 ∼ −0.4] (−0.4 ∼ −0.3] (−0.3 ∼ −0.2] (−0.2 ∼ −0.1] (−0.1∼ 0] (0∼ 0.1] (0.1 ∼ 0.2] (0.2 ∼ 0.3] (0.3 ∼ 0.4] (0.4 ∼ 0.5] (0.5 ∼ 0.6] (0.6 ∼ 0.7] (0.7 ∼ 0.8] (0.8 ∼ 0.9] (0.9 ∼ 1]
Table 1: The pair correlations between R Sim, In Sim, and L depd matrices.
Normal users Attack size = 10%, filler size = 10% Attack size = 5%, filler size = 5% Attack size = 20%, filler size = 20%
0.5 0.4 0.3
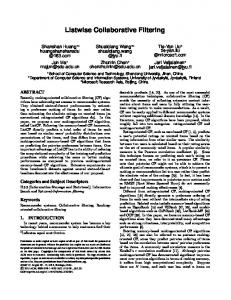
Figure 4: The distributions of the slotted L depd under bandwagon attacks.
0.2 0.1 [−1 ∼ − 0.9] (−0.9 ∼ − 0.8] (−0.8 ∼ − 0.7] (−0.7 ∼ − 0.6] (−0.6 ∼ − 0.5] (−0.5 ∼ − 0.4] (−0.4 ∼ − 0.3] (−0.3 ∼ − 0.2] (−0.2 ∼ − 0.1] (−0.1 ∼ 0] (0 ∼ 0.1] (0.1 ∼ 0.2] (0.2 ∼ 0.3] (0.3 ∼ 0.4] (0.4 ∼ 0.5] (0.5 ∼ 0.6] (0.6 ∼ 0.7] (0.7 ∼ 0.8] (0.8 ∼ 0.9] (0.9 ∼ 1]
0
In Sim R Sim L depd
Figure 3: The distribution charts of Slotted In Sim, Slotted R Sim Csn, and Slotted L depd.
user models, such as (In Sim, R Sim, L depd) and (In Sim, R Sim). Please note that the user model constructed by (R Sim, In Sim) is similar to the model constructed by (In Sim, R Sim). All those three matrixes are (|𝑈| × |𝑈|) dimensional matrixes. |𝑈| is the cardinality of the set of users. A vector from the combinations of the three matrixes can be used to represent a user, which is high dimensional data. To decrease the dimension, the matrixes are experimentally analyzed. It is found that those In Sim and R Sim values can be, respectively divided into 10 slots, respectively, (0 to 1, 0.1 intervals); those L depd values for every user can be divided into 20 slots (−1 to 1, 0.1 intervals). Figure 3 is the distribution chart of Slotted In Sim, Slotted R Sim, and Slotted L depd. Slotted In Sim is a (|𝑈| × 10) matrix that records the distribution of the interest similarities for all users. It is formed by ten attributes that are the slots from 0 to 1, 0.1 intervals. The values of the attributes is in [0, 1]. Slotted R Sim is a (|𝑈| × 10) matrix that records the distribution of the rating similarities for all users. The definitions and values of attributes of slotted R Sim are similar to those of slotted In Sim. Slotted L depd is a (|𝑈| × 20) matrix that records the distribution of linear dependence for all users. The twenty
attributes of Slotted L depd are the slots from −1 to 1, 0.1 intervals. The values of the attributes are in [0, 1]. Thus, the seven user models formed by the combinations can be simplified to the combinations of slotted In Sim, slotted R Sim, and slotted L depd. In those user models, each user can be represented by ten to forty attributes. Attacks will make similarities among spam users which are greater than similarities among normal users. Therefore, the weighting problem can be seen as a clustering related problem. Density-based clustering algorithm DBSCAN [30, 31] is chosen to group users in the research because it can discover arbitrary shaped clusters and good efficiency on large databases. DBSCAN groups the users who are dense and can be connected into a single cluster. DBSCAN is applied on all those user models to find which one will be most helpful to detect the group of spam users. In the DBSCAN algorithm, a user will be a core of a group when his/her neighbors are equal to or more than 𝑘. Two users will be neighbors when the distance of their attributes is less than 0.05. The bandwagon attack is used to analyze how the attributes are beneficial to the clustering. The attacking size and filler size are 5% and 5%, and 10% and 10%; the number of attacked items is 1. The attacks can be push attacks or nuke attacks according to if it is to raise the predicted rating of a target item. A push attack will raise the rating; otherwise it is a nuke attack. Push attacks are taken into account in this paper. Figures 4 and 5 represent the distributions of Slotted L depd and Slotted R Sim values of normal users and spam users. The attack sizes and filler sizes are 5%, 5%; 10%, 10%; and 20%, 20%, respectively, in Figure 4. Those are 5%, 5%; 10%, 10%; and 15%, 5%, respectively, in Figure 5. In these figures, the distribution of spam users are much obviously different from those of normal users with increasing of attack size and filler size. As seen from Table 2, the (Slotted In Sim, Slotted R Sim) is the best combination among them. Consequently, the attributes from Slotted In Sim and Slotted R Sim are chosen to detect spam users. The precisions of other user models
Mathematical Problems in Engineering
5
Table 2: Detection results based on user models. Precision recall Attacks Attack size = 5% Attack size = 10% Filler size = 5% Filler size = 10% 0.85 0.99 0.62 0.79 0.96 1 0.72 0.82 0.95 1 0.98 0.95
User models (Slotted In Sim, Slotted L depd) (Slotted R Sim, Slotted L depd) (Slotted R Sim, Slotted In Sim)
There are several algorithms for computing item-item similarities, such as cosine, correlation, and adjusted cosinebased similarity [18]. Adjusted cosine is the mostly used algorithm to calculate the similarities between items because it is reasonably accurate, widely used, and easily analyzed [25]. Thus, in the WIKCF, adjusted cosine is utilized to calculate item similarities: 𝑆𝑖𝑚𝑖,𝑗 = (
∑
𝑢∈𝑈(𝑖)∩𝑈(𝑗)
× (√
1 0.9 0.8 0.7 0.6 0.5 0.4 0.3 0.2 0.1 0
(𝑟𝑢,𝑖 − 𝑟𝑢 ) × (𝑟𝑢,𝑗 − 𝑟𝑢 ) × 𝑤𝑢2 )
2
(𝑟𝑢,𝑖 − 𝑟𝑢 ) × 𝑤𝑢 2
∑
(4)
𝑢∈𝑈(𝑖)∩𝑈(𝑗)
−1
(0.9 ∼1]
(0.8 ∼0.9]
(0.7 ∼0.8]
(0.6 ∼0.7]
(0.5 ∼0.6]
(0.4 ∼0.5]
(0.3 ∼0.4]
(0.2 ∼0.3]
(0.1 ∼0.2]
(0 ∼0.1]
(−0.1 ∼0]
×√
Normal users Attack size = 10%, filler size = 10% Attack size = 5%, filler size = 5% Attack size = 15%, filler size = 15%
Figure 5: The distributions of the slotted R Sim under bandwagon attacks.
∑
2
(𝑟𝑢,𝑗 − 𝑟𝑢 ) × 𝑤𝑢 2 ) .
𝑢∈𝑈(𝑖)∩𝑈(𝑗)
Here, 𝑈(𝑖) is the set of users who have rated on item 𝑖. Formally, 𝑈(𝑖) = {𝑢 | 𝑟𝑢,𝑖 ≠ 0}. 𝑟𝑢 is the average ratings of user 𝑢’s. The 𝑤𝑢 is the weight of user 𝑢. In order to estimate a rating, the most used weighted sum is applied to predict ratings for users, which is the crucial step in a CF recommendation system. Consider ∑𝑗∈𝐼(𝑢) 𝑠𝑖𝑚𝑖,𝑗 × 𝑟𝑢,𝑗 , ∑𝑗∈𝐼(𝑢) 𝑠𝑖𝑚𝑖,𝑗 where 𝐼(𝑢) is the set of items rated by user 𝑢. 𝑝𝑢,𝑖 =
(5)
4. Experimental Evaluations unlisted in the table are no more than 20%. Most of those models even cannot find any spam user. With increasing of attack size, filler size, and the number of attack items, most of the user models emerge remarkable results. That is because the characteristics of attack users become much more obvious. 3.3. Detection-Based Item Similarity Calculation and Rating Prediction. As discussed previously, item-based CF is proposed to compute the similarities between items and then to choose the most similar items for prediction [18]. The theory behind is to compare items based on the pattern of ratings across users. In the research, the rating weights of users are incorporated with one of similarity-based algorithms [1], named item-based kNN collaborative filtering (shortened to IKCF). As mentioned in Section 3.2, the sets of suspicious users will be obtained when DBSCAN algorithm is applied to the twenty attributes of Slotted R Sim and Slotted In Sim. The new algorithm we proposed is a weighted item-based kNN collaborative filtering approach (named WIKCF). If the users in the spam user group, then their weights should be extremely small; otherwise, the weight should be large. In the research, the weight 𝑤𝑢 of user 𝑢 is simply set to 1 when he/she is not in the suspicious spam group or 0 when he/she is in the suspicious group.
4.1. Dataset. The widely used MovieLens dataset is utilized to evaluate the proposed approach. MovieLens [32] is a free service provided by GroupLens Research at the University of Minnesota (http://www.movielens.org). The site had over 43,000 users who had rated more than 3,500 different movies. There are two datasets in the MovieLens project. One includes 1,000,209 anonymous ratings (1–5) of approximately 3,900 movies made by 6,040 users who joined MovieLens in 2000. Another dataset consists of 100,000 ratings from 943 users on 1,682 movies. Each user has rated at least 20 movies. The latter dataset has been used in the experiments. The dataset was randomly divided into a training set (80,000 ratings) and a test set (20,000 ratings) 50 times. The training and test sets are named 𝑈𝑖 base and 𝑈𝑖 test (𝑖 = 1, . . . , 50). 4.2. Evaluation Metric. Three metrics are used to evaluate the algorithms: mean absolute error (MAE [19]), predictions shift [18], and hit ratio [14] shift. MAE is a broadly used metric for the deviation of predictions from their true values. Prediction shift and hit ratio shift are mostly used metrics for measuring the robustness of the recommendation systems. For all predictions {𝑝1 , 𝑝2 , . . . , 𝑝𝑛 } and corresponding real ratings {𝑟1 , 𝑟2 , . . . , 𝑟𝑛 }, ∑𝑁 𝑝 − 𝑟 (6) MAE = 𝑖=1 𝑖 𝑖 𝑁
6
Mathematical Problems in Engineering
− 𝑝𝑢,𝑖 )
|𝑈| |𝐼|
.
(7)
Hit ratio shift =
|𝑈|
20%, 10%
15%, 10%
10%, 10%
Attack size and filler size IKCF, 20 target items IKCF, 10 target items
WIKCF, 20 target items WIKCF, 10 target items
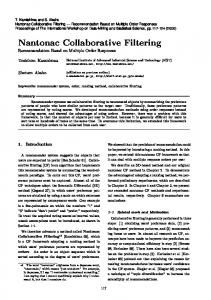
Figure 6: Prediction shift values comparison of IKCF and WIKCF.
The experimental procedure included the following steps: (1) to get R Sim Csn, R AdjSim Csn, and In Sim of users,
.
(8)
Here, 𝐻𝑢 and 𝐻𝑢 are the hit ratios of the users in the test set, after and before the attacks. 4.3. Experimental Methodology. In the experiments, 10, 15, and 20 items are randomly selected as the target items, respectively. The two metrics of prediction shift and hit ratio shift are used to measure the relative performance of robustness of the algorithms. The values of these metrics are plotted against the size of the attacks reported as the number of spams and a percentage of the total number of users in the system. The 𝑘 for the kNN of items was set to 20. The users in the segment had similar ratings on 10 randomly selected items. To test the robustness of the recommendation algorithms, the applied attack models, attack size, and filler size are listed below. (i) Attack model is bandwagon attack. (ii) Attack size is the percentage of attack profiles, valued 5%, 10%, 15%, and 20%, respectively. (iii) Filler size is the percentage of the filler ratings (𝐼𝐹 ) in the attacks, valued 5% and 10%, respectively. The settings of the attack profiles are as follows: (i) 𝐼𝐹 : the randomly filling items were assigned to random valued by its mean 𝜇 = 3.6 and variance 𝜎2 = 1.1; (ii) 𝐼𝑆 : the selected items were the first 𝑛 items rated by most users, 𝑛 = 20; the selected items were assigned to 𝑟max (𝑟max = 5); (iii) 𝐼𝑇 : the target items were assigned to 𝑟max .
0.0
5%, 10%
0.1
and 𝑝𝑢,𝑖 are the predicted ratings after In the formula, 𝑝𝑢,𝑖 and before the attacks, 𝑈 is the set of users and 𝐼 is the set of items in the test set, and the abs function indicates the − 𝑝𝑢,𝑖 . absolute value of 𝑝𝑢,𝑖 In a recommendation system, users are usually interested in the first 𝑛 items in the recommendation list. The changes of predicted values may not trigger the change of the recommendation list. Hit ratio is the average number of hits across all the users in the test set [14]. In the paper, the hit ratio indicates the ratio the first 𝑛 items in the recommendation hit the first 𝑛 items in the test set. Hit ratio shift models the difference between average hit ratios of all users, after and before the attacks:
∑𝑢∈𝑈 abs (𝐻𝑢 − 𝐻𝑢 )
0.2
20%, 5%
𝑢,𝑖
0.3
15%, 5%
∑𝑖∈𝐼 ∑𝑢∈𝑈 abs (𝑝
0.4
10%, 5%
Prediction shift =
0.5
5%, 5%
0.6
Prediction shift
is the average of absolute error between all {𝑝𝑖 , 𝑟𝑖 } pairs. The lower the MAE is, the better the proposed approach is. Prediction shift models the difference between average predicted ratings of all the ratings in the test set, after and before the attacks [18]:
(2) to calculate their SRSC, SRSA, and SIS, (3) to compute the rating weights of users applying DBSCAN algorithm, (4) to predict ratings in U i test using WIKCF and compare the predicted ratings with the real ratings in U i test to get the values of MAE, prediction shift, and hit ratio shift, (5) to predict ratings in U i test applying IKCF and calculate the values of MAE, prediction shift, and hit ratio shift, (6) to fill attacks into rating matrix (U i base) with different attack sizes and filler sizes then repeat the steps 1–5 several times (see the above settings). 4.4. The Experimental Results and Analysis 4.4.1. Comparisons of Prediction Shift Values. The values of prediction shift are emphasized in Figure 5, in which the impact of the attack is compared between IKCF and WIKCF. The 𝑥-axis depicts the different attack sizes and filler sizes: the former are 5%, 10%, 15%, and 20%; the latter are 5% and 10%. The 𝑦-axis indicates the prediction shift values. In Figure 6, the light and dark gray bars are the results of IKCF; the light and dark blue bars are the results of WIKCF. The bars indicate the prediction shifts when the system suffered from the attacks. In the attacks, the numbers of the target items are 10 and 20. The figure illustrates that the predicted ratings of the adjusted cosine algorithm changed a lot when the system suffers from the attacks with different attack sizes and filler sizes. The greater the attack sizes and filler sizes, the greater the change. Compared with IKCF, the predicted ratings of WIKCF change a little at any attack size and filler size.
Mathematical Problems in Engineering
7
Table 3: MAE values. IKCF 0.837
WIKCF 0.829
0.8 0.7
Hit ratio shift
0.6 0.5 0.4 0.3 0.2
20%, 10%
15%, 10%
10%, 10%
5%, 10%
20%, 5%
15%, 5%
10%, 5%
0.0
5%, 5%
0.1
Attack size and filler size IKCF, top 10 IKCF, top 20
WIKCF, top 10 WIKCF, top 20
Figure 7: Hit ratio shift values comparison of IKCF and WIKCF.
4.4.2. Comparisons of the Values of Hit Ratio Shift. The hit ratio shifts are emphasized in Figure 7, in which the impact of the attack is compared between IKCF and WIKCF algorithms. Similar to Figure 6, the 𝑥-axis depicts the different attack sizes and filler sizes: the former are 5%, 10%, 15%, and 20%; the latter are 5% and 10%. The 𝑦-axis indicates the values of hit ratio shifts. In Figure 7, the light and dark gray bars are the results of IKCF; the light and dark blue bars are the results of WIKCF, which indicate the hit ratio shifts under the attacks. The number of the target items is 10 in the attacks. The hit ratios were computed according to the top 10 and 20 items in the recommendation list and U i test. The figure shows that the hit ratio of IKCF changed a lot when the system suffered from the attacks with different attack sizes and filler sizes. The greater the attack sizes and filler sizes, the greater the change of WIKCF. Compared with IKCF, the hit ratio values of WIKCF change little at any attack size and filler size. 4.4.3. Comparison of MAE Values. As illustrated in Table 3, MAE values of two algorithms are almost the same. 4.4.4. Experimental Analysis. It is easily found from Table 3, Figures 6, and 7 that the robustness of WIKCF is in a higher degree than IKCF with MAE values compared with IKCF. The robustness has been demonstrated by the following: (1) the prediction shift and hit ratio shift of WIKCF are less than those of IKCF are and (2), with the increasing of attack size and filler size, the impact of the attack is growing to IKCF; however, the impact of the attack is stable to WIKCF. A possible reason is that the rating weights of the users are not
taken into consideration in the baseline approaches; in other words, the weights of spam users and normal users are the same. 4.5. The Comparisons with Related Works. Zhang [26] proposed a trust-aware CF approach based on users’ multiple interests to provide robust recommendations and tested it against MovieLens dataset. He applied random and average attack models to test his user-based CF algorithm. Similar results for user-based CF can be found from Mehta and Nejdl [33], in which a matrix factorization strategy (VarSelectSVD) is used, under 5% average attacks and 7% filler. As mentioned before, those models are successful against the user-based CF rather than item-based CF algorithms, such as bandwagon and segment models, which are quite successful against item-based CF algorithms. Therefore, in the research, the bandwagon models are applied against the proposed itembased CF algorithm. Mobasher et al. [13] applied 𝑘NN supervised classification for user-based and item-based CF on the MovieLens 100 K dataset by using 15 detection attributes that include six generic attributes, six attributes of average attack model, and three attributes of group attack model. Despite the weak comparability, the experimental results are given for reference: the prediction shifts of Zhang’s research [14] are in the range of 0.2∼0.5, the shifts experimental results in this research are less than 0.1, and the hit ratio shifts of his work are similar to the experimental results of this research. The prediction shifts from Hurley are about 0.1∼0.3 [34] under bandwagon attacks, but the results in this research are less than 0.1.
5. Conclusions In this paper, three usually used user relationships and the construction of user models have been analyzed at first. Then the best user models have been selected based on clustering method according to the results of spam user detection. Finally, a detection-based approach has been proposed for the calculation of item similarities and ratings prediction. The experimental results in this research demonstrate that the most used relationships, interesting similarity and rating similarity, are important to detect spam users; density-based clustering algorithm is effective to detect spam users; the detection-based filtering approach does benefit improving the robustness of the typical item-based kNN CF recommendation approach.
Conflict of Interests The authors declare that there is no conflict of interests regarding the publication of this paper.
Acknowledgments This research is supported by the National Natural Science Foundation of China (71102065), the National Key Basic Research Program of China (973) (2013CB328903), and the China Postdoctoral Science Foundation (2012M521680).
8
References [1] L. L¨u, M. Medo, C. H. Yeung, Y.-C. Zhang, Z.-K. Zhang, and T. Zhou, “Recommender systems,” Physics Reports, vol. 519, no. 1, pp. 1–49, 2012. [2] X. Luo, Y. Xia, and Q. Zhu, “Incremental collaborative filtering recommender based on regularized matrix factorization,” Knowledge-Based Systems, vol. 27, pp. 271–280, 2012. [3] E. Frias-Martinez, G. Magoulas, S. Chen, and R. Macredie, “Automated user modeling for personalized digital libraries,” International Journal of Information Management, vol. 26, no. 3, pp. 234–248, 2006. [4] Q. Liu, E. Chen, H. Xiong, C. H. Q. Ding, and J. Chen, “Enhancing collaborative filtering by user interest expansion via personalized ranking,” IEEE Transactions on Systems, Man, and Cybernetics B, vol. 42, no. 1, pp. 218–233, 2012. [5] M. Gao, Z. Wu, and F. Jiang, “Userrank for item-based collaborative filtering recommendation,” Information Processing Letters, vol. 111, no. 9, pp. 440–446, 2011. [6] A. Said, B. J. Jain, and S. Albayrak, “Analyzing weighting schemes in collaborative filtering: cold start, post cold start and power users,” in Proceedings of the 27th Annual ACM Symposium on Applied Computing, pp. 2035–2040, ACM, 2012. [7] G. Linden, B. Smith, and J. York, “Amazon.com recommendations: item-to-item collaborative filtering,” IEEE Internet Computing, vol. 7, no. 1, pp. 76–80, 2003. [8] T.-P. Liang, Y.-F. Yang, D.-N. Chen, and Y.-C. Ku, “A semanticexpansion approach to personalized knowledge recommendation,” Decision Support Systems, vol. 45, no. 3, pp. 401–412, 2008. [9] G. Adomavicius and A. Tuzhilin, “Toward the next generation of recommender systems: a survey of the state-of-the-art and possible extensions,” IEEE Transactions on Knowledge and Data Engineering, vol. 17, no. 6, pp. 734–749, 2005. [10] F. Cacheda, V. Carneiro, D. Fern´andez, and V. Formoso, “Comparison of collaborative filtering algorithms: limitations of current techniques and proposals for scalable, high-performance recommender systems,” ACM Transactions on the Web, vol. 5, no. 1, article 2, 2011. [11] A. S. Das, M. Datar, A. Garg, and S. Rajaram, “Google news personalization: scalable online collaborative filtering,” in Proceedings of the 16th International World Wide Web Conference (WWW ’07), pp. 271–280, Alberta, Canada, May 2007. [12] B. Mobasher, R. Burke, C. Williams, and R. Bhaumik, “Analysis and detection of segment-focused attacks against collaborative recommendation,” Lecture Notes in Computer Science, vol. 4198, pp. 96–118, 2006. [13] B. Mobasher, R. Burke, R. Bhaumik, and C. Williams, “Toward trustworthy recommender systems: an analysis of attack models and algorithm robustness,” ACM Transactions on Internet Technology, vol. 7, no. 4, article 23, pp. 2301–2338, 2007. [14] B. Mehta, T. Hofmann, and P. Fankhauser, “Lies and propaganda: detecting spam users in collaborative filtering,” in Proceedings of the 12th International Conference on Intelligent User Interfaces (IUI ’07), pp. 14–21, January 2007. [15] B. Mehta, T. Hofmann, and W. Nejdi, “Robust collaborative filtering,” in Proceedings of the 1st ACM Conference on Recommender Systems (RecSys ’07), pp. 49–56, October 2007. [16] P. Massa and P. Avesani, “Trust-aware collaborative filtering for recommender systems,” Lecture Notes in Computer Science, vol. 3290, pp. 492–508, 2004.
Mathematical Problems in Engineering [17] J.-S. Lee and D. Zhu, “Shilling attack detection-a new approach for a trustworthy recommender system,” INFORMS Journal on Computing, vol. 24, no. 1, pp. 117–131, 2012. [18] B. Sarwar, G. Karypis, J. Konstan, and J. Reidl, “Item-based collaborative filtering recommendation algorithms,” in Proceedings of the 10th International Conference on World Wide Web, pp. 285–295, Hong Kong, 2001. [19] M. O’Mahony, N. Hurley, N. Kushmerick, and G. Silvestre, “Collaborative recommendation: a robustness analysis,” ACM Transactions on Internet Technology, vol. 4, no. 4, pp. 344–377, 2004. [20] D. Lemire and A. Maclachlan, “Slope one predictors for online rating-based collaborative filtering,” Society for Industrial Mathematics, vol. 5, pp. 471–480, 2005. [21] M. Gao and Z. Wu, “Personalized context-aware collaborative filtering based on neural network and slope one,” Lecture Notes in Computer Science, vol. 5738, pp. 109–116, 2009. [22] B. Mobasher, R. Burke, R. Bhaumik, and C. Williams, “Effective attack models for shilling item-based collabora-tive filtering systems,” in Proceedings of the WebKDD Workshop, pp. 13–23, Citeseer, Chicago, Ill, USA, 2005. [23] J. O’Donovan and B. Smyth, Trust in Recommender Systems, IUI, Association for Computing Machinery, New York, NY, USA, 2005. [24] P. Massa and P. Avesani, “Trust-aware recommender systems,” in Proceedings of the 1st ACM Conference on Recommender Systems (RecSys ’07), pp. 17–24, October 2007. [25] M. O’Mahony, N. Hurley, and G. Silvestre, “Promoting recommendations: an attack on collaborative filtering,” Lecture Notes in Computer Science, vol. 2453, pp. 213–241, 2002. [26] F. Zhang, “Research on trust based collaborative filtering algorithm for user’s multiple interests,” Journal of Chinese Computer Systems, vol. 29, pp. 1415–1419, 2008. [27] Y.-K. Yu, Y.-C. Zhang, P. Laureti, and L. Moret, “Decoding information from noisy, redundant, and intentionally distorted sources,” Physica A, vol. 371, no. 2, pp. 732–744, 2006. [28] Y.-B. Zhou, T. Lei, and T. Zhou, “A robust ranking algorithm to spamming,” EPL, vol. 94, no. 4, Article ID 48002, 2011. [29] M.-S. Shang, L. L¨u, W. Zeng, Y.-C. Zhang, and T. Zhou, “Relevance is more significant than correlation: information filtering on sparse data,” EPL, vol. 88, no. 6, Article ID 68008, 2009. [30] H.-P. Kriegel, P. Kr¨oger, J. Sander, and A. Zimek, “Density-based Clustering,” WIREs Data Mining and Knowledge Discovery, vol. 3, pp. 231–240, 2011. [31] M. Ester, H.-P. Kriegel, J. Sander, and X. Xu, “A density-based algorithm for discovering clusters in large spatial databases with noise,” in Proceedings of the 2nd International Conference on Knowledge Discovery and Data Mining (KDD ’96), pp. 226–231, AAAI Press, 1996. [32] M. Gori, A. Pucci, V. Roma, and I. Siena, “Itemrank: a randomwalk based scoring algorithm for recommender engines,” in Proceedings of the 20th International Joint Conference on Artificial Intelligence (IJCAI ’07), pp. 778–781, Hyderabad, India, 2007. [33] B. Mehta and W. Nejdl, “Attack resistant collaborative filtering,” in Proceedings of the 31st Annual International ACM SIGIR Conference on Research and Development in Information Retrieval (ACM SIGIR ’08), pp. 75–82, New York, NY, USA, July 2008. [34] N. J. Hurley, “Tutorial on robustness of recommender systems,” in Proceedings of the 5th ACM Conference on Recommender Systems (RecSys ’11), pp. 9–10, October 2011.
Advances in
Operations Research Hindawi Publishing Corporation http://www.hindawi.com
Volume 2014
Advances in
Decision Sciences Hindawi Publishing Corporation http://www.hindawi.com
Volume 2014
Journal of
Applied Mathematics
Algebra
Hindawi Publishing Corporation http://www.hindawi.com
Hindawi Publishing Corporation http://www.hindawi.com
Volume 2014
Journal of
Probability and Statistics Volume 2014
The Scientific World Journal Hindawi Publishing Corporation http://www.hindawi.com
Hindawi Publishing Corporation http://www.hindawi.com
Volume 2014
International Journal of
Differential Equations Hindawi Publishing Corporation http://www.hindawi.com
Volume 2014
Volume 2014
Submit your manuscripts at http://www.hindawi.com International Journal of
Advances in
Combinatorics Hindawi Publishing Corporation http://www.hindawi.com
Mathematical Physics Hindawi Publishing Corporation http://www.hindawi.com
Volume 2014
Journal of
Complex Analysis Hindawi Publishing Corporation http://www.hindawi.com
Volume 2014
International Journal of Mathematics and Mathematical Sciences
Mathematical Problems in Engineering
Journal of
Mathematics Hindawi Publishing Corporation http://www.hindawi.com
Volume 2014
Hindawi Publishing Corporation http://www.hindawi.com
Volume 2014
Volume 2014
Hindawi Publishing Corporation http://www.hindawi.com
Volume 2014
Discrete Mathematics
Journal of
Volume 2014
Hindawi Publishing Corporation http://www.hindawi.com
Discrete Dynamics in Nature and Society
Journal of
Function Spaces Hindawi Publishing Corporation http://www.hindawi.com
Abstract and Applied Analysis
Volume 2014
Hindawi Publishing Corporation http://www.hindawi.com
Volume 2014
Hindawi Publishing Corporation http://www.hindawi.com
Volume 2014
International Journal of
Journal of
Stochastic Analysis
Optimization
Hindawi Publishing Corporation http://www.hindawi.com
Hindawi Publishing Corporation http://www.hindawi.com
Volume 2014
Volume 2014