Goswami Barooah. Space and Culture, India 2014, 2:1
RESEARCH ARTICLE
Page | 24
OPEN ACCESS
Spatial Pattern and Variation in Literacy among the Scheduled Castes Population in the Brahmaputra Valley, Assam Dr Momita Goswami Barooah† Abstract Scheduled Caste (SC) population constitutes a sizeable portion of the total population of Assam accounting for 6.32 per cent according to the 2011 Census. They comprise a socially backward class in the Indian society—downtrodden illiterate people of the Indian social fabric. Literacy and educational attainment are considered the hallmark of a modern society. The traits of the modern society, such as, industrialisation, modernisation and urbanisation are closely associated with the level of literacy and education. In the middle part of the 20th century, the literacy rate among them was very low. However, in the later part of the 20th century and in the current millennium due to the developmental measures implemented by both the Central as well as State Governments of India and due to the influence of mass media, there has been a change in the pattern of literacy. The literacy rate of the SC population in the Brahmaputra Valley, Assam was 66.34 per cent in 2011 against 61.15 per cent for general population, which is slightly lower than the SC population in the Valley. The study of the pattern of literacy among various social groups of SCs in the study area provides an insight into the socio-economic situations. An attempt has been made in this paper to analyse the spatial pattern of literacy and its variations among the scheduled caste population in the Brahmaputra Valley, Assam. Key words: Literacy, Inductive Method, Scheduled Caste, Educational Attainment, Brahmaputra Valley, Assam
†
Department of Geography, Gauhati University, Guwahati, Email:
[email protected] ©2014 Goswami Barooah. This is an Open Access article distributed under the terms of the Creative Commons Attribution License (http://creativecommons.org/licenses/by/2.0), which permits unrestricted use, distribution, and reproduction in any medium, provided the original work is properly cited.
Goswami Barooah. Space and Culture, India 2014, 2:1
Introduction The pattern of literacy and education of the Scheduled Castes (SCs) population is at the heart of understanding of this research. Literacy and educational attainment level are considered as significant factors influencing the socio-economic development of any society. The quality of human society can be judged through educational attainment level. In the said context, Assam, located in the North Eastern region of India is lagging far behind in literacy and education and so is the case of the Brahmaputra valley of the state. I begin this paper with a brief background. Background The SCs are a native and aboriginal group of people, who in the wake of Aryan colonisation of India came into close contact with the sociocultural habits of the Aryans and subsequently adopted the Hindu social norms, which are divided as the Brahmins, Kshatriyas, Vaishyas, and Sudras. In ancient times, the privileged class formed by the Aryans acquired social power in the society and considered the smaller group of population as subordinates to them. This group known as the Sudras conform to the lowest stratum of the caste hierarchy of the Hindus. The Sudras have suffered various socio-economic and political discriminations in society; some of them were even called as untouchables (see, Baruah, 2014) and referred to as depressed classes until 1935. Afterwards the term ‘Scheduled Castes’ was applied to them in the Government of India Act 1935. According to the Sixth Schedule of the Indian Constitution, SCs are regarded as the weakest sections of the India and therefore, a backward class of the society (Baruah, 2014; Bhattacharyya, 2009; 2013). In the past, they were downtrodden illiterate people of the Indian social fabric. Even in the middle part of the 20th century, the literacy rate among them was very low. However, in the later part of the 20th century and in the current millennium due to the developmental measures implemented by both the Central as well as the state governments of India and due to the influence
Page | 25
of mass media, there has been a change in the pattern of literacy among the SCs. The Constitution of India in its Article 45 of the Directive Principle urges the State to provide free and compulsory education for all the children, until they attain 14 years of age. In this direction, the National Policy on Education, 1968 was a milestone, which stressed the need for vigorous efforts for the early fulfilment of this aim. The amendment of the Constitution in 1976 included education in the concurrent list and, subsequently, the revised National Policy of Education, 1986, 1992 again reemphasised on the universal access and enrollment of the children up to 14 years of age and a substantial improvement in the quality of education to enable all children access to essential levels of learning based on Common Minimum programme of the United Progressive Alliance (UPA) Government and Programme of Action (PoA), 1992 under the National Policy on Education (NPE), 1986. This followed the launching of the flagship programme, the Sarva Shiksha Abhiyan (SSA) mandated by the 86th Amendment to the Constitution of India for achievement of Universalisation of Elementary Education (UEE), making free and compulsory education to the children aged 6-14 years, a fundamental right. Finally, on 4 August 2009, the Parliament of India under the Article 21a of the Constitution of India passed the legislation of Compulsory Education Act or Right to Education Act (RTE) that came into force on 1 April 2010. The influences of these policies/acts obviously resulted in improvement in the literacy rates and the level of education among the general population as a whole and the SCs in particular. According to the 2011 Census, in the Brahmaputra valley, Assam, 66.34 percent of SCs (excluding 0-6 year’s age group) are literates. The male literacy rate is comparatively higher than the corresponding female literacy rate observed among the SCs in the Brahmaputra valley. It is observed from the research analysis that the literacy rate is comparatively higher in case of SCs than the overall general literacy rate of the Valley (Table 1). This situation is mainly due to the presence of a large population of general Muslims in the
Goswami Barooah. Space and Culture, India 2014, 2:1
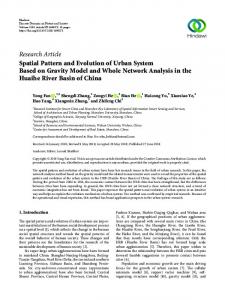
study area, with the majority of them being illiterates. Study Area The Brahmaputra valley lies between 25045’ N and 270 56’N latitudes and 890 42’ E and 960 0’E longitude (Figure 1). The valley is a distinct physiographic unit of the North Eastern region of India. The study areas lie within the present state of Assam, consisted of 18 districts in 2001 and now 21 districts in 2011. The Valley is an alluvial plain covering an area of 56194 sq.km representing 72% of the total area of Assam. Data Base and Methodology The study is based partially on secondary data, which are taken from the different census of India, volumes and other relevant Government publications of the Directorate of Economics and Statistics for the period 1991 to 2011. Data pertaining to educational attainment level have been collected through a questionnaire survey in 2010. For other base materials, relevant
Page | 26
literature and various reports have been consulted. Methods adopted in the present analysis are simple percentage and Sopher’s disparity index (Sopher, 1974). Sopher’s Disparity index has been deployed to probe the sex disparity in literacy. This method, developed by David V. Sopher (1974), is used to examine the relative disparity between two groups (in this case, I measure the sex disparity in literacy trend of the SC population in the Brahmaputra Valley and Assam, 1961-2011 (Table 1). This method is deployed when the value of the variables are given in terms of percentages. If X1 and X2 indicates the respective percentage of value of variables of group 1 and 2, the disparity index (D) is: D = Log(X2/X1) +Log [(Q-X1) / (Q-X2)] Where, X2≥X1 (that X2 should have higher value than X1) and Q=100. In case of no disparity, that is, perfect equality, the value of D will be 0. However, with the increasing value of D, the disparity will increase.
Figure 1: Location Map of the Brahmaputra Valley
Goswami Barooah. Space and Culture, India 2014, 2:1
Page | 27
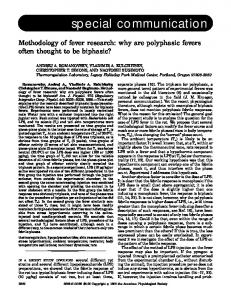
Spatial Pattern of Literacy It is observed from Table 1 that the trend of literacy rate as a whole among the SCs is not encouraging during the period 1961-2011. When both the male and female literacy rates among the SCs are considered, it is observed from the field study that the female literacy rates are far below than the male literacy, albeit the sex disparity is gradually decreasing during the period 1961-2011 (Table 1)—the disparity decreased from 0.47 in 1961 in the Valley to 0.23 in 2011. Notwithstanding, the low level of literacy among the females can be explained due to low status of women and negligence of female education in the SC society. The parents of the poor families generally have given more importance to the male child in case of education, while the
female child generally helps them in the domestic work (Bhattacharyya et al., 2010; 2011; Bhattacharyya and Vauquline, 2013). Figure 2 highlights the trend of literacy among the SCs in the Brahmaputra Valley. The literacy rates also vary in different districts of the Brahmaputra Valley. According to the 2011 Census, the highest percentage share of SC literates is found in the Sivasagar district with 76.98 per cent while the lowest is recorded in Chirang district with only 54.78 per cent. The spatial variation of literacy pattern in the Valley is presented in the Table 2 for clear understanding of the situation. Table 2 reveals that the literacy rates among the SCs in the Upper Brahmaputra Valley are higher when compared to the Lower Brahmaputra Valley.
Table 1: Literacy Trend of the Scheduled Castes Population in the Brahmaputra Valley and Assam, 1961-2011 (in percentages) Year Brahmaputra Valley Assam Person
Male
Female
Person
Male
Female
12.53
Sex Disparity 0.4705
24.55
31.75
16.09
Sex Disparity 0.38490
1961
21.73
29.74
1971
24.86
34.80
13.94
0.5179
25.29
35.00
15.74
0.45977
1991
42.93
51.64
33.45
0.3273
42.46
51.62
34.30
0.31042
2001
56.29
64.70
47.62
0.3045
56.09
63.95
47.90
0.2854
2011
66.34
72.25
60.11
0.237
66.75
72.20
61.01
0.220
Source: Calculated on the basis of Census Data, Primary Census abstract 2011, Primary Census Abstract part II-B (1991) - 1971 part (II) Social and cultural tables.1961-Volume III Part II C. Notes: 1981 Census was not conducted in Assam. 1991-1991 data on population figure include age 0-6 year’s age groups. Sex disparity is calculated using Sopher Disparity Index The lowest level of literacy among SC population is also found in the Dhemaji district in upper Assam, which is an exception mainly due to the ecological setting of the area coupled with poverty and lack of adequate educational facilities in the district. Moreover,
almost all parts of the district are chronically flood-affected and the educational institutions are in a dilapidated condition. Hence, all other social groups also have lower literacy level in this part of the study area. It is mentioned earlier that among the districts of Assam, the
Goswami Barooah. Space and Culture, India 2014, 2:1
Page | 28
literacy rates among the males are higher when compared to the female literacy rates. It is primarily because of the fact that the upper part of the Valley except the Dhemaji district is socio-economically advanced when compared to the lower part of the Valley. However, the Kamrup district with Guwahati city in the Lower Brahmaputra Valley is an exception. It is important to note that since the Ahom rule (13th century), people in the Upper Brahmaputra Valley have been aware of the society, social life and living standards. Moreover, most of the areas in this part are accessible with high connectivity. Even during the British regime, with the growth of oil and tea industries, this part of the study area (Upper Brahmaputra Valley) was, to some extent, economically advanced.
Literacy Rate among Different SC Groups in the Brahmaputra Valley The Government of India recognised 16 SCs in Assam as well in the Brahmaputra Valley as per Scheduled Castes/Scheduled Tribes modification order 1956(1). Out of them, the seven groups: Mali, Bania, Hira, Jal-keot, JhaloMalo, Kaibartta and Mahara are indigenous to the Valley, while the other seven groups namely Namasudra, Sutradhar, Dhubi, Lalbegi, Bansphor, Mehtar and Mushi are immigrants from the East Bengal and Bihar. The other groups Dholi-Dugla and Patni are partly indigenous and partly immigrant in origin. Most of the immigrants SCs, except the Namasudras and Sutradhars, have settled in the urban areas. The pattern of literacy among the various social groups of SCs in the study area provides an insight into the socio-economic situation. Interestingly, there exist significant disparities in the literacy rate among various groups of SCs.
80 70 60 50 PERSON 40
MALE FEMALE
30 20 10 0 1961
1971
1991
2001
2011
Figure 2 Literacy Trend of Scheduled Castes population in the Brahmaputra Valley, Assam Source: Calculated on the basis of Census Data 1961-2011
Goswami Barooah. Space and Culture, India 2014, 2:1
Page | 29
Table 2: Literacy Rate among the SC Population in Different Districts of the Brahmaputra Valley, 2011 Literacy in Percentage Districts/Valley Person Male Female 1.Kokrajhar 2.Dhubri 3.Goalpara 4.Barpeta 5.Morigaon 6.Nagaon 7.Sonitpur 8.Lakhimpur 9.Dhemaji 10.Tinsukia 11.Dibrugarh 12.Sibsagar 13.Jorhat 14.Golaghat 15.Bongaigaon 16.Chirang 17.Kamrup 18.Nalbari 19.Baksa 20.Darrang 21.Udalguri Brahmaputra Valley Assam Source: Census of India 2011, Assam
64.15 60.29 63.66 62.95 61.86 70.82 67.64 68.70 56.86 69.89 72.53 76.98 73.86 68.89 61.39 54.78 69.02 69.09 57.69 61.24 60.35 66.34 66.75
70.97 67.31 69.49 69.64 67.24 75.62 73.13 74.84 63.40 75.55 77.74 80.69 79.45 74.74 68.15 62.05 75.45 75.49 65.09 67.56 67.71. 72.25 72.20
Female Literacy
Male Literacy
Table 3: Literacy pattern among SCs in the Brahmaputra Valley 2011 (in percentage) Highest Total 80.69 Sivasagar 80.40 Rural Sivasagar 82.49 Urban Kamrup 73.12 Total Sivasagar 72.61 Rural Sivasagar Urban
75.43 Sivasagar
Source: Calculated from Census of India 2011 data, Assam
56.76 52.80 57.60 55.82 56.25 65.80 61.89 62.32 49.76 63.87 66.92 73.12 68.05 62.79 54.28 47.07 62.25 62.45 49.88 54.64 52.61 60.11 61.01
Lowest 62.05 Chirang 60.11 Chirang 65.50 Baksa 47.01 Chirang 44.67 Chirang 49.62 Baksa
Goswami Barooah. Space and Culture, India 2014, 2:1
Table 4: Literacy Rate among Different Groups of SC Population, Brahmaputra Valley Groups Percentage of Literates Person Male Female 1.Bansphor 51.46 66.67 36.54 2.Bhuinmali 52.77 61.68 39.73 3.Bania 53.85 63.64 41.18 4.Dhobi 61.19 61.70 60.00 5.Hira 51.92 59.26 44.00 6.Jhalo-Malo 58.3 62.5 50.00 7.Jalkeot 61.70 66.66 52.94 8.Kaibartta 66.79 69.87 62.50 9.Mehtar 57.14 64.14 64.70 10.Muchi 44.82 50.00 36.36 11.Namasudra 53.01 66.94 39.84 12.Sutradhar 48.90 65.38 27.11 Brahmaputra 56.16 65.25 44.58 Valley Source: Field Survey 2010 In order to study the present condition, as stated above, the field survey was conducted in 2010 in different areas of the Brahmaputra Valley. In this study, only 12 major groups of the Valley having more than one per cent of the total SC population were considered. It is observed that the total literacy rate among them is 56.29 per cent, of which male literacy is 64.70 per cent and while female literacy is 47.62 per cent. Among the 12 major groups in the Valley, Kaibartta group records the highest literacy rate with 66.79 per cent literates. Interestingly, the Kaibartta group has also the highest number of population in the valley. The second position is occupied by Jal-keot whose literary rate is 61.9 per cent followed by Dhobi 61.19 per cent. Kaibartta and Jal-keot are indigenous and they live in both rural and urban areas of the Valley while Dhubi group is immigrant and the people of this group are urban dwellers. The other SCs have more or less the same literacy rates. Muchi, who are mostly urban dwellers, records the lowest literacy rate (44.82 per cent) among the groups. So far, the malefemale literacy patterns are concerned, the male literacy rate is comparatively higher than the female literacy rate. As stated earlier, Table 3 illustrates that according to the Census data
Page | 30
of 2011, the total male and female literacy among the SCs is highest in the Sivasagar district, while it is lowest in the Chirang district of Assam—the urban male literacy is highest in the Kamrup district but the urban female literacy among the SCs remain highest in the Sivasagar district. It is further observed that among the groups, the male literacy rate is highest among the Kaibartta group (69.78 per cent) followed by Namasudra (66.94 per cent). On the other hand, the female literacy rate is also highest among the Kaibartta group (62.50 per cent) followed by Dhobi (60 per cent). It is interesting to note that the female literacy rates vary from minimum 27.11 per cent to maximum 62.50 per cent, indicating high disparity among various groups, which, however depends on the status of women in the society. The above analysis clearly sheds light on the fact that though efforts have been made by the Central and the state governments to educate the people, literacy pattern is very discouraging among the SCs in the Valley. Educational Level The educational level of a region is better understood, when the level of educational attainment is taken into account. In Table 5, I present the data on educational level of the SC population based on my field study in 2010. It has been observed from Table 5 that 37.7 per cent of the total population are below the primary level. 29.68 per cent of the population have studied above the primary level up to Class X. 22.66 per cent are between the range of H.S.L.C passed up to below graduate level, while the percentage of graduate and technical persons is only 10.09 per cent. It is observed in the field study that there are large-scale school dropouts during and after the primary stage of education among this section. These dropouts include both males and females, which is primarily due to financial hardships. The study of male-female educational level shows that the percentage share of female below primary level of education is 40.17 per cent, which is higher than the male literates (36.18 per cent) are. Unlike the primary, from
Goswami Barooah. Space and Culture, India 2014, 2:1
above primary up to Class X, the female literacy rate is 30.96 per cent, which is higher than the male counterpart of 28.99 per cent. In the next group, above HSLC but below graduates’ stage, the level of education is comparatively higher (26.37 per cent) than that of the level of female education (21.33 per cent). In the higher level, that is, in the graduate and technical level, the level of education is comparatively higher in the case of males (11.46 per cent) than that of the females (7.53 per cent). This is mainly because girls are married off at an early age before the completion of their studies, as there is no social commitment about the continuation of their study after marriage. The comparison of the Tables 1, 2, 3, and 4 reveals that there has been slight improvement in the literacy rates among the SCs during 19912011. Apart from social awakening, the facilities provided by the Government for socioeconomic upliftment of the SCs have led to this slight rise of literacy among them in the Valley. It is mentioned earlier that the indigenous SCs are distributed in both rural and urban areas. Table 5: Educational Level of SC Population in the Brahmaputra Valley Percentage Share of Educational Level Literates Total Male Female Below Primary 37.57 36.18 40.17 (I to IV) Above Primary up to 29.68 28.99 0.96 Matric (V to X) Above Matric (HSLC) 22.66 23.37 21.33 below Graduate Graduate and 10.09 11.46 7.54 Technical Illiterates 43.84 34.75 55.41 Literates(all) 56.16 65.25 44.58 Source: Field Survey 2010 Due to the impact of urbanisation, the indigenous SCs who settled in the urban areas have higher literacy rate when compared to the indigenous SCs living in the rural areas. It is further observed that the prevailing poor economic conditions among the SCs coupled with inaccessible conditions in the areas they
Page | 31
lived are largely responsible for the low level of literacy among them. The recent development of transport and communication has however added a new dimension to the process of propagation of literacy and education in the remote areas. There has also been outmigration of the SCs from rural to urban areas to gain higher education or employment, which is particularly male selective, resulting in an increase of male literacy. Discussion and Conclusion The SC population is mainly distributed in the rural areas of the Brahmaputra Valley. The rural literacy rate in the Valley is 64.82 per cent while the urban literacy is 74.02 per cent. Low literacy among SCs has been the result of several factors—first, they are mostly engaged in traditional occupations as labourers in agriculture and household industries. Second, low societal status has deprived them of education. Third, extreme poverty compels all family members to work. Even their children, instead of attending schools, seek some labours/jobs. During the period 1971-2011 there has been significant development in the literacy pattern among the SCs in the Valley. The prevalence of rural-urban difference in case of literacy is primarily due to the availability of educational facilities and consciousness among the people in the urban areas. In the rural areas, the educational institutions located in the riverbanks are submerged under water during four months of summer due to torrential rains and floods. As most of the SCs live below the poverty lines, therefore, they cannot afford to go to other place to receive education, resulting in an overall low literacy rate. Besides, lack of progressive outlook and under-privileged conditions for centuries fail to motivate them towards receiving education. All these factors have caused low literacy among the SCs. Since Independence, the Government is making serious efforts to promote literacy among the SCs by providing free education, awarding scholarships and granting loans. In spite of all these privileges, their literacy has not improved satisfactorily. Therefore, it may be concluded
Goswami Barooah. Space and Culture, India 2014, 2:1
that increase of literacy and educational attainment level, particularly in case of the females, remain vital towards the socioeconomic development of the SC population. References Baruah, A. (2014). The Prohibition of Employment as Manual Scavengers and their Rehabilitation Act, 2013: A Review, Journal Space and Culture, India, 1 (3), 9-16 Bhattacharyya, R. and Vauquline, P. (2013). A Mirage or a Rural Life Line?: Analysing the Impact of Mahatma Gandhi Rural Employment Guarantee Act on Women Beneficiaries of Assam, Journal Space and Culture, India, 1(1), 83-101, ISSN: 2052-8396 Bhattacharyya, R. (2013). Are We Empowered? Stories of Young Indian Working Women, Saarbrücken, Germany: Lap Lambert Academic Publishing, ISBN: 978-3-659-20580-4 Bhattacharyya, R., Vauquline, P. and Singh, S. (2011). Towards a Socially Sustainable India: An Analysis of National Rural Employment Guarantee Scheme, 2006. In S.K. Singh, Raj Kumar, H.P. Mathur, N.B. Singh and V.K. Kumra (eds). Energy Resources, Alternative Search and Sustainable Development, New Delhi: Shree Publishers, 73-88, ISBN: 978-81-8329-395-2 Bhattacharyya, R., Vauquline, P. and Singh, S. (2010). Towards a Socially Sustainable India: An Analysis of National Rural Employment Guarantee Scheme, 2006. Conference Proceedings, Strategic Management of Energy, Environment and Disaster for Sustainable Development organised by Global Strategic Management Inc, Saxon Drive, Beverly Hills, Michigan, USA in collaboration with Banaras Hindu University, Varanasi, India, 2010, Vol.1, 62-74 Bhattacharyya, R. (2009). Examining the Changing Status and Role of Middle Class Assamese women: Lessons from the Lives of University Students, PhD Thesis, Newcastle University, UK Gosal, G.S. (1979). Spatial Perspective on Literacy in India, Population Geography, 1, 4167
Page | 32
Goswami.M. and L. Datta (2003). Socioeconomic Well-being of Scheduled Castes Population of Assam. Practising Geographer, Journal of Indian Geographical Foundation, 10, 148-15 Kar, B.K. (2002). Women Population of North East India: A Study in Gender Geography, Regency Publication: New Delhi Pant, B.R. (1997). Social Well-being of Scheduled Castes Population in the Uttarakhand Region of India, National Geographer, XXXII (1). 57-71 Sengupta Piyali and Jaba Guha (2001). Enrolment Dropout and Grade Completion of Girl Children in West Bengal, Economic and Political Weekly, 37(17), 21-37 Sharma Thakur G.C (1994). Socio-cultural Dynamics of Scheduled Castes Development. Bulletin, I (IX), Department of Welfare of Plains Tribes and Backward Classes, Government of Assam Sharma. H. N. (1992). Social Profile of North East India: Spatial Pattern of Literacy and Educational levels. In A. Ahmed (ed.), Social Structure and Regional Development: A Social Geography Perspective, Rawat Publications: Jaipur, 219-238 Shrinivas, M.N (1962). Castes in Modern India and Other Essays, Asia Publishing House: Bombay Singh, N. (1998). Female Literacy in India: The Emerging Trends, Population Geography, 20(182), 23-36 Sopher D. E. (1974). Measure of Disparity, Professional Geographer, 26(4), 389-392 Taher, M. (1979). Scheduled Castes Population in Assam: A Spatial Analysis, North Eastern Geographer, XI (1&2)