Hindawi Publishing Corporation International Journal of Distributed Sensor Networks Volume 2013, Article ID 150703, 13 pages http://dx.doi.org/10.1155/2013/150703
Research Article Successful Deployment of a Wireless Sensor Network for Precision Agriculture in Malawi Million Mafuta,1,2 Marco Zennaro,3 Antoine Bagula,4 Graham Ault,1 Harry Gombachika,2 and Timothy Chadza2 1
Electronic and Electrical Engineering Department, University of Strathclyde, Royal College Building, 204 GEORGE ST GLASGOW G1 1XW, Glasgow, UK 2 Electrical Engineering Department, University of Malawi-The Polytechnic, Chichiri, Blantyre, Malawi 3 T/ICT4D Laboratory, The Abdus Salam International Centre for Theoretical Physics, Strada Costiera, 11-34151, Trieste, Italy 4 ISAT Laboratory, University of Cape Town, 18 University Avenue, Rhodes Gift. 7707, Cape Town, South Africa Correspondence should be addressed to Million Mafuta;
[email protected] Received 3 February 2013; Revised 19 April 2013; Accepted 22 April 2013 Academic Editor: Danny Hughes Copyright © 2013 Million Mafuta et al. This is an open access article distributed under the Creative Commons Attribution License, which permits unrestricted use, distribution, and reproduction in any medium, provided the original work is properly cited. This paper demonstrates how an irrigation management system (IMS) can practically be implemented by deploying a wireless sensor network (WSN). Specifically, the paper describes that an IMS which was set up in Manja township, city of Blantyre. Deployment of IMS in rural areas of developing countries like Malawi is a challenge as grid power is scarce. For the system to be self-sustained in terms of power, the study used solar photovoltaic and rechargeable batteries to power all electrical devices. The system incorporated a remote monitoring mechanism through a General Packet Radio Service modem to report soil temperature, soil moisture, WSN link performance, and photovoltaic power levels. Irrigation valves were activated to water the field. Preliminary results in this study have revealed a number of engineering weaknesses of deploying such a system. Nevertheless, the paper has highlighted areas of improvement to develop a robust, fully automated, solar-powered, and low-cost IMS to suit the socioeconomic conditions of small scale farmers in developing countries.
1. Introduction In precision agriculture (PA), various parameters including soil type and temperature vary dramatically from one region to the other; consequently, any irrigation system must be flexible to adapt to such variations. Off-the-shelf irrigation controllers are usually expensive and not effective in managing scarce water resources [1, 2]. On the other hand, an irrigation management system (IMS) based on wireless sensor networks (WSNs) can accept any desired irrigation scheduling strategy to meet specific environmental requirements. However, WSNs are still under a developmental stage; as such, they are at times unreliable, fragile, and power hungry and can easily lose communication especially when deployed in a harsh environment like an agricultural field [2]. Unlike laboratory-based simulations and experimental installations, practical deployments have to handle such challenges to be fully beneficial. WSNs have an immense
potential to PA, such that, if well designed, can be a solution to a low-cost IMS suitable for developing countries. The increase in WSN deployment in industrial, agricultural, and environmental monitoring applications is as a result of being a low power and low data rate hence energy efficient technology. It also offers mobility and flexibility in connectivity which promote network expansion when needed. Recently, there have been few publications on the application of WSNs to PA. Keshtgary and Deljoo [3] discussed the simulation of WSN for agriculture using OPNET simulation tools in which random and grid topologies were compared. They evaluated the performance of the networks by monitoring delay, throughput, and load. This approach, however, lacks practical aspects where some simulation assumptions are invalid. Zhou and others [4] presented a WSN deployment for an irrigation system using ZigBee protocol. This study did not monitor the performance of
2 communication links between sensor nodes which is vital in practical deployments as it impacts battery performance. Despite having a detailed design for the powering side, they did not monitor battery levels for the sensor nodes. This paper revisits the problem of the field readiness of WSNs when deployed in PA to assist small scale farmers in the rural areas of developing countries. The main contribution of this paper is the design, implementation, and performance enhancement of a low-cost but efficient IMS that combines sensors and actuators in a wireless sensor/actuator network. This approach could guide the successful deployment of WSN for PA. The remainder of the paper is organized as follows: Section 2 presents the design of the wireless sensor network for precision agriculture in Malawi (WiPAM); Section 3 presents the performance evaluation of the underlying WSN development; Section 4 discusses challenges and experiences acquired from the WSN practical deployment; finally, conclusion and future work are presented in Section 5.
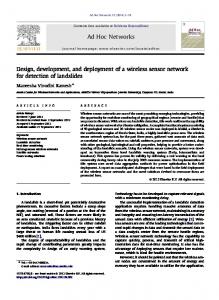
2. The WiPAM Design The ultimate purpose of the WiPAM system was to automate irrigation process. Specifically, the study examined the fluctuations in soil moisture in an agricultural field. Such fluctuations were then used by the irrigation controller to initiate irrigation events. In order for the controller to precisely determine when to irrigate, sensor data were automatically gathered at intervals of 30 minutes. However, in order to avoid over irrigation due to late termination of an irrigation event, the sampling interval was reduced from 30 minutes to 2 minutes when the irrigation was in progress. The general workflow of the system consists of (1) taking soil moisture and temperature samples at predefined time intervals, (2) sending and storing sampled data in a coordinator node, (3) sending the data from the coordinator to a gateway node for forwarding to a remote monitoring station (RMS) through a cellular network, (4) going to sleep, and (5) waking up and repeating the previous steps. Depending on the values stored in the coordinator node, the irrigation valves have to be opened or closed. In order to realise these functional requirements, the WiPAM was divided into two sections: irrigation station (IS) and RMS which were linked via a cellular network as shown in Figure 1. The RMS was used to capture performance parameters of the IS at a remote site. The parameters included soil moisture level, soil temperature, battery voltage levels of sensor nodes, quality of wireless links, and valve status. The idea was to get timely information without visiting the site physically, consequently, saving time and money. Section 2.1 discusses the architecture and components of the IS; thereafter, Section 2.2 describes the RMS design. 2.1. Irrigation Station. The workflow of the IS can be mapped into a five-component system architecture depicted by Figure 2 which includes soil moisture sensor, sensor node, coordinator node, gateway node, and irrigation system. Section 2.1.1 discusses the WSN protocol and topology used,
International Journal of Distributed Sensor Networks
Cellular network
Physical parameters and system fault alarms are captured
Computer Mobile phone Personnel
Remote monitoring station
Irrigation system - Pipes - Valves Controller - Powering system - WSN nodes - Gateway node
Irrigation station
Figure 1: The Architecture of the irrigation management system.
after which the single components of the IS are described in Sections 2.1.2 through 2.1.6. 2.1.1. WSN Protocol and Topology. The WSN deployed in this study used ZigBee, an IEEE 802.15.4 networking standard for personal area networks. The physical layer of ZigBee operates in the unlicensed industrial, scientific, and medical radio bands of 868 MHz, 915 MHz, and 2.4 GHz depending on the region. This study adopted the 2.4 GHz band because it is unlicensed in Malawi. The ZigBee protocol mainly focuses on low-cost and low power consumption. The low power consumption characteristic is really appealing since sensors are usually placed at a remote location where battery power supply is the only option and needs to be sustained. In order to attain a low power consumption characteristic, the ZigBee protocol operates at low data rates (250 kbps at 2.4 GHz). Nonetheless, this imposes its limitation where high data transmission applications are required. Such applications may use other IEEE standards, for instance, Bluetooth (802.15.1) and Wi-Fi (802.11) which offer high data rates of 1 Mbps and 54 Mbps, respectively, but at the expense of battery power. Nevertheless, in PA, sensor data do not require wide bandwidth since it is not necessary to continuously monitor soil moisture and temperature as there could be no significant changes in these parameters in a short period. Hence, ZigBee is well suited for PA in remote areas where high battery performance may be required. Depending on the situation and environment, ZigBee networks can take three forms of topologies: star; cluster tree, and mesh. A star topology comprises one ZigBee coordinator (ZC) and several other ZigBee end devices (ZEDs). No ZigBee router (ZR) is required in this topology. The ZC communicates with all ZEDs; however, there is no direct messaging between ZEDs (refer to Figure 3). On the other hand, a cluster-tree topology is made up of one ZC and several child nodes which are ZRs and ZEDs [5]. Apart from communicating with its parent node, the ZR may as well have its own child nodes, but there is only one path between any pair of devices in this network. A mesh
International Journal of Distributed Sensor Networks
3
5 Cellular network
Sensor node and gateway
RMS
Irrigation controller
1
2
3
Sensor node
Coordinator node
4
Soil moisture sensor
1
Irrigation system (valves, pipes, water source, etc.)
Soil moisture sensor
Figure 2: The architecture of the irrigation station.
ZED
ZED
ZED
ZED
ZC
ZED ZigBee end device (in-field node) ZED
ZigBee end device (in-field node and gateway)
ZC
ZigBee coordinator (actuator/controller node)
Figure 3: Star network topology deployed in this study.
network is accomplished by allowing devices in the clustertree to topology communicate with each other using multiple routes. Consequently, the devices are able to send and receive messages reliably even when their preferred path is down or congested. This is the major advantage of a ZigBee mesh network over star and cluster-tree networks. However, a mesh network has no guarantee of bandwidth since no synchronisation is used which requires disabling of beacon mode.
Since the network for this study was small, comprising five devices placed within short distances (7 m), a star topology was chosen (refer to Figure 3). In this topology, three in-field sensor nodes and the gateway node were configured as ZEDs, whereas one node was configured as ZC. The ZC node was used to aggregate data and actuate irrigation valves accordingly. With this topology, there is a considerable potential of battery power saving since all ZEDs spend most of their time asleep, only waking up to make measurements and send the data to the ZC. Otherwise, as the case with cluster tree and mesh, ZRs need to be awake since they provide paths for other devices to the ZC thereby wasting battery power in the process. 2.1.2. The Soil Moisture Sensor. The soil moisture sensor is one of the most important components upon which the efficiency of the irrigation activity heavily relies. The suitability of a soil moisture sensing device depends on the cost, reliability, ease of interfacing to a signal processing device, accuracy, and soil texture. Although it is not possible to single out a sensor that satisfies all of the above selection criteria, the Watermark 200SS (Irrometer Company, Inc., Riverside, CA, USA) was opted for. This sensor scores highly on low-cost, and durability, maintenance-free operation and suitability for soil texture variability since it has a wide measuring range (0 to −239 kPa) [6]. The fact that this sensor monitors water potential makes it superior to other water content-based sensors; knowledge of soil water content is not as important as knowing the level of tension crop roots must exert to extract water. The measurement of the soil moisture potential (SMP) using Watermark 200SS sensor is done in two stages: (1) reading the frequency of the alternating current signal pushed
4
International Journal of Distributed Sensor Networks
into the sensor which is then converted to resistance and (2) using a nonlinear calibration equation to convert the Watermark electrical resistance (in kΩ) into SMP (in kPa). Using an Agriculture Board as an interface of the Watermark sensor and a Waspmote microcontroller unit (MCU), it was possible to measure the frequency directly. The following equation developed by the manufacturer of the Agriculture Board [7] was then used to convert the measured frequency to resistance: 150390 − 8.19𝑓 kΩ, 𝑅= 1000 (0.021𝑓 − 1)
4.093 + 3.213𝑅 kPa, 1 − 0.009733𝑅 − 0.01205𝑇
PVC pipe
Figure 4: Soil moisture sensor (Watermark) attached to a PVC pipe.
(1)
where 𝑓 is the measured frequency expressed in Hz. There are numerous calibration equations in the literature [8–10] that permit conversion of the Watermark resistance to SMP. However, this study used the equation developed by Shock and others [8] because it is used in many Watermark digital meters and data loggers [11, 12]. Moreover, the manufacturer of the Watermark 200SS sensor uses this equation as a default calibration [10]. The equation is expressed as follows: SMP = −
Watermark sensor
(2)
where 𝑅 is the sensor resistance (kΩ) and 𝑇 is the soil temperature (∘ C) measured within the vicinity of moisture sensor. Soil temperature was measured with the help of a TP1000 sensor (Omega Engineering Ltd.). Sensor positioning in the root zone of the plant is crucial, because it determines the amount of water to be applied during each irrigation event. A sensor placed very deep into the soil allows the irrigation system to apply more water up to that depth beyond plant roots; the water below plant roots is lost through deep percolation. On the other hand, a very shallow sensor promotes light irrigation, consequently, failing to apply water into the root zone and therefore stressing the plants. Maize is a deep-rooted crop with approximate maximum rooting depth ranging from 75 cm to 120 cm [13] depending on the characteristics of the soils like the presence of restrictive soil layers. Accordingly, the study placed the soil moisture sensors at a depth of 40 cm. At this sensor depth, about 70% of water uptake by crops takes place [14]; the effective root zone in this case is 60 cm. For ease of installation of the Watermark sensor into the soil, a 1/2 inch, class 315 psi, thin wall polyvinyl chloride (PVC) pipe was used. This gives a good snug fit of the sensor on its collar (refer to Figure 4) and allows the sensor to be pushed easily into an access hole during installation [15]. After successfully attaching sensors to the PVC pipes it was important to precondition them by following wet-dry cycles. The wet-dry process is necessary in order to remove air from sensors [15] which, consequently, improves the response of sensors during the first few irrigation events. Three wet-dry cycles were conducted before installing sensors. Specifically, sensors were soaked in irrigation water for 1 hour then air dried for 24 hours. In addition, sensors were soaked in water for 24 hours just before installation.
2.1.3. The Sensor Node. In this study an open WSN node was used as a sensor node. The advantage of the open source model when applied to WSNs is relevant in terms of cost, personalization, and independence from a single entity as compared to proprietary solutions. In particular, the Waspmote node by Libelium was selected. Waspmotes are built around XBee transceivers which provide flexibility in terms of multiplicity of operating power, protocols, and operating frequencies. According to [16], other Waspmote characteristics include (1) minimum power consumption of the order of 0.7 mA in the hibernate mode; (2) flexible architecture allowing extra sensors to be easily installed in a modular way; (3) the provision of Global Positioning System, General Packet Radio Service (GPRS), and Secure Digital card on board; (4) the provision of a Real Time Clock. Furthermore, Waspmotes are powered with a lithium battery which can be recharged through a special socket dedicated for a solar panel; this option is quite interesting for deployments in developing countries where power supply is either scarce or unstable. This study deployed four in-field sensor nodes—two in each plot of 8 m × 7 m in size (refer to Figure 5). However, one of these nodes was assigned additional responsibilities of a gateway to relay field data to a remote station for diagnostic purposes by the management personnel. Since the moisture sensors were coupled to the sensor nodes, it was important to install the nodes at appropriate locations to take into account the variability of spatial distribution of water in the field. Towards that end, sensor nodes were positioned as shown in Figure 5. While it is prudent to place sensor nodes in the mostly dry locations of the field to avoid stressing crops in those locations, caution should also be exercised to avoid over irrigation of the other parts of the field. Consequently, based on topography, it may be necessary to divide a large field into smaller zones which can effectively be irrigated independently. In order to ease the task of establishing appropriate sensor positions and to facilitate even distribution of water in the field, the two plots were leveled independently. Figure 6 shows the architecture of an in-field sensor node (excluding that of the gateway). This node was equipped with a ZigBee module to be used for communication with a coordinator node described later in Section 2.1.4. The Agriculture Board was used as an interface between the sensors and the Waspmote sensor board. A software program was developed and uploaded into the sensor nodes to allow them to measure soil moisture, their
International Journal of Distributed Sensor Networks
5
7m
1.2 m
7m
WSN node
WSN node
Sensor
Sensor
8m
8m WSN node
WSN node Plot 1
Sensor
Plot 2
Sensor
Coordinator and actuator node WSN node
Figure 5: Location of sensor nodes in the field.
ZigBee module
Waspmote sensor board - Real time clock
Solar panel
- Microcontroller - Battery charging - Memory - Analog/digital interface
Battery
Agriculture Board
Temperature sensor
Moisture sensor
Figure 6: The architecture of an in-field sensor node.
battery levels, and soil temperature. The sampling intervals for the measurement of these parameters were 30 minutes when the system was idle and 2 minutes when irrigation was taking place. The rest of the time sensor nodes were in a deep sleep mode to conserve battery power. Once the measurements were completed, the nodes relayed the data
through the XBee transceivers to the coordinator node for processing. A 30-minute sampling interval was considered a long enough time to preserve battery power for the nodes on one hand, and a short enough time to fully monitor the soil moisture trends. In other words, as it is generally expected, increasing the sampling interval can save a substantial amount of battery power for the sensor nodes at the expense of information. However, in order to avoid over irrigation as a result of late termination of the irrigation event, the study reduced the sampling interval from 30 minutes to 2 minutes when the irrigation was in session. This permitted prompt termination of the irrigation event. 2.1.4. The Coordinator Node. This study used a Waspmote equipped with a ZigBee module as a coordinator node. This component was the heart of the whole system and had several crucial roles to perform. Firstly, as the most capable node in the network, ZC permitted and sanctioned all ZEDs that were in quest of connecting to its network. That is, it was responsible for network formation by assigning addresses to all joining nodes and ensuring security for the network. As such, there was only one ZC for the ZigBee network. Secondly, the ZC was used to receive and aggregate data from the four in-field sensor nodes discussed earlier in Section 2.1.3. The received sensor data included the Watermark frequency and the soil temperature which were used to derive SMP. The coordinator then decided on whether to
6 irrigate or not depending on the level of the SMP. Four of the input/output (I/O) pins of the Waspmote’s sensor board were connected to a latching circuit and were used to initiate or halt the irrigation by sending appropriate pulses to the pins. Thirdly, the ZC was used to relay data to a gateway node for forwarding to RMS. When receiving data from the sensor nodes the coordinator also captured the Received Signal Strength Indicator (RSSI) of every packet received. This is a measure of the quality of the link between itself and a particular in-field sensor node. The SMP, battery level, soil temperature and RSSI from all four sensor nodes together with its own battery level and system running time were aggregated and prepared suitable for Short Message Service (SMS) transmission system. Thereafter, the SMS data were relayed to the gateway for forwarding to RMS every 15 minutes when irrigation was in progress or every 30 minutes when the irrigation system was in an idle mode. Figure 7 illustrates the architecture of a coordinator and actuator node that carried out the stated functions. Finally, the ZC node was configured as a controller for the irrigation system. A software program was uploaded to allow the node to effectively schedule irrigation events based on the data received from the four in-field nodes. 2.1.5. The Irrigation System. The irrigation system had four components: latching circuit; solenoid valves; drip pipes; and powering system. It was compelling to use a latching circuit as a means of saving energy for the coordinator node. Unlike sending and holding a pulse for the entire irrigation period which could waste battery power, the latching circuit sanctioned the use of a short pulse from I/O pins of the coordinator’s MCU. The latching circuit comprised optocouplers, switching transistors, digital NAND gates (forming reset-set flip-flop), and power transistors. The power transistors were used to switch on/off solenoid valves where irrigation pipes were connected. Switches were incorporated in the latching circuit to allow manual closing and opening of the valves in case of emergency. It was prudent to use L182D01-ZB10A (SIRAI) solenoid valves because of the low cost, low power consumption (5.5 W when latched), and the possibility of using a 12 V direct current power supply. The two latter features allowed the use of a single 14 W, 12 V solar panel to power both the solenoid valves and the latching circuit. This was more appealing for deployments in rural areas of developing countries where grid power supply is either scarce or unstable. With the above arrangements, the coordinator node was able to control the irrigation by sending short pulses to its MCU’s I/O pins. Specifically, two pins were dedicated for each of the two solenoid valves; in which case when initiating irrigation, the coordinator had to send a HIGH pulse lasting 1 second to the latching circuit through one pin. The latching circuit had to hold this state until the coordinator sent another high pulse to the other pin indicating completion of irrigation and, hence, valves should close. This study opted for drip irrigation system for the advantages it offers. Unlike the sprinkler system which sprinkles water all over the field, drip irrigation, also known as trickle
International Journal of Distributed Sensor Networks ZigBee module
Waspmote sensor board
Solar panel
- Real time clock - Microcontroller - Battery charging
Battery
- Memory - Analog/digital interface
Latching circuit
Irrigation system
Solenoid valves
Figure 7: The architecture of a coordinator and actuator node.
irrigation, is a type of irrigation system that applies water slowly and directly into the root zone of plants. In this case, scarce water resources are conserved since there is little or no chance for water to evaporate before seeping into the ground. Besides, Humphreys and others [17] found that drip was 33% higher in water productivity than both sprinkler and furrow. However, the biggest challenge of drip irrigation is its high installation cost especially for a large field where a great deal of pipes, drippers, and valves are deployed throughout the field. Since it is not recommended to apply water directly onto the sensors, this study placed the sensors midway between drippers. This allowed the water to diffuse around the drippers first before reaching the sensors resulting in the correct reporting of the moisture status of the soil. 2.1.6. The Gateway Node. One of the four in-field sensor nodes discussed in Section 2.1.3 assumed the role of a gateway used to send data to the RMS through a cellular network. In addition to a ZigBee module, this particular node was equipped with a GPRS module (refer to Figure 8). Just like any other in-field sensor node in this experiment, it was capturing Watermark frequency, soil temperature, and its battery level. The sensed data were sent to a coordinator for processing. Afterwards, the coordinator sent the processed data back to the gateway every 15 minutes when irrigation was in progress or every 30 minutes when the irrigation system was in an idle mode. The GPRS module residing on top of the gateway node was then used to communicate with the cellular network to forward the SMS data to the RMS for remote system diagnosis. The sensor data were collected at intervals of 2 minutes or 30 minutes depending on whether the irrigation was in progress or not. However, this study opted for sending the data to the RMS at intervals of 15 minutes when irrigating and 30 minutes otherwise. This arrangement reduced considerably the cost of the remote monitoring system by decreasing the number of SMSs sent. It should be noted that the data transmitted to the RMS were used for diagnostic
International Journal of Distributed Sensor Networks
7
GPRS module
ZigBee module
Waspmote sensor board - Real time clock
Cellular network
Solar panel
- Microcontroller - Battery charging - Memory
Battery
- Analog/digital interface
Agriculture Board
Temperature sensor
Moisture sensor
Figure 8: The architecture of a gateway node.
purposes only and not for decision making on when to initiate or terminate irrigation. Therefore, the data that were not forwarded to RMS were used by the controller in decision making. Although it was possible to use the coordinator node to send data directly to a remote server by equipping it with a GPRS module, this study was motivated to use this structure because of the following confounding issues. Firstly, the coordinator was configured to be a nonsleeping device because it was responsible for network setup and maintenance. It was also responsible for actuating solenoid valves in addition to receiving and processing sensor data from all other nodes in the network. As such, it was the busiest node in the network and, consequently, its battery was being depleted extensively. It was therefore necessary to offload SMS sending duties to a gateway node which, otherwise, was less loaded. Obviously, sending the same amount of data through the ZigBee module consumes less power (2 mW) than sending through GPRS to the cellular network (2000 mW) [16]. Secondly, since the coordinator node was the heart of the whole system, its failure was very critical. For instance, when the irrigation process is in session and in the event that the coordinator collapses, the system would fail to terminate the irrigation. In this instance, if the coordinator was responsible for sending the fault alarm to the remote personnel, there was no way the personnel would receive such an alarm. As such, it was imperative that an independent node, in this case the gateway, checks the status of the coordinator, on a regular basis and reports any hitches directly to the personnel. 2.2. Remote Monitoring Station. Figure 9 shows two architectural parts of RMS of which the first is the monitoring personnel who receive valve status and fault alarms directly onto their mobile phone for prompt reaction to the IS. The fault alarms included low battery levels for sensor nodes and wireless communication link failures. The second part is the server which is a computer equipped with a broadband
dongle and was used to store and graphically display both current and historical IS data. The data stored in the server included SMP, soil temperature, battery voltage levels, valve status, and RSSI. There was a possibility of adding a third section to the RMS in the form of Internet connectivity which could allow the IS performance data to be accessed across the globe. However, due to financial limitation this section was not implemented. Figure 10 presents a conceptual model of the server depicting how data emanating from the broadband dongle were processed and analysed graphically. Firstly, the data from the IS were received directly by the broadband dongle housed in the RMS. It was vital to delegate the data storing capabilities of the dongle to the first database. FrontlineSMS, a free open source software licensed under GNU Lesser General Public License, was used to receive the data because it offers a more user-friendly front-end browser based on Java FrontlineSMS back-end. Additionally, it has group forwarding, auto replying, and message forwarding functionalities. The raw data stored in the first database were not in the right format and syntax because IS prepared the data to suit the SMS transmission system. Consequently, a Hypertext Preprocessor (PHP) script was used to create a new database where the processed data were stored ready to be graphed and uploaded onto the Internet. The study used PHPlot as a graph library to show the results graphically onto a computer screen.
3. Performance Evaluation This study assessed the WSN deployment field readiness in agricultural application. Firstly, it investigated the ZigBee radio link performance through measurements of RSSI at different distances of the WSN nodes and different heights of the maize plants. Secondly, the study monitored battery performance for sensor nodes both at night and during the day. Thirdly, it was interesting to assess whether battery performance had a bearing on radio link performance or not.
8
International Journal of Distributed Sensor Networks
Cellular network
SMS contains: - Soil moisture - Soil temperature - Valve status - Link performance - Battery level
Server-computer and broadband dongle
Physical parameters and system fault alarms are captured Irrigation system + controller
SMS contains: - Fault alarms - Valve status
Irrigation station
Monitoring personnel
Remote monitoring station
Figure 9: The architecture of the Remote Monitoring Station showing two parts and the type of information sent to each part.
Refresh Broadband
dongle
Frontline SMS
MYSQL database 1
PHP script
MYSQL database 2
PHP script
Display
Refresh
Figure 10: A conceptual model of the server for the remote monitoring station.
Finally, the fluctuations of SMP in the agricultural field were monitored. 3.1. Received Signal Strength Indicator. The performance of the WiPAM was assessed in terms of RSSI at different distances and heights of the maize plants. Zennaro and others [18] reported that RSSI is one of the three commonly used WSN link quality estimators which is a signal based indicator, and is computed over the signal present in the channel at a particular time. The other indicators are the link quality
indicator and the packet reception rate. In this experiment the performance of the network was analysed based on RSSI. Accordingly, the study used XBee-ZB modules at 2.4 GHz as radio transceivers whose sensitivity was −96 dBm [16]. This means that the communication link is bound to fail when RSSI goes below −96 dBm. 3.1.1. RSSI over Distance. The four in-field sensor nodes were fixed but the coordinator was moved from one place to another. In the first experiment, the coordinator node was
3.2. Battery Level. As the system had to be self-sustained in terms of power, solar panels and rechargeable Li-ion batteries were used to power all electronic devices in this system. After evaluating the performance of the system in terms of power usage, it was discovered that the three in-field sensor nodes were more efficient than the coordinator. As generally
−50 −60 −70 −80
22/01/12 03:00
21/01/12 21:00
21/01/12 15:00
21/01/12 09:00
21/01/12 03:00
20/01/12 21:00
20/01/12 15:00
20/01/12 09:00
20/01/12 03:00
19/01/12 21:00
19/01/12 15:00
−90 −100
Date and time Node 11 Node 21 Average
Node 12 Gateway (node 22)
Figure 11: Received signal strength against time—at 23 m distance.
24/01/12 18:00
24/01/12 12:00
24/01/12 06:00
24/01/12 00:00
23/01/12 18:00
23/01/12 12:00
23/01/12 06:00
23/01/12 00:00
22/01/12 18:00
Received signal strength against time—at 7 m distance
22/01/12 12:00
−40 −50 −60 −70 −80 −90 −100
22/01/12 06:00
3.1.2. RSSI over Height of Crops. As described in the previous section, the sensor nodes were placed at a height of 60 cm above the ground. Monitoring of the link performance commenced when the maize plants were 50 cm tall. At the end of the experiment the crops had grown to about 200 cm thereby covering the in-field sensor nodes completely. Figure 13 shows a scenario in which the sensor is being fully covered by the maize plants. Figure 14(a) depicts the RSSI for individual nodes as a function of crop height. In order to clearly define the crop height impact on RSSI, the average RSSI for the nodes was plotted against the crop height as shown in Figure 14(b). The graph in this figure shows a slight decrement in the level of RSSI with crop height. However, as depicted by the bestfit line of the average RSSIs, there is no major degradation in the quality of the communication link corresponding to the height of the crops. Nevertheless, it is recommended that more experiments should be conducted to examine this observation especially when the distance between nodes is long. Furthermore, it may be interesting to explore the impact of frequency variation on RSSI.
Received signal strength against time—at 23 m distance
−40
Received signal strength (dBm)
placed in such a way that the relative distances between the respective sensor nodes and the coordinator were 23 m. All the nodes were placed at a height of 60 cm above the ground. In the second experiment, the coordinator was moved closer to the in-field nodes with a distance of 7 m to each node and at the same height as in the first scenario (Figure 5 shows sensor positions for this case). Figure 11 shows the results of the network performance in terms of RSSI expressed in dBm when the distance between sensor nodes and the coordinator was 23 m. On the other hand, Figure 12 shows the same parameters when the distance was reduced to 7 m. The results show that the communication links were bound to fail when the distance was 23 m since the RSSI was at around −90 dBm which is very close to the receiver sensitivity of −96 dBm. On the other hand, it was essentially improbable for the network to fail when the distance between the nodes and the coordinator was 7 m since the RSSI was at around −58 dBm. These results confirm the FRIIS equation which states that RSSI varies inversely with the square of the distance. Therefore, it is absolutely imperative in any practical deployment to consider placing sensor nodes in such a way that the distances between the nodes are optimized in accordance with the size of the field. Furthermore, it is worth to note that multipath fading which was exacerbated by the movement of leaves of the maize plants played a very crucial role on RSSI. This is portrayed by the random fluctuation of the RSSI graphs shown in both Figures 11 and 12.
9 Received signal strength (dBm)
International Journal of Distributed Sensor Networks
Date and time Node 11 Node 12 Node 21
Gateway (node 22) Average
Figure 12: Received signal strength against time—at 7 m distance.
Sensor node covered
- Potential danger?
Figure 13: Sensor node being covered by maize plants.
10
International Journal of Distributed Sensor Networks RSSI varying with crop height −45 −50 −55 −60 −65 −70 −75 −80 −85 −90 −95 50
29/01/12
70
Node 11 Node 21
05/02/12
90
12/02/12
19/02/12
110 130 150 Crop height (cm)
Average RSSI varying with crop height
26/02/12
170
04/03/12
Date
190
Received signal strength (dBm)
Received signal strength (dBm)
22/01/12
22/01/12
−45 −50 −55 −60 −65 −70 −75 −80 −85 −90 −95 50
29/01/12
70
05/02/12
90
12/02/12
110
19/02/12
130
26/02/12
150
04/03/12
170
Date
190
Crop height (cm)
Node 12 Gateway (node 22)
Average RSSI Best fit for average RSSI
(a)
(b)
Figure 14: Variation of received signal strength with crop height.
3.3. Battery Level versus RSSI. It was important to investigate the correlation between the battery level and RSSI as performance parameters. Figure 16 shows graphs of the four nodes’ battery levels and RSSIs plotted on the same time scale. The results show that there is a correlation between the battery level and the RSSI. Both battery level and RSSI peak at around 3:00 PM and slump dramatically at around 4:00 AM. They
Battery level against time 100 Battery level (%)
80 60 40 20
Node 11 Node 12 Node 21
21/02/12 08:00
14/02/12 08:00
07/02/12 08:00
31/01/12 08:00
24/01/12 08:00
17/01/12 08:00
10/01/12 08:00
03/01/12 08:00
27/12/11 08:00
0 20/12/11 08:00
expected, this was solely due to the fact that the three infield sensor nodes were using deep sleeping mode as a way of conserving power. The coordinator node was never put into sleeping mode. In spite of employing sleeping mode, the gateway node had its battery level depleted so quickly because most of its power was being used for sending SMSs to a remote monitoring site. Through these experiments it was found that the 2.5 W solar panels were enough for the three in-field sensor nodes, while the gateway and coordinator had to be powered by 5 W and 7.5 W solar panels, respectively. The batteries of the gateway and the coordinator were changed from 1150 mAh to 2300 mAh and 2450 mAh, respectively, while 1150 mAh batteries sufficed all the other three in-field sensor nodes. Figure 15 shows the battery levels for all the five sensor nodes used in this experiment. Clearly, the gateway and coordinator batteries were a major concern in this deployment before the changes were effected. The graphs in this figure show that on a number of occasions (e.g., on 3rd, 10th, 12th, and 18th January, 2012) the coordinator battery was depleted completely. At these instances, the system had to be resuscitated by a higher capacity battery which was used for powering the valves. As depicted by the graphs, all the batteries were heavily depleted between 18th January and 21st January when there was no sunshine due to heavy rains. It was after this point in time that the changes in the powering requirements of the gateway and the coordinator were inevitable.
Date and time Gateway (node 22) Coordinator
Figure 15: Sensor node battery level varying with time.
start to peak again at around 7:00 AM when the sun rises and starts to charge batteries. Furthermore, it was observed that the random fluctuations of RSSIs were as a result of the interaction of radio waves with the plant cover’s dynamic nature affected by air flow in the field. This might have contributed significantly to a weak correlation between RSSIs and battery levels as depicted in Table 1 for node 11, 𝑟(215) = 0.23, 𝑃 < 0.05; node 12, 𝑟(215) = 0.16, 𝑃 < 0.05; node 21, 𝑟(215) = 0.2, 𝑃 < 0.05; node 22, 𝑟(215) = 0.15, 𝑃 < 0.05. The results demonstrate the need to balance between power and RSSI requirements to achieve a specified quality of service (QoS). Specifically, the battery discharge level should be minimised where a high level of RSSI is required. Conversely, the RSSI could be compromised in noncritical applications where conservation of battery power is of paramount importance.
11
06/03/12 08:00
28/02/12 08:00
21/02/12 08:00
14/02/12 08:00
07/02/12 08:00
Date and time
Node 11 Node 12 Node 21
Node 21 Node 22 Full capacity
26/01/12 07:00
25/01/12 19:00
25/01/12 07:00
24/01/12 19:00
24/01/12 07:00
23/01/12 19:00
23/01/12 07:00
22/01/12 19:00
−80 −90
31/01/12 08:00
−70
−25
24/01/12 08:00
−60
−20 17/01/12 08:00
−50
−15
10/01/12 08:00
20
RSSI against time −40
22/01/12 07:00
Received signal strength (dBm)
40
−10
03/01/12 08:00
60
27/12/11 08:00
80
Soil moisture potential against time
−5
20/12/11 08:00
100
Battery level (%)
Battery level against time
Soil moisture potential (kPa)
International Journal of Distributed Sensor Networks
Figure 17: Soil moisture potential varying with time.
Date and time Gateway (node 22) Average
Figure 16: Correlation analysis between sensor node battery level and RSSI.
Table 1: Correlation analysis between sensor node battery level and RSSI. Node 11 0.23, 215, 0
Node 12 0.16, 215, 0
Node 21 0.24, 215, 0
Upper limit Lower limit
Node 22 0.15, 215, 0
3.4. Soil Moisture Potential. Since the main objective of WiPAM was to automate irrigation, it was important for the management personnel to remotely monitor SMP fluctuations in the agricultural field and compare with the set levels. In order to satisfy the plant water needs, irrigation was initiated when the SMP at any of the two sensor locations dropped to −19.2 kPa which represented a 50% management allowable depletion. The irrigation was then terminated when both sensors reported at least −11.3 kPa representing a 10% of depletion from the field capacity (FC) of −9.88 kPa. These threshold levels were established based on the water holding capacity of the soil type at the site. Based on the set SMP threshold levels the personnel precisely predicted the next irrigation event by tracing the displayed graphs of SMP on the computer. Figure 17 shows how the controller managed the irrigation scheduling by keeping the level of SMP within the stated limits. However, as it can be seen from the graphs, it was really hard for the controller to safeguard the upper limit. Although the controller terminated the irrigation at −11.3 kPa, on most occasions the moisture still rose to just over the FC. This is due to the fact that water diffuses gradually into the soil. As such, by the time the sensor reports a change in water level the system will have already applied a bit more water. This water will continue trickling down for some time. As a solution
to this predicament, the study chose a slightly lower cut-off point of SMP than FC so to avoid over irrigation. In order to contain this problem further, it is recommended that the use of water budget scheduling strategy should be adopted. In this strategy, the irrigation controller computes the amount of water needed for each irrigation event based on the current SMP readings. The controller then irrigates for an estimated duration after which it terminates the irrigation and goes into hibernation for a predetermined period of time. Upon waking up, it measures the SMP and reirrigates if the level is lower than FC; otherwise, it stops the irrigation. This study suggests that in this way over irrigation will be avoided, and hence, water resources will be managed effectively without compromising the crop yield. The graphs in Figure 17 also show a very interesting phenomenon about how crop water use varies with growth stage. During the early stages there were fewer irrigation events than at later stages when the maize had grown. For instance, there were about three irrigation events between 20 December 2011 and 12 January 2012 (23 days) as compared to five events between 7 and 28 February (21 days).
4. Challenges and Experiences Gained This study has exposed a number of valuable experiences which can be used to speed up the process of designing new WSN deployments for PA. Firstly, the study revealed a practical challenge concerning the conflict between ZigBee and GPRS modules. When both ZigBee and GPRS modules were powered up, either of them would lose connection which required manual reset. Nonetheless, using an appropriate software configuration in the gateway node, it was possible to turn off one module when the other was active. This was not possible at the coordinator node since its ZigBee module was always required to be on to avoid losing connection with the other network nodes. However, this conflict could be specific to Waspmote and probably dependent on the firmware. It could be solved in a future release of firmware and may not be a general problem.
12 Secondly, there was a challenge of powering requirements for the sensor nodes which, on several occasions, required site visit to resolve the problem. The batteries for the coordinator and gateway nodes were being heavily depleted. The system, nonetheless, became remarkably resilient to power failure when battery capacities for the gateway and coordinator nodes were increased. The robustness of the system was further enhanced by increasing the sampling time from 5 minutes to 30 minutes when in idle mode and from 1 minute to 2 minutes when irrigating. This implies that where power supply is limited, or in order to reduce the cost of WSN deployment through the use of low capacity batteries and small-sized solar Photovoltaic panels, one needs to consider increasing the sampling time. Therefore, this study concludes that it is advisable for a large network to divide the system into several independent subnetworks so that no single node is used to amass the data from all the other nodes. It was also noted that keeping distances between sensors as short as possible can improve battery performance tremendously as generally expected. Thirdly, a very crucial requirement of any WSN deployment is close monitoring. Rather than conducting physical site visit, which is time consuming and expensive, it was compelling to monitor the system performance remotely. This was imperative as personnel could timely identify system faults and conduct pre-emptive maintenance by visiting the field only when needed. The study suggests that any successful WSN deployment must involve remote monitoring through a cellular network which is broadly available even in rural areas of developing countries. Finally, it was also observed that there is a possibility of disturbing the sensors during field work, for example, weeding.
5. Conclusion and Future Work This paper has demonstrated how an IMS can be implemented based on WSN. It has further evaluated the performance of the design in order to develop a more robust and sustainable system considering the challenges that any practical deployment would face. Specifically, the paper has explored battery performance for sensor nodes, RSSI, and the correlation between the two. The study suggests that sensor battery performance has serious repercussions on the robustness of WSN deployment since it erodes RSSI. The study has also shown that placement of sensor nodes in the agricultural field is critical. The distance between sensor nodes has to be as short as possible in order to improve the resilience of the system remarkably. Furthermore, it has been revealed that several performance parameters can be monitored cost effectively using a WSN node equipped with a GPRS module and using open source tools that include FrontlineSMS, MYSQL, and PHP. The use of cellular network reduces the cost of the remote monitoring system since an SMS charge is extremely low as compared to satellite communication or Wi-Fi connectivity. Moreover, cellular network coverage is broad even in remote areas of developing countries.
International Journal of Distributed Sensor Networks However, a large-scale deployment is proposed in order to assess the ability of the ZC node in handling numerous queries from the in-field sensors. Since WSNs are flexible on the software layer and, hence, can accept any scheduling strategy, it is further proposed that future deployments should focus on improving water application efficiency. In this way, both water and energy used in irrigation water pumping will be conserved. It is envisaged that this will foster installations of low-capacity solar photovoltaic water pumping systems for irrigation to suit the socioeconomic conditions of small scale farmers in developing countries. While it would be interesting to explore the practical performance of WSN irrigation systems in other areas of Malawi, this paper suggests that such setups would compare well with the current deployment in Blantyre. This is also because Malawi as a small country experiences almost evenly distributed weather conditions.
Conflict of Interests The authors of this paper declare that the choice of all devices and software applications used in this research was solely on a professional basis. There is no direct financial relation with the trademarks mentioned in this paper that might lead to a conflict of interest.
Acknowledgments The authors of this paper would like to thank the Community Rural Electrification and Development Project funded by the Scottish Government through the University of Strathclyde for providing the equipment deployed in this study. Furthermore, the authors thank Damien Frame of the University of Strathclyde and Elijah Banda of the Malawi Polytechnic for their tremendous contributions leading to the success of this project. This paper was partly supported by the project “Secured quality of service aware wireless sensor networks: toward effective network and energy management” funded by a Grant from the South African National Research Foundation.
References [1] S. Fazackerley and R. Lawrence, “Reducing turfgrass water consumption using sensor nodes and an adaptive irrigation controller,” in Proceedings of the IEEE Sensors Applications Symposium (SAS ’10), pp. 90–94, February 2010. [2] J. Balendonck, J. Hemming, B. van Tuijl, L. Incrocci, A. Pardossi, and P. Marzialetti, “Sensors and wireless sensor networks for irrigation management under deficit conditions (FLOW-AID),” FLOW-AID, 2008. [3] M. Keshtgary and A. Deljoo, “An efficient wireless sensor network for precision agriculture,” Canadian Journal on Multimedia and Wireless Networks, vol. 3, no. 1, pp. 1–5, 2012. [4] Y. Zhou, X. Yang, L. Wang, and Y. Ying, “A wireless design of low-cost irrigation system using ZigBee technology,” in Proceedings of the International Conference on Networks Security, Wireless Communications and Trusted Computing (NSWCTC ’09), pp. 572–575, April 2009.
International Journal of Distributed Sensor Networks [5] A. Prince-Pike, Power characterisation of a ZigBee wireless network in a real time monitoring application [M.S. thesis], Auckland University of Technology, 2009. [6] IRROMETER Company, WATERMARK Soil Moisture Sensor MODEL 200SS, Riverside, Calif, USA, 2010. [7] Libelium, “Watermark Sensors Interpretation Reference,” Libelium Comunicaciones Distribuidas S.L., pp. 1–6. [8] C. C. Shock, J. M. Barnum, and M. Seddigh, “Calibration of watermark soil moisture sensors for irrigation management,” in International Irrigation Show, pp. 139–146, Irrigation Association, San Diego, Calif, USA, 1998. [9] R. Allen, “Calibration for the watermark 200ss soil water potential sensor to fit the 7-19-96 “calibration no.3” table from irrometer,” University of Idaho, Kimberley, Idaho, USA, 2000. [10] R. B. Thompson, M. Gallardo, T. Ag¨uera, L. C. Valdez, and M. D. Fern´andez, “Evaluation of the Watermark sensor for use with drip irrigated vegetable crops,” Irrigation Science, vol. 24, no. 3, pp. 185–202, 2006. [11] J. Chard, “Watermark soil moisture sensors: characteristics and operating instructions,” Utah State University, 2002. [12] P. R. Johnstone, T. K. Hartz, M. LeStrange, J. J. Nunez, and E. M. Miyao, “Managing fruit soluble solids with late-season deficit irrigation in drip-irrigated processing tomato production,” HortScience, vol. 40, no. 6, pp. 1857–1861, 2005. [13] Texas Water Development Board, “Agricultural Water Conservation Practices,” 2004. [14] M. Morris, “Soil moisture monitoring: low-cost tools and methods,” National Center for Appropriate Technology (NCAT), pp. 1–12, 2006. [15] S. Irmak, J. Payero, D. Eisenhauer et al., “Watermark Granular Matrix Sensor to Measure Soil Matrix Potential for Irrigation Management,” University of Nebraska-Lincoln Extension, 2006. [16] Libelium, “Waspmote datasheet, vers. 0.8,” Libelium Comunicaciones Distribuidas S.L., pp. 1–6, 2010. [17] L. Humphreys, B. Fawcett, C. O. Neill, and W. Muirhead, “Maize under sprinkler, drip & furrow irrigation,” IREC Farmers’ Newsletter, no. 170, pp. 35–38, 2005. [18] M. Zennaro, H. Ntareme, and A. Bagula, “Experimental evaluation of temporal and energy characteristics of an outdoor sensor network,” in Proceedings of the International Conference on Mobile Technology, Applications, and Systems (Mobility ’08), pp. 99:1–99:5, ACM, New York, NY, USA, September 2008.
13