types of disorientation events and aid in their recovery, our approach will be extendable to other. SD illusions. ...... Enhanced displays (HDD,. HUD, HMD, low ...
AFRL-HE-WP-TR-2004-0035
Research Laboratory " yr^, ^ '^-pc^^jf^
MULTISENSORY INTEGRATION FOR PILOT SPATIAL ORIENTATION (MIPSO)
Ronald L. Small Christopher D. WIckens Alia M. Oster John W. Keller Jon W. French Micro Analysis and Design, Inc. 4949 Pearl East Circle, Suite 300 Boulder CO 80301
March 2004
Final Report for the Period June 2003 to March 2004
20040830 072 Approved for public release; distribution is unlimited.
Human Effectiveness Directorate Warfighter Interface Division 2255 H Street Wriglit-Patterson AFB OH 45433-7022
M^RJL\ \J- •' \
Extern til car^-in
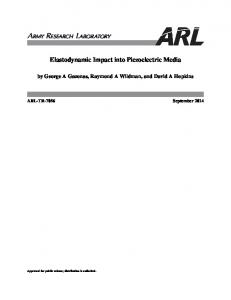
Figure 3. The role of the semicircular canals in the perception of 3-dimensional motion (US Army Field Manual, 2000).
The vestibular system has a long phylogenetic history in mediating orientation to gravity in spatial behavior (Howard, 1986). However, until recently, it has appeared primarily as a silent partner in regulating eye and head movements and particularly in spatial cognitive memory of self-motion, or body linear displacement in 3D space (Berthoz et al., 1995; Baloh & Honrubia, 1990). Normally, vestibular sensations do not produce conscious awareness of space and gravity unless they are in conflict with information from visual and proprioceptive cues. At rest, the semicircular canals are shown as in Figure 3 and no motion is sensed. As rotational motion occurs, the ciha (hair cells) in the canals bend in response to the relative motion between the canal walls, to which the ciha are attached, and the fluid within the canal. The fluid's inertia
F33615-03-M-6360
Multisensory Integration for Pilot Spatial Orientation
provides initial resistance and bends the cilia, which informs the brain of the acceleration axis and the magnitude of angular acceleration. After undergoing sustained and constant angular motion, however (e.g., continuous yaw in a standard rate turn), tiie fluid within the canals begins to rotate at a velocity corresponding to the body and head. As a consequence, there is no longer relative motion between the cilia and the fluid within the canals, the cilia are not bent, and so no sensation of motion is sent to the brain. This phenomenon is called ''wMhouf and has important implicatioiK for spatial disorientation. This washout occure after approximately 10-15 seconds of sustained rotary federation (Gillingham & Previc, 1993). Another important term to SD research is Mulder's constant (DeHart & Davis, 2002), which describes a threshold below which accelerations are not sensed by the human vestibular system. Mulder's constant is 2° per second, which makes it appear as a velocity, even though it is actually the product of an acceleration and that acceleration's duration. The best way to illustrate the meaning of Mulder's constant is with a few examples: 1. If a person experiences an acceleration of 1 °/sec^ for 1 sec, he or she will probably not sense that acceleration because the product (l®/sec) does not exceed Mulder's constant, 2. If the same acceleration occurs for 3 sec, however, it will likely be detected (because the product, 3''/sec, exceeds Mulder's comtant). 3. Even a large acceleration of IC/sec^ will MJ be felt, if its duration is less than 0.2 sec. The same «»eleration will be felt, if its duration is 0.2 sec or greater. It is important to note that not all humam have identical thresholds, but Mulder's constant is a good generaHzation across a population of people. Equally important is the caveat that not all acceleration durations above Mulder's constant will be seized. Distractions, fatigue, and other physiological reasoiM may exist to make a person oblivious to federation durations exceeding Mulder's constant. It is a good start, though, for any SD modeling effort, as discussed in Chapter IV. While ftie semicircular canals sense rotary motion, the otolith organs sense linear acceleration. Here, in the presence of linear acceleration, the ciUa within the linear otolith organs will bend backward, opposite to the direction of acceleration. This angle of bend, relative to the orientation of the organ, signals the degree of acceleration. The orientation of the cilia is as affected by gravitational force as well as by accelerations (Howard, 1986). Hence a Imear forward acceleration will produce the same vestibular sensation as a tilt backward, producing the phenomenon of the somatogravic illusion (Gillingham & Previc, 1993; Tokumaru et al., 1998), in which pilots who execute a rapid acceleration (for example, on a missed approach) may incorrectly perceive a pitch-up motion. The vestibular organs have been the focus of many past efforts to understand the SD that pilots experience during flight. The vestibular organs are important because they constitute the key seiKory modality specifically evolved to detect acceleration of the head in inertial space, yet they are not designed to provide vertical body orientation or sustained acceleration information within the unusual sensory-motor and force enviroimients that occur in flight. However, pilots receive training about illusions caused by vestibular-visual conflicts and are taught to believe then: aircraft instruments if they experience such illusions.
10
F33615-03-M-6360
Multisensory Integration for Pilot Spatial Orientation
Illusions Spatial disorientation accidents have been referred to as those in which the pilot crashes because the seriousness of the situation does not become evident until it is too late. There are numerous, well-documented illusions that are generated by visual-vestibular conflicts. This section will describe some of the kinds of illusions that result from the unique environments produced by human flight.
Leans The most common SD illusion in flight is the Leans (Holmes et al., 2003; Benson, 1988), which entails an erroneous feeling of roll. A typical case occurs in the following scenario (Gillingham & Previc, 1993): In IMC, the pilot has very slowly entered a turn, perhaps unknowingly, at a sub-threshold rate of less than 2°/sec (i.e., below Mulder's constant) so that the semicircular canals provide no sense of rotation. If the pilot then becomes consciously aware of the aircraft's bank angle (e.g., by looking at the instruments), and intentionally returns the bank to the true level attitude, he or she will now receive a vestibular sensation of an opposite bank. If the pilot continues to rely upon flight instruments to maintain a level attitude, he or she may also lean in the orientation of the incorrectly perceived upright (hence the illusion's name). If the pilot does not rely upon the instruments at this point, but rather the intuitive (vestibular) signal of upright, he or she will return the aircraft to its original bank angle. Without awareness and conscious correction, the bank will lead to a gradual pitch down attitude, a loss of altitude, and an increase in airspeed. This side-to-side seesawing process of correction and re-entry may continue until the pilot is so disoriented that recovery to straight-and-level flight is difficult, if not impossible (a Type 3 SD event). This may lead to a progression into a more severe loss of altitude, which ends with ground impact.
Coriolis The pilot's inability to control the airplane because of spatial disorientation, exacerbated by failure oftheprimaiy attitude indicator, night IMC, adverse weather including turbulence and noise from rain, were the cause and contributing factors of the Oct. 2000 crash of a Cessna 335 that killed Missouri Governor Mel Carnahan and all others aboard the aircraft (NTSB, 2002). The fatal accident that killed Governor Carnahan and his entourage is a classic and tragic example of an SD scenario. We do not know whether it was unrecognized (Type 1) or recognized (Type 2), only that the pilot seemed to pitch down and to the right during his attempt to return and land after an aircraft instrument malfimction shortly after takeoff. The NTSB found that the primary attitude indicator (AI) failed in instrument meteorological conditions (IMC). However, the co-pilot's attitude indicator was working at the time of the crash. The NTSB report indicates that the pilot would logically try to use the co-pilot's AI, located to the pilot's right. Using that Al and then checking his own instruments for heading and altitude, the pilot's head motions, coupled with the airplane's turn back toward the takeoff runway would induce a Coriolis illusion. The FAA's Airman's Information Manual (ASA, 1995) describes the Coriolis illusion as the "most overwhelming of all illusions in flight" (page 645). It occurs during "a prolonged constant-rate turn that has ceased stimulating the... [vestibular] system," (i.e., washout) when there is an abrupt head movement that creates "the illusion of rotation or movement in an entirely
11
F33615-03-M-6360
Multisensory Integration for Pilot Spatial Orientation
different axis," The resulting tumbling sensation is nearly incapacitating. The Coriolis illusion often results in the pilot's loss of aircraft control, which can have catastrophic results if there is no other pilot to assume control. The power of the Coriolis illusion to deceive is fiirther supported by the finding in a recent survey that it was the most prevalent of those found in 141 pilots attending a course at Randolph AFB in 1997-98 (Sipes & Lessard, 1999), The CorioHs illusion was selected as one of the prototypical illusions in this project because it is among the most common flight illusions (#5 in the Ust compiled by Holmes et al., 2003) and is often fatal. It causes overwhelming disorientation and so is an appropriate illusion to combat.
Conclusion In summary, the physiological circumstances underlying many spatial disorientation illusions are as follows: Aircraft motion, sometimes coupled with head motion, provides illusory vestibular signals to the brain. Normally, when salient visual cues are available, visual dominance will allow the vestibular cues to signal the correct orientation and motion. However, when the visual cues are degraded or missing, the compelling vestibular signals will dominate, and illusions will occur. Knowledge of how these illusions begin and progress provides suggestions for counterme^ures, which we address in the following chapter.
12
F33615-03-M-6360
Multisensory Integration for Pilot Spatial Orientation
III. Countermeasures: Displays & Other Technologies This chapter describes a multisensory approach to preventing, minimizing, or compensating for pilot spatial disorientation. Since human spatial orientation has such a large visual component, we describe visual displays in some depth. Audio and tactile displays follow, and then an intelligent system approach to applying the various SD countermeasures. All of these technologies fit within a layered approach to combating SD.
Background We suggest a layered approach to improving pilot attitude awareness and reducing the negative consequences of SD events. Improving current cockpit displays (i.e., head-down, head-up, and helmet-mounted) and incorporating new technologies (e.g., 3D audio, tactile) requires a methodology for integrating and testing all of the salient technologies and techniques to determine which ones are the best at enhancing attitude awareness, preventing SD events, and minimizing the impact of any SD events that do occur. A layered approach begins with pilot training and mission pre-briefmgs, and extends through improved display technologies and recovery aiding, into post-flight data analyses to better understand, categorize, and track SD events to determine the actual operational effectiveness of the various techniques advocated to improve SD statistics. Recent research has explored new approaches to addressing SD: better attitude information for head-down, head-up, and helmet-mounted displays; 3D audio displays; and, tactile displays. Which of these approaches, or combination of approaches, is best at reducing SD? Because the potential of each individual technology to reduce SD has not been established (theoretically or empirically), it is difficult to postulate the "best" combination. Rather, it seems that whichever displays are best in a given set of circumstances at helping pilots to recognize and recover from that SD event, then those are the displays that should be used. How do researchers know which displays are best for different SD scenarios? There is nothing in the current literature to suggest an answer; therefore, it will be difficult to devise the best combination. In fact, a best combination or solution may not be possible for the foreseeable future, due to individual pilot and mission susceptibility, risk factors, and circumstances. But, we can theoretically and empirically determine good combinations of inputs to help combat SD. Determining the best approach for converting Type 1 into Type 2 SD events should take a human cognition and workload modeling approach. When visual senses are overloaded or deemed unreliable, the audio channel may be useful.^ A tactile (vest) attitude display may also help, but research into tactile displays is in its infancy.^ A presently untested sense for SD is the sense of smell. Smells are very compelling and may be useful for Type 3 (incapacitating) SD to help pilots "snap out of it." Such an olfactory system will need sensors to know that the pilot is incapacitated, and the smell used must be penetrating, harmless, and easily carried aboard aircraft.
^ It is common aviation knowledge that air traffic controllers have talked disoriented pilots through recoveries. Tlie proposed PI has an audiotape of a controller telling a pilot to "release the controls" to recover from a graveyard spiral. ^ Vibrotactile transducers: Utilizing tactile displays to improve performance in spatial tasks in aerospace, land and sea environments, http://www.navysbir.brtrc.com/cap/briefingsadmin/ea.asp.
13
F33615-03-M-6360
Multisensory Integration for Pilot Spatial Orientation
When the pilot does not recognize an SD event (Type 1), intelligent aiding systems may help. For example, audio recovery instructions have shown some early utility with SD events in simulatoisJ They key is for the aiding system to recognize when SD is causing an unusual attitude or dangerous situation. The emph^is of such systems ought to be on preventing the bad consequences of SD events, since it will be virtually impossible to prevent all SD events due to the normal physiological response to most events that induce SD (as described in the previous chapter). Consequently, the best approach is a layered one that seeks to enhance attitude awareness and combat SD via multiple techniques: training improvements, operational awareness, better displays (visual, auditory, tactile, olfactory), intelligent automation, and rigorous post-flight SD event analyses to better understand and characterize SD events, which should also indicate the operational effectiveness of the various SD-combating techniques.
Training Improvements Training can help pilots recognize the types of circumstances that lead to SD so that they will be vigilant for the same or similar circumstances (Gillingham & Previc, 1993). Training also needs to be enhanced and should include classroom discussion, simulator and centrifuge training, and aircraft demoMtrations. While there is some risk to akcraft demonstrations, the risk of not doing so is reflected in the rates of SD accidents in military and civil aviation over many decades. Clearly, not all SD event categories could be demonstrated, but a significant cross-section could be. Teaching SD situation recognition is a major contribution to prevention.' And, pilots who are more vigilant for SD-inducing circumstances are better equipped to avoid or successfully combat them. It is also important to teach recovery techniques for each SD situation to reduce the occurrences of Type 3 SD events. The most prevalent factor in USAF SD incidents is attention management (Davenport, 2000), a skill that can (and should) be improved with training (Gopher, Weil, & Barakeit, 1994).
Operational Awareness Pre-briefings could reduce some SD event severity. Certainly, pre-briefings could increase the odds of any SD event bemg Type 2 rather than Type 1. Since the environmental conditions that increase suscqjtibility to SD are known, mission pre-briefings will be timely reminders to pilots, thus reducmg the likelihood of an SD event bemg Type 2 or 3. The Lidian Air Force has developed a checklist enumerating SD threats, and has even anticipated the increased threat of SD from supermaneuvers, in such aircraft as the F-22, F-35, V-22, and Apache helicopter (Gomez, 2002). US Ak Force statistics about contributing factors to SD incidents point to conditions in which the pilot is highly susceptible to SD. All of this knowledge and experience should be highlighted during mission planning and pre-briefings so that pilots can be vigilant. Weather conditions, moonless night flints over the desert, and night vision goggle (NVG) use, are all known to be ' Personal communication with Dr. Kristen Liggett (11/21/02): ".,. 'talking' Ihe pilot through a recovery is something we just recently tried in flie lab.... The date is still being analyzed, but.. .they [the pilot subjects] followed the instructions and had successM recoveries." * There is a new type of simulator for such training; see Aviation Week & Space Technology, 12/2/02 issue, pg. 60. ' Preventing disorientation mishaps, http://www.spatiald.wpafb.af.mil/prevention.asp. _
^
—
F33615-03-M-6360
Multisensory Integration for Pilot Spatial Orientation
risk factors (Berkley & Martin, 2000). Reminding pilots of the relevant mission risk factors, and what to do if SD occurs, refreshes their earlier training - another important layer in a comprehensive approach to mitigating the effects of SD.
Display Improvements Because the primary source of information to the pilot is visual, because the visual modality is the most compatible modality for presenting spatial information relevant to attitude (Wickens et al., 1983), and because SD incidents are most prevalent in IMC or at night (when the view of the true horizon is obscured or gone), it is not surprising that a key countermeasure in combating SD is in the design of effective visual displays. Sadly, many advances in this direction are lacking, because design has generally focused on providing the necessary information to support spatial orientation, but not on the ideal format in which that information should be depicted most naturally or intuitively. One of the major culprits appears to be the focus on using the round dial or "steam gauge" display, even as cockpit displays have evolved to include computer generated imagery, where the electromechanical constraints associated with the round dial are no longer relevant. In the pages below, we discuss some of the display formatting issues and ideas that are relevant for effective support of spatial orientation, in conventional head-down instruments, and in head-up and helmet-mounted displays. Frame of reference for the attitude indicator Clearly, in IMC, a pilot's perception of the upright must be supported by a well-designed attitude indicator (AI), which can support the intuitive grasp of the orientation of the horizon. Much of the research on AI design has focused on the question of whether the aircraft symbol or the horizon line should move as a function of aircraft bank and pitch. The conventional design, presenting a moving horizon, is argued to be congruent with the pilot's mental model or mental representation of the forward horizon appearing to slant in one direction, which is opposite to the direction of the aircraft's actual bank. Thus, this AI design corresponds to what Roscoe (1968) describes as ^Q principle of pictorial realism (see also Wickens & Hollands, 2000; Wickens, 2003). In contrast, ihe principle of the moving part, also associated with Roscoe's (1968) work, proposes that the moving element on a display should correspond to the element that moves in the pilot's mental model of the aircraft, and should move in the same direction as that mental representation. Because the pilot's mental model represents the aircraft moving in a world that is stable (Johnson & Roscoe, 1972; Kovalenko, 1991; Merryman & Cacioppo, 1997; Previc & Ercoline, 1999; Previc, 2000a), this principle suggests that the aircraft should be depicted as the moving element on a display, and, for example, when the aircraft climbs or pitches up, this element should move upward. The moving horizon of the attitude indicator in Figure 4a violates this principle, since the moving element (horizon) moves upward to signal that the aircraft is pitching downward, and rotates to the right (or left) to signal that the aircraft is rotating left (or right). To conform to the principle, the airplane should move around a stable horizon, as in Figure 4b.
15
F33615-03-M-6360
Multisensory Integration for Pilot Spatial Orientation
Figure 4. Arcraft attitude displays: (a) inslde-out, (b) outside-in, and (c) frequency-separated. ^1 displays show a left bank. Low frequency return to steady state is indicated by an-ows in (c) (Wickens & Hollands, 2000, pg. 137).
However the conventional design to configure the AI ^ a moving horizon, rather than as a moving aircraft, is one that can be argued to better satisfy the principle of pictorial reahsm, since, when the pilot looks outside, the moving horizon display better corresponds with what is seen looking forward from the cockpit. Roscoe (2002) h^ argued that the consequences of such violations of the principle of the moving part, are possible confusions leading to spatial disorientation, when, for example, a downward display movement is incorrectly interpreted as a downward aircraft movement; or, when a clockwise rotation of the horizon on the AI, is misinterpreted as a clockwise rotation (right bank) of the aircraft (Roscoe, 1968; Kovalenko, 1991), If these misinteipretations are followed immediately by the correct-appearing (but actually backward) control corrections, then the off-attitude state of the aircraft will be amplified, rather than nulhfied, exacerbating the situation. The results of earUer studies by Roscoe and his colleagues (Beringer, Williges, & Roscoe, 1975; Roscoe & Williges, 1975), and Kovalenko (1991) comparing moving aircraft with moving horizon attitude indicators h^ led to considerable debate about the ideal configuration of this important instrument (Previc & Ercoline, 1999), to conform to the one principle (moving part) or the other (pictorial realism). A review of the literature suggests that the moving aircraft display is more effective than the moving horizon display for novice pilots with no prior experience on eiflier, and is no less effective, even for experienced pilots who have had prior fli^t experience with the moving horizon display (Previc & Ercoline, 1999; Cohen et al, 2001). The advantage of fee moving aircraft will be amplified in IMC (where feere is no true horizon visible), and diminished in VMC (Merryman & Cacioppo, 1997; Gallimore et al, 2000). The overall benefit for a stable horizon may result, in part, from the pilot's reflexive tendency to orient the he^ to fee outside horizon as fee airplane banks (i.e., to visually stabilize fee horizon), a phenomenon called fee opto-Mnetic cervical reflex (OKCR) (Merryman & Cacioppo, 1997; Previc & Ercoline, 1999; Previc, 2000a; Smife et al,, 1997), If fee head rotates counter to fee airplane when fee latter banks, so feat the line connecting fee two eyes parallels the horizon, feen fee eyes will Mutually see a stable horizon as the aiiplane banks, and feose aspects of the airplane 16
F33615-03-M-6360
Multisensory Integration for Pilot Spatial Orientation
that are in the visual field will be seen to rotate; that is, a direct perception will be one of a moving airplane, corresponding to what is seen on a moving airplane AI. While the OKCR is a phenomenon that is primarily manifest in VMC, when the true horizon is visible (Galhmore et al., 2000), the underlying tendency to orient the head to the perceived upright, seen so strongly when the horizon is visible, is also manifest when the horizon is inferred from vestibular feedback in IMC, as manifest in the Leans, discussed in Chapter 11. The role of OKCR in supporting the moving aircraft bank perception, might suggest that this world-referenced frame (moving aircraft) is more pronounced in bank than in pitch, which is the case (Merryman & Cacioppo, 1997; Patterson et al., 1997; Smith et al., 1997). While the debate is not likely to lead to the redesign of the head-down attitude indicator with a moving aircraft, it is possible that that certain design solutions can capture elements of both principles. The concept of a frequency-separated display (Figure 4c) is one such solution, in which rapid (i.e., high frequency) rotation of the aircraft, as when entering a turn, leads to a rotation of the aircraft symbol on the AI in the same direction as the true rotation of the aircraft. Then, after the aircraft stabihzes at the new bank angle and holds this steady state for some time (i.e., low frequency), the AI horizon line gradually rotates to correspond to the true horizon, and the aircraft symbol, in turn, rotates back to an upright position. The reverse control, implemented to bring the aircraft back to straight and level, will reverse this sequence of motion. Another solution is the 3D pathway display, or highway in the sky (HITS) display. This display provides a prediction of the fiiture location of the aircraft, which conforms to the principle of the moving part, even as the attitude indicator itself conforms to the principle of pictorial realism (Fadden, Ververs, & Wickens, 2001; Alexander, Wickens, & Hardy, 2003). That is, a right bank of the aircraft will initiate an immediate rightward movement of the predictor symbol on the display, creating an immediate and intuitive perception of a right turn (i.e., bank), even if the artificial horizon rotates to the left. Roscoe (2002) has argued that such a design may mitigate the concerns for roll reversals. Finally, other research on horizon representation has focused on a moving horizon format, but distributed across a wide range of space in the cockpit, so that it can be perceived not just with focal and foveal vision on a small attitude indicator, but also with ambient vision across a wide range of the visual field, making it more resistant to attentional tunneling, just as we view the normal horizon for orientation information (Previc, 2000a). One means of doing so is thro^xgh laser projection of the so-called Malcomb Horizon, projected in space from behind the pilot (Gawron & Knotts, 1984). Current technological limitations have prevented these from realizing success in flight tests (see Stokes, Wickens, & Kite, 1990 for a review). A second way of accomplishing this has been proposed as a Background Attitude Indicator (Liggett, Reising, & Hartsock, 1999), which presents the horizon spanning across smaller panel displays. Both of these techniques allow perception of the horizon as the head is rotated. A third approach is to present the horizon on a helmet-mounted display (HMD). We consider this issue below in the broader context of presenting overlaid information on either an HMD or a head-up display (HUD).
17
F33615-03-M-6360
Multlsensoty Integration for Pilot Spatial Orientation
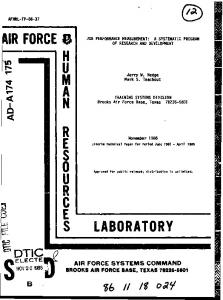
HUDs & helmet-mounted displays The issue of the frame of reference for the attitude indicator on a see-through display (HUD or HMD) adds additional complications. For the HUD, the problems of motion incompatibility between a moving aircraft display, and the moving horizon seen outside will be amplified in VMC, relative to a head-down presentation, because the two different motion jframes will be viewed directly superimposed on each other. For the HMD, which we discuss in some detail, the problem of frame of reference for attitude representation and spatial disorientation become even more complex, when the HMD is used for off-boresight viewing. The design of the HMD (Melzer & Moffitt, 1997; Wickens & Rose, 2001) must consider two general human factors issues, which we shall address below: (1) What is the advantage (or cost) of presenting information on an HMD, rather than on a conventional fixed display? (2) How should the imagery on the HMD be presented? It turns out that the answer to the second question greatly dqjends on both the task and the frame of reference (FOR) with which the imagery is presented, and so we shall focus on three different fi-ames of reference for presenting HMD information. It further turns out that the choice of an HMD to present information (and the choice of a particular FOR), also generates certain spawned costs analogous to those encountered when choosing a 3D (HITS) display. The HMD has two distinct benefits relative to the HUD: (1) Allowing continuous viewing of instrumentation across a wide range of head movements (in particular^ when engaged in off-axis viewing). This potentially allows instant access to attitude information, and can therefore potentially mitigate concerns of attitude awareness. (2) Enabling a much wider range of visual space within which confomial imagery can be displayed, • These two benefits are generally associated with different frames of reference of HMD imagery (Wickens et al., 2001). Specific images (usually non-conformal) which are viewable independently of the orientation of the head, are said to be screen-referenced, since the coordinates upon which those images are drawn, are defined exclusively by X-Y coordinates on the HMD surface. In contrMt, conformal imagery on an HMD is said to be world-referenced, since it overlays distinct positions in the world and its location on the screen will be contingent upon the momentary orientation or movement of the head. World referencing on a see-through HMD creates what is known m augmented reality (Milgram & Colquhoun, 1999). World referencing on an opaque HMD, while not diseased in detail here, can be used to create the virtual cockpit (Barfield & Fumess, 1995), which might be used for fraining purposes, or for flying remotely piloted vehicles, A schematic representation of the view, seen by pilots in a screen-referenced and a world-referenced HMD is shown Figures 5a and 5c, for pilots who are looking to the right and see the indicator of their aircraft in a right bank. In addition to the world- and screen-referenced frames shown in Figure 5, HMDs allow depiction of a thfrd frame of reference - the aircraft, or aircraftreferenced symhology. Here the symbology is drawn at a fixed location relative to the axis of the aircraft. An example would be a set of flight instruments that are depicted to appear at the
18
F33615-03-M-6360
Multisensory Integration for Pilot Spatial Orientation
normal location of the HUD. This view is shown in panel Figure 5b, representing the turning head. While the distinction between these three frames of reference for HMDs is every bit as critical as is the distinction between conformal and non-conformal imagery for HUDs, there are in fact very few studies that have contrasted them, to allow conclusions of "which is better" to be drawn. Taylor and Kuchar (2000) compared screen-referenced to aircraft-referenced symbology for attitude recovery for fighter pilots. Their experiments required pilots to look off axis with the HMD while at an unusual attitude, and, upon hearing an auditory cue, immediately recover to wings-level flight. The investigators found that the airplane-referenced display imposed a delay in recovery, as the pilots needed to return the head to a forward viewing position before initiating the maneuver, whereas with the screen-referenced display, pilots could (and did) initiate their recovery before rotating their head forward. Herdman and colleagues (2000) also compared a screen-referenced HMD with an aircraftreferenced HMD and contrasted these with a mixed display containing both. Their rotorcraft pilots engaged in a forward flying maneuver. In the mixed display, attitude information remained aircraft-referenced, so that it would be conformal with the true horizon when the pilot looked forward, but drop out of sight (like a conformal HUD) when the pilot looked off axis. The investigators found a general advantage for screen-referenced information. In the mixed condition, the presence of both kinds of symbology on a single display, moving differently as the pilot's head rotated, did not appear to disrupt performance, because of the ability of pilots to cognitively separate the two domains on the basis of motion cues. In both of the above experiments, aircraft-referenced attitude information was also configured to be partially conformal with the outside world, in the sense that, when the pilot looks forward and varies attitude, the behavior of the instrument horizon would mimic that of the true horizon, as would be the case of a partially conformal HUD. This raises the question as to whether such conformal but screen-referenced displays (like the AI shown in Figure 5 a) would be disruptive to aircraft control if they are viewed off axis; that is, a contrast between panels (a) and (c) in Figure 5, as these would be used for attitude control. Both panels depict a plane banked to the right; however, the conformal world-referenced horizon symbol shown in Figure 5c depicts the horizon as it would look to a pilot looking outward along the right wing of a right-banked aircraft. Again, there is little data to compare the efficacy of these two frames of reference. Haworth and Seery (1992) compared the two frames, across a range of typical tasks for the rotorcraft pilot in a fiiU mission simulation, while pilots looked off-axis, as they were engaged in search for targets and maintaining awareness of terrain features. They found that neither display was terribly effective for unusual attitude recovery during off-axis viewing with both showing a large number of initial confrol actions in the wrong direction; the world-referenced display showed more errors. In the world-referenced frame (Figure 5c), it is easy to see how vertical movement of the horizon line, signaling a bank change, could be misinterpreted as a pitch change. However, Haworth and Seery (1992) also found that for tasks involving perception of the simulated outside world (e.g., altitude and terrain estimation, contour flight), the world-referenced sjTTibology either supported better performance or was more favorably rated than was the screen-referenced symbology. This makes sense, given the total conformality (scene linking) of
19
F33615-03-M-6360
Multisensory Integration for Pilot Spatial Orientation
the world-referenced attitude with the outside world view, a particular advantage in low-level flight.
(a) Screen-referenced
(b) Aircraft-referenced
(c) Worid-referenced
Figure 5, Four views depicting three different frames of reference on a helmet-mounted display. The an-ow at the top shows the direction of flight and axis of the aircraft. The figures in ttie middle row show ttie orientation of the head and the HMD. The figures on the bottom show the view on the HMD screen of an aircraft banked to the right, (a) Screen-referenced, (b) Aircraft-referenced (two views as the head turns), (c) Worid-referenced. The gray band represents the ground and the white band represents the air. The dividing horizon line would move downward if the pilot returned to a wings-level attitude.
The two slightly contradictory trends (one favoring each frame) observed by Haworth and Seery (1992) are consistent with two emerging fmdings. First, as we described earher, the world referencing of the conformal symbology set may facilitate the division of attention between the instruments and the outside world, eliminating any visual conflict between the two visual sources, and, hke scene linking, serve to better^je the two views (Levy et al., 1998; Fadden et al., 2001). This fusion would not occur as a resuh of the conflicting motion patterns when the screen-referenced symbology is viewed off-axis. Second, there is some evidence that tlie interpretation of displayed motion when viewed off-axis, is easily and automatically mentally transformed to a forward viewing axis, just as the head itself naturally rotates to the canonical forward view relative to the trunk (Wickens et al., 2003; Worringham & Beringer, 1989; Previc, 1998). Hence, a display that presents motion that would be un-transformed when viewed in a forward orientation should be more rapidly and correctly interpreted, consistent vdth the findings of Haworth and Seery (1992) favoring the screen-referenced symbology for attitude recovery, A study by Cohen et al. (2001) is also consistent with the latter conclusion. Although the investigators did not employ a true HMD, they positioned a standard screen-referenced attitude indicator in either a forward view or in a 90-degree off-axis viewing plane, relative to the orientation of the pilot's trunk (and control axis). For both skilled pilots and naive non-pilots Cohen et al. (2001) observed no cost to off-axis viewing in a standard (pitch and roll) tracking task. That is, even when the instrumentation was placed off axis, pilots were able to mentally rotate the frame 20
F33615-03-M-6360
Multisensory Integration for Pilot Spatial Orientation
of reference to a forward view automatically with no cost. This equality across viewing locations was observed independently of whether an inside out (moving horizon) or outside in (moving aircraft) frame was employed. However, the investigators also examined a third attitude indicator, which was a side view display somewhat analogous to the view shown in Figure 5c (although presented as a moving wing and fixed horizon, rather than the moving horizon display shown in Figure 5 c). This depiction corresponds in some respects to the world-referenced attitude indicator examined by Haworth and Seery (1992), in that both depict vertical (rather than rotational) movement on the display, as the pilot views a change in bank while looking 90 degrees off axis. Consistent with Haworth and Seery's finding regarding attitude recovery, Cohen et al. (2001) also observed a cost to this world referencing of attitude, relative to the screen (or aircraft) referencing condition. In contrast to the experiment of Haworth and Seery (1992), this study found no benefit at all for the world-referenced display. But, correspondingly, the pilots in Cohen et al.'s studies (2001) flew entirely in an instrument environment with no outside view, so that there was no source of perceptual conflict with the outside world, and no possible benefit to scene Unking of the outside world in attention division. Such a conflict might otherwise have been observed in a side view, screen-referenced attitude display and indeed this conflict imposed the penalties observed by Haworth and Seery (1992). Display Symbology Attitude displays (head-down, head-up, and helmet-mounted) have symbology to help recognize unusual or undesirable attitudes that usually result from SD (cf, Figure 6). Such symbology should be enhanced based upon the latest research results (Previc & Ercoline, 1999; Meehan, 2001). hi particular, the impact of NVGs is ripe for fiirther research and how to accommodate the visual limitations caused by NVGs (Berkley & Martin, 2000).
^'„»'«.:al y,",'i'1»
Figure 6. Military standard HUD symbology.
Recent research results (e.g., Bainbridge, 1999; ISO, 2002) suggest the development and testing of a display icon that uniquely conveys the existence of an unusual attitude and what to do about it. We propose that this icon conform to characteristics that make it easy to detect, interpret, and act upon without confiision or control reversal errors (CREs). Such a display icon should be a
21
F33615-03-M-6360
Multisensory Integration for Pilot Spatial Orientation
unique simple geometric shape that portray the relevant information in an easily understood format (Bainbridge, 1999). Using the principles espoused by Bainbridge (1999) and our earlier modeling criteria, the icon should portray pitch and bank in a way that makes it clear what the attitude is, and what pilot must do to recover from an unusual attitude. Figure 7 illustrates our concept for an icon to be displayed on head-down display (HDDs), HUDs, or HMDs. Previc's (1998) theory of visual fields suggests that the ideal location is in upper-right quadrant of any display.
Figure 7. Attitude icon: (a) 0° pitch, 0° banlt; (b) 90° nose-up pitch, 0° bank; (c) 0° pitch, 45° right bank; and, (d) 45° nose-up pitch, 45° left bank.
Advances in panoramic HDDs, HUD symbology, and HMDs beg the question of how to best use each of these displays to enhance pilot attitude awareness and to combat SD. Ercoline, a leading SD researcher, has challenged the need for HMD attitude symbology, and suggested a study using 4 experimental objectives: agree on symbology across the services; agree on flight tasks; develop a protocol; and, estabUsh research facilities and staff (Ercoline, 1998). The pomt is that there is not an expert consensus about whether or how to use HMD symbology to prevent SD. Pilots maintain attitude awareness via their visual scan; but, when SD occure, the typical feeling is of a conflict between their vision and somatic senses. It feels like their vision is lying to them. Therefore, relying primarily on visual display cues to recover attitude awareness is probably less effective than using a combination of multisensory displays. Recent research has explored using auditory and t^tile senses to combat SD. This recent research is laudable precisely because SD accident rates have remained constant during the decades when attitude information appeared only on visual displays. Clearly, a new emph^is is needed. We next examine auditory, then tactile countermeasures for SD.
Auditory Countermeasures A key feature highlighted in our previous discussion of visual display coimtermeasures, was the ability of displays to capitalize upon parallel processing, or separate resources, so that, for example, ambient vision could process a peripheral horizon, even as focal vision was involved with other Mpects of visual perception (Wemstein & Wickens, 1992; Previc, 1998), Correspondingly, a long history of research on multiple processing resources (Wickens, 2002), has revealed that the auditory modaUty can process information in parallel with the visual, and therefore the auditory channel should be able to support spatial orientation in an otherwise visually loaded, or visually impaired (e,g,, by nystagmus) environment. In making this suggestion however, it should be borne in mind that the auditory modality is inherently less compatible for providing spatial information, than is the visual (Wickens, Sandry, & Vidulich, 1983).
22
F33615-03-M-6360
Multisensory Integration for Pilot Spatial Orientation
Potentially useful auditory information can be classified into four categories; the first two are discrete/symbolic, and the second two are continuous/analog. (a) Discrete alerts. This describes the standard advantage of the omnidirectional, and intrusive auditory modality for presenting critical warnings. A sharp sound or single carefully chosen word can warn pilots that they may be experiencing SD. (b) Verbal commands. Verbal commands can provide effective corrections about what to do to recover from an SD incident, as the verbal modality is well suited for command displays (Wickens & Hollands, 2000), and there are well-documented successes in aviation for such commands, such as the "climb climb" resolution advisory in TCAS, or the "pull up" command of the Ground Proximity Warning System (see Wickens, 2003 for a review). In both cases, the commanded verbs directly signal an action, and the verbal modality can break into a visually saturated processing stream. It is easy to envision how a simple verbal command of the correction required to pull out of an unwanted attitude could be effective, (e.g., "bank left"), assuming that such a command was offered following the correct inference of aircraft state. (c) Continuous localization. A fairly extensive body of research has established the ability of auditory tones or sounds to convey information as to the location of their source, by mimicking the central and peripheral acoustic effects of the two ears (Nelson et al., 1998; Begault & Pittman, 1996). Such systems typically employ intensity and phase differences between the two dichotically presented sounds, to accurately signal the azimuth of a perceived sound, relative to the momentary orientation of the head. A very naturalistic or "ecological" signal of head orientation relative to the source of sound can be provided, offering good support in airborne target acquisition studies (e.g., Begault & Pittman, 1996; Nelson et al., 1998; Endsley & Rosiles, 1995). However, an unfortunate aspect of such systems is that they are far less accurate in conveying elevation information than azimuth information. Furthermore, spatial disorientation, as we have noted, is attributed to a failure to appreciate which direction is up, rather than which direction is forward. Hence auditory localization is less perfectly suited for orientation than for location. (d) Continuous orientation. To provide a continuous signal of which way is up typically requires some non-naturalistic assignment of head orientation to tone pitch and or intensity. In this regard, effective demonstrations of auditory compensatory tracking have been provided by various researchers (Forbes, 1946; Vinje & Pitkin, 1972; Costello, 1976; see Wickens, 1986 for a review). Typical is the assignment made by Vinje and Pitkui, in which the ear in which a tone was presented represented the side of an error (in this case, an attitude displacement from level), while the pitch of the tone represented the magnitude of the error. Such a system would create an increasing pitch tone, as the aircraft rolls to one side or the other. It has been found fairly effective in supporting continuous compensatory tracking, although greater benefits are often realized when the auditory cues are offered redundantly with visual cues, than in a single task auditory environment.
23
F33615-03-M-6360
Multisensory Integration for Pilot Spatial Orientation
An important feature in designing such systems for SD applications is that the pilot can gain greater information from the time-varying trend of tones and sounds, than from the absolute pitch or intensity levels of such sounds. For example, an increasing pitch (or volume) can signal that things are getting worse. But there is no particular level of pitch (or volume) that can be used to intuitively convey a particular state (e.g., middle C, or 70 decibels corresponds to 45° of bank). A second issue is whether the direction of a tone (e.g., left or right ear) should correspond to the status of error, or the necessary command to correct the error. Will a rising tone in the right ear intuitively signal that the right wing is rising (and therefore the plane is banking to the left), or the converse? Such a mapping of tone to state must be done consistently and intuitively by the pilot, otherwise control reversals will result (as h^ been observed for the visual moving horizon display being confiising, as discussed above). The importance of this intuitive mapping is heightened for the SD apphcation, because the usage of any auditory cuing will be required when the pilot may already be in a stressed state, in which non-intuitive mappings are hkely to be ignored or misinterpreted (Wickens, 1995). In summary, audio tones are good m alerts of undesirable states, and audio commands are effective in directing recoveries from unusual attitudes; but tones are not intuitive for orientation cueing.
Tactile Displays Early research into tactile displays was by Gilson et al. (1975), who described a lever system attached to the confrol yoke. Their goal was to indicate AOA to pilots via a lever that would push into the pilot's hands to indicate which direction the pilot should move the yoke (push or pull) for the optimal AOA during low speed flight phases (i.e., takeoff, approach, landing). Solomonow et al. in 1977 and 1978 examined human sensitivity to vibrotactile displays, the early foreruimers of today's tactile vests. Their goal was to determine appropriate vibration frequency ranges, pulse widths, and body locations for maximum sensitivity and information fransfer. Kaczmarek (2000) examined adaptation and stimulus threshold changes with repeated vibrotactile stimuh. Recent developments include full tactile vests, used to fransfer altitude deviation and attitude information (Rupert, 2000; Raj et al., 2000; McGrath, 2000; RochMs & Newman, 2000; Spence, 2002; van Erp, 2003, Engmeering Acoustics, hic, 2003). Tactile systems are typically used to complement visual or audio displays, not in isolation, because of their lack of comparable sensitivity. Research into this promising display technology is ongoing due to its relative ease of implementation, and early results. In many respects the creation of tactile displays can match applications a, c, and d of auditory displays discussed in tiie previous section, and there is, indeed a fairly close correspondence between the two modaUties. T^tile stimulation can (a) alert (Sklar & Sarter, 1999), it can (c) convey ^imuth location information (for example, a stimulus presented from a belt around the waist), and some sense (d) of orientation (e.g., differential elevation between the left and right sides). Research on tactile channels for orientation however is comiderably more sparse than for auditoiy channels (Rupert, 2000; van Erp, 2003). Both modalities would probably suffer from habituation, and so must be used sparingly and in concert with other sensory inputs.
24
F33615-03-M-6360
Multisensory Integration for Pilot Spatial Orientation
Display Technologies Summary Our previous discussion has focused on visual displays, because of the precise spatial information that these can provide. However both auditory and tactile displays offer potential in combating SD (or maintaining spatial orientation), because of their capability of providing information in parallel with an overloaded visual system (Wickens, 2002). Indeed auditory localization displays have provided useful spatial information in orienting toward targets in 3D space (e.g., Begault & Pittman, 1996; Nelson et al., 1998), as well as in continuous tracking (Vinje & Pitkin, 1972; Forbes, 1946; see Wickens, 1986 for a summary). More recently tactile and haptic displays have been explored for similar purposes (e.g.. Raj, Kass, & Perry, 2000; van Erp, 2003). While it is clear that information fi-om these displays can be processed in parallel with visual processing, thereby potentially exploiting multiple resources, it remains to be seen the extent to which such parallel processing will take place in the high stress and workload of spatial disorientation. New technologies, such as 3D audio and tactile displays can enhance recognition by using nonvisual channels of cognition to "get through to" the unaware pilot. Since SD is often triggered by a disparity between visual and vestibular senses, it is wise to stimulate other senses to aid recognition. Audio is an especially compelling input because it tends to override other senses for attention (Wickens, 2002). In addition to the above, we can also consider verbal auditory information, such as commands to the pilot on how a control should be moved, or what instruments should be consulted, in order to restore spatial orientation. These too are capable of exploiting the multiple perceptual resources of a visually overloaded (or incapacitated) pilot. Visual and tactile display enhancements may be less effective during G-induced SD because of vision tunneling and somatic G-force effects (Rochlis & Newman, 2000). Researchers must also consider how to integrate new display ideas with existing cockpit displays, audio, etc. The goal is to use the "best" sensory cues for the particular SD conditions, if the event characteristics can be confidently established. la conclusion, it would appear that a number of features in both visual and non-visual displays can support the pilots' perception of attitude. For visual displays, many of these capitalize upon ambient vision and the presentation of attitude across a wide range of visual angle. For nonvisual displays, they exploit the multiple sensory resources of the pilot. Given other findings in the research literature supporting the advantage of redundant presentation of information (Wickens & Hollands, 2000), it would appear that offering attitude information through redundant channels could be a valuable tool to restoring spatial orientation. In the following section, we suggest ways in which this might be accomplished.
Intelligent Aiding Systems Intelligent onboard systems that can recognize SD and its causes would provide a huge advantage in the fight against negative SD consequences. Such systems would not only tailor displays to the particular SD event, but could trigger recovery actions, such as synthetic speech to talk the pilot through the appropriate recovery.^ An even more intelligent system could also initiate recovery without jeopardizing the mission by considering such factors as position relative to '" Personal communication with Dr. Kristen Liggett aboiit such an experiment (11/21/02): Audio recovery instructions seemed to be effective and pilots liked it; results not yet published.
25
F33615-03-M-6360
Multisensoty Integration for Pilot Spatial Orientation
enemy airspace, threat warning system inputs, and fire control modes. Triggering an autorecovery without considering mission impact and pilot intent is unacceptable, except in the most extreme circumstances. Auto-recovery exists on the Swedish Grippen in the form of auto-GCAS (Scott, 1999). However, US pilots distrust auto-recovery systems due to potential errors and the possibility of adversely affecting the mission." Because of the drawbacks of a fully automated system, a pilot-activated system could be an interim step. However, a pilot-activated recovery system would not be effective for Types 1 or 3 SD, by definition. Manual activation would be effective for Type 2 SD events and so should be a part of the layered solution, at least until its efficacy can be proved or disproved. Extensive research has been done on aircraft state, pilot intent, and hazard monitoring intelligent systems.'^ Such systems would be relatively easier to implement for civiHan than for military aircraft, and so can be developed, tested, and certified in the more benign civil environment m a prelude to military systems, if warranted. Most importantly, an intelligent cockpit system would trigger the SD countermeasure(s) determined to be most effective in any given situation. Due to the likelihood of sensory overlo^, an inteUigent SD Aiding System would apply multisensory countermeasures for redundancy, urgency, and for improving the odds of "getting tiirough" to the pilot. We have akeady discussed visual, auditory, and tactile displays; one other sensory channel remains: olfactory. An intelligent system could trigger a unique harmless odor (similar to a unique audio tone) that means, "Spatial Disorientation strongly suspected; check your instruments!" For incapacitated or unconscious pilots (Type 3 SD), an odor similar to smelling salts could help the pilot regain consciousness and control.
Post-Flight Analyses All the old and new technologies to combat SD incidents have uncertain effectiveness, unless a thorough data gathering and analysis effort is begun. The goal should be to better understand and char^terize SD events, and to determine the efficacy of the various SD mitigation tools. Only withpost hoc (post SD event) analyses will researchers have an objective method to assess the most effective SO enhancing, or SD prevention and recovery techniques devised by researchers (Lyons et al., 1993). Also, an operational analysis system provides the feedback and statistics needed to validate laboratory research results. And, data analyses provide an objective foundation for developing and testing human performance models, such as the multisensory models described in the next chapter. Recent post-flight data analysis efforts in worldwide commercial aviation have paid huge dividends in underetanding the impact of changes to such key flight safety components m airplane systems, pilot training, air traffic control procedures, and airport conditions. The US Air Force has recently begun such a fU^t data monitoring program for its C-17s. The value of regular consistent objective feedback is enormous, as global aviation data analysis and sharing programs attest.*^ An analogous effort for SD research is absolutely vital. " Personal communication with Dr. Kristen Liggett about auto-recovery systems (11/21/02). " C.f., Pilot's Associate, Rotorcraft Pilot's Associate, French Electronic Copilot, German Coc^it Assistant. " Such programs are known as FOQA and MFOQA in liie US, and FDM in Europe and Asia. The global aviation data shaiing program is GAIN (see www.gainweb.org). 26
F33615-03-M-6360
Multisensory Integration for Pilot Spatial Orientation
Conclusion There are many known SD illusions and causes. How to best combat each one is the challenge of attitude awareness and SD research. The best solution is to blend all of the known helpful training, technologies, and techniques, and to tailor each to the particular SD circumstances. Researchers are investigating a wide variety of technologies. Visual components include headdown, head-up, and helmet-mounted displays. Audio components include 3D audio tones and verbal recovery guidance. Tactile components include vibrating vests. Olfactory cues might be useful when the pilot's other senses are overloaded, or when he or she is incapacitated. Training includes classroom lectures, centrifuge demonstrations, and practice flights. Post-flight data analyses "close the loop" in the research approach by providing feedback about which techniques are the most effective. The anticipated benefits of this research and development are to help pilots maintain spatial orientation in flight, or, when orientation degrades, to recognize and recover firom spatially disorienting situations, thus preventing SD's negative consequences. The cost impact of SD on the US miUtary is over $300 million per year, not counting lives lost. US civihan losses are comparable. Devising a layered approach to even incrementally improve the situation has a multi-milUon dollar per year potential benefit.
27
F33615-03-M-6360
Multisensory Integration for Pilot Spatial Orientation
IV. Modeling The goal of modeling attitude awareness, spatial disorientation, and multisensory workload is to provide a framework for assessing or inferring, in real time, the pilot's level of awareness of the current aircraft orientation, and then, based upon this assessment, implementing an appropriate set of interventions to counter any assessed spatial disorientation events, and their consequences. We first characterize the pilot's internal state of SD, and then discuss the objective measures that are necessary to infer that state from external variables. Lastly, we introduce and explain a multisensory enhancement to Wickens' Multiple Resource Theory (MRT) - something we call "SAWOY."
Terminology & Formulas 1. Explicit meaning of attitude awareness: Accurate knowledge of momentary Attitude (A) relative to the earth's frame of reference (vertical). As discussed in Chapter 1 of this report, the focus on attitude is directed because the failure of attitude awareness appears to be responsible for nearly all SD events. Loss of attitude awareness leads to a stall condition, rapid descent, or unwanted tums, both of the latter leading to undesirable frajectories (the latter, in turn can lead to geographical disorientation - a separate issue, not modeled here). For purposes of modeling, we define attitude as a vector quantity composed of pitch (P) and bank(B). 2, Computational expression of the loss of attitude awareness*, i.e„ spatial disorientation (SD): Ideally, we would like to have a bounded expression of SD varying between 0 and 1 (or possibly between -1 and +1; see below). This makes calculations more tractable. For a pilot with perfect attitude awareness, SD = 0, and therefore perceived attitude (Ap) = true attitude (At). Given this expression, tiien, the loss of attitude awareness (onset of SD) can be expressed in two distinct ways, each with different implications: (1) SD = Vai^Ap)/90. This impMes that the loss of attitude awareness is related to the variance in (uncertainty of) the momentary attitude, scaled by a maximum value of 90 degrees. Thus a pilot who has absolutely no idea of which way is up, would have SD = 1.0 (this assumes that the variance of a rectangular distribution ranging from 0-180 is 90). We abbreviate the first foimula as VAP. In essence, this is a confidence me^ure. Pilots in a Type n SD event know that tfaey are disoriented. That is, they are aware that they have little or no confidence in which direction the true vertical is. Having no confidence yields SD = 1 for this formula. (2) SD = (|Ap-At|)/180. This implies that the loss of attitude awareness is a direct measure of how much the perceived attitude departs from the true attitude. It suggests that an illusion has caused a firm behef in an incorrect attitude. Here SD > 0 is a firm belief that something other than vertical is the upright (and SD = 1, for example, is a behef that you are flying right-side up, when you are inverted, or vice versa). We abbreviate formula 2 by DA (Ditterence in Attitude). In control with formula 1 (VAP), there is no single positive (incorrect) belief ^sociated with SD > 0, So, for example, pilots experiencing the Leans typically beUeve that they are certain where the true vertical is, but they are wrong. If they feel they are level when in fact they are banked 90 degrees, then SD = 0.5 for this formula. 28
Multisensory Integration for Pilot Spatial Orientation
F33615-03-M-6360
It seems apparent that VAP is associated with Type 2 (recognized) SD, and DA is associated with Type 1 SD. That is, if pilots do not know that they are disoriented, they will probably hold a strong belief that something other than the true vertical, is the perceived vertical (large DA). Knowledge that they are disoriented however might simply throw the pilots into a state of confusion typified by high VAP. There are two ways of thinking about DA > 0. As the formula states, it is directly proportional to the deviation of perceived attitude fi^om true attitude, so that an SD of 0.5 (e.g., pilots assume they are level, when they are banked 90 degrees) is half as bad as an SD of 1.0 (e.g., pilots assume that they are level, when in fact they are inverted). This measure does not then distinguish the degree of certainty in the incorrect attitude. It would seem that a pilot who is certain of a 90-degree offset (DA == 0.5), has greater SD than one who believes (but is uncertain) that he or she may be at a 180-degree offset fi-om the true attitude (calculated DA = 1.0). This greater uncertainty is reflected in a higher VAP. Thus we can combine the two concepts VAP and DA (Figure 8), such that larger penalties are applied for smaller VAPs at larger DA (i.e., "strong but wrong" is worse than "weak but wrong").
Worst Case
>^^---^~__^ / \
i/ /^ n/^
0
1
1
/^
xy
Severity of Loss
,^——^"^
MN?
1^
Figure 8. Variance of perceived attitude (VAP), and the difference (DA) between perceived attitude (Ap) and true attitude (At) in relation to the loss of attitude awareness (or onset of SD).
Finally, we recall that A, the vector, is composed of? and B. It may be that Pp and Bp (perceived pitch and bank) are perfectly correlated across all illusions and distortions, but indeed this is probably not the case. For example, the somatogravic illusion in which acceleration leads to perceived pitch up (or deceleration leads to perceived pitch down) certainly affects Pp, but not Bp. The Leans as a precursor to the graveyard spin, effects Bp initially, but not Pp. Hence an open issue is whether to compute a single vector of Attitude, or to break it into its components of P and B. In the latter case, SD scales from 0 to 2. Our discussion above has focused on the actual state of SD, which exists within the mind of the
pilot. An inteUigent SD Aiding system will not have direct access to that state, but must infer it on the basis of available, measurable signals, which may be combined computationally. We consider this computation as follows:
29
F33615-03-M-6360
Multisensory Integration for Pilot Spatial Orientation
3, Computational basis of SD: It is feasible to think of SD = 0 (or attitude awareness = 1) as defined by a state in which the pilot, in VMC, is giving Ml attention to the visual horizon, which always (except at very high altitudes) provides an accurate representation of the vertical. As such, fi-om this state, there are a series of factors that can drive SD upward, some of which have a quantitative basis in prior validating modeling efforts. Among these are: 3.1 Reduced quality of visual input. Use of the attitude indicator (e.g., at night or in MC), requires focal and foveal vision, which is less effective in providing intuitive ambient attitude information (Previc, 1998), As the AI is diminished in size, or more ambiguous about what is represented by the moving element (Roscoe, 1968), the quality of correct attitude information is reduced. As the ambient quality of this information is improved, for example by use of a Malcomb horizon, or background AI (Liggett et al., 1999), the contributions of the AI improve to approach that of the true horizon (SO = 1, SD = 0). 3.2 Reduction of attention to true liorizon. There are a variety of computational models that can characterize the loss of precision of spatial estimation associated with attention divereion. Most appropriate may be the optimal control model of Levison and colleagues (1971) that ^sociates an increase in variance of a perceived quantity, ^ to be invereely proportional to the diversion of attention. As such this can be represented as a contribution of attention diversion to VAP (VAP = 1 - attn, where "attn" is modeled as the proportion of attention allocated to attitude information; often measured by scanning (Wickens et al., 2003), This formula does not distinguish where attention is diverted to, and could equally describe attention diverted to an auditory channel, ^ to a visual source in the cockpit (other than the AI), For attention diverted to other visual channels, scanning measures could be used (Wickens et al, 2003). For attention diverted to auditory channels, inferences must be made (e.g., the duration of diversion is related to the length of an auditory communication in the cockpit, to which the pilot responds). It is also possible to construct the model such that the diversion of attention away from either the true horizon, or the attitude indicator, will not only increase the variance of perceived attitude (VAP), but also provide an opportunity for attentional capture by the insidious vestibular system, to the extent that the latter provides erroneous cues. This, in turn, would create an opporhmity for DA. The advantage of tiiis approach is that the mislealing signals provided by the vestibular system can be directly calculated (and therefore are amenable to computational modeling), given tiie known properties of the otoliths and semi-circular canals to provide false information during periods of sustained acceleratiom. The amount of such signals can range from slight (e.g., tiie Leans, in a sustamed tum) to large (CorioUs). Finally while some otiier channels of information may degrade attitude awareness by disfraction, other artificial channels can restore attitude awareness, even if they direct attention away from the valid horizon sources of correct attitude information. Such artificial channels, as we have previously noted, would include auditory stimulation, voice commands, and tactile sensors. In summary: • Attitude awareness can be modeled with a "gold standard" of Ap = At in VMC.
30
F33615-03-M-6360
•
• •
Multisensory Integration for Pilot Spatial Orientation
Degradation from this state (that is, SD) can be modeled by reduced quahty attitude information within the cockpit, diversion of attention away from attitude sources, and direction of attention toward the vestibular system at times of accelerated flight. Attention away is captured by the measure VAP and there are quantitative models existing to describe this. The cost of attention directed toward the vestibular inputs can be calculated by physical formula related to the effects of sustained acceleration on the otoliths and semi-circular canals, which yield misleading signals. The latter constitutes a separate, independent module of the computational model, and can be used to predict DA.
Simulation experiments in Phase II will be designed to assess the extent to which the degree of SD actually experienced by pilots will correlate with the predicted variables described above. A final property of any computational model to be used in implementing countermeasures is the model's own assessment of self-confidence in its assessment of SD state. One can envision two scenarios, both with the same assessment of SD level (e.g., VAP = 0.9), but one assessment reached on the basis of a number of very rehable information channels, and the other reached on the basis of a small number of imreUable sources. An intelligent system should be considerably more cautious in intervening aggressively (e.g., taking control of the aircraft) in the latter case than in the former. Where possible, our approach provides some measure of the confidence in the SD assessment. Because attention mismanagement (i.e., distraction) is a key component in many SD mishaps and because it is important to consider in the above formulas (VAP and DA), we now turn to modeling the pilot's attention in the form of a multisensory workload measure, SAVVOY, that expands upon Wickens' Multiple Resource Theory.
Expanding upon MRT Wickens' multiple resource theory (MRT) says to use the maximum number of different sensory resources/channels to "get through" any distractions. Since our goal is a multisensory approach to combating SD and since Wickens' MRT focuses on visual and auditory channels, we have expanded MRT to include somatic, vestibular, and olfactory senses. The resulting workload model, which we call S AWOY (somatic, auditory, visual, vestibular, olfactory, psychomotorprimary, psychomotor-secondary, and cognitive), is useful for helping our SD Aiding System (detailed in Chapter VI) determine which countermeasure(s) to apply under varying conditions. For example, if the pilot is in a high G maneuver, tactile cues are less likely to be detected by the pilot due to "high somatic workload." Similarly, if the pilot is talking on the radio or to a backseater, audio cues may be ineffective due to high audio workload. During our demonstration scenarios, we model the hypothetical pilot workload in all the SAWOY channels and use that information to influence the countermeasures presented by our SD Aiding System.
31
Multlsensory Integration for Pilot Spatial Orientation
F33615-03-M-6360
SD Assessment Models To this point, this chapter has presented the detailed theoretical b^is for modeling SD and attitude awareness based on the research in the SD literature. The remainder of this chapter is devoted to the actual SD modeling done for the Phase I demonstration. Two models of SD were developed to detect the occurrence of the Leans and Coriolis illusions - one model for each illusion. Each of the models is b^ed on its description from Chapter H. They each use observable data from the aircraft and pilot to assess the state of the vestibular system relative to the actual attitude of the aircraft. Model of Leans The model of the Leans is expressed as a timed sequence of events with the certainty of the assessment of the disorientation incre^ing with each successive event as shown in Figure 9. The first event is the mitiation of a roll at a rate below the vestibular threshold (Mulder's constant of 2°/sec), The second event is a roll angle of greater than 5 degrees that lasts longer than 5 seconds. If these two events occur in sequence, it is possible that the pilot has not noticed the ensuing roll angle and that there is a difference between the pilot's perceived attitude (Ap) and the true attitude (At) of the aircraft. As such, the model indicates a possibility of SD but only at a very low confidence level. The third event is the loss of altitude as measured by negative vertical velocity. If this event follows the first two, it is possible that the pilot has also not noticed the loss of aJtitude and the model represents an increased confidence in its assessment of the Leans (shown as incre^ing certainty of SD in Figure 9). The fourth event is a roll well above the vestibular threshold (i.e., greater than 5°/sec and with sufficient duration) in the opposite direction fi-om that of the firet event. If this occurs following the first three events, it is possible that the pilot has now noticed the roll angle and has quickly corrected back toward level. When this occurs, the pilot's vestibular system will register a roll in the opposite direction, again resulting in a difference between the perceived attitude (Ap) and the actual attitude (At) of the akcraft. At this point the model represents a high level of SD certainty. The final event in the model is the tilt of the pilot's head opposite the perceived roll angle. If this occurs following the other four events, it is likely that the pilot is experiencing the Leans and the model represents an even higher level of SD certainty. (1)r*'^UixlateRight Stale (2) ^^—-"--——»/ Enci Scenario B;
V^
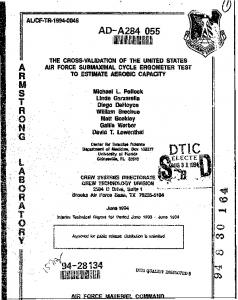
Figure 13. Micro Saint model.
Node 2 also advances the simulation clock by the amount of the duration of the data event. Along with the flight and pilot data, the value of the simulation clock is sent to the State Table, which fimctions as the SD Aiding System's clock. The State Assessor uses this clock to determine the timed sequence of events for assessing SD (for example, Figure 9 in Chapter IV). For the Phase I demonsfration, the simulation was used in a deterministic mode in which the time periods and state values for each event did not vary across different model executions. This allowed us to repeatedly simulate exactly the same disorientation sequence in order to evaluate the proper execution of the rest of the SD Aiding System. The simulation could also be executed stochastically such that the time and state values would vary randomly within some distribution. This would allow the model to represent variations to the original scenarios to help determine the sensitivity and accuracy of our SD illusion models. The Micro Saint Sharp model also includes workload score calculations. These workload scores are stored in the State Table and used by the Coxmtermeasure Assessor to determine the potential effectiveness of different compensatory actions in a specific SD situation. We derive our workload assessment from Wickens' Multiple Resource Theory, and add other sensory channels to Wickens' visual, auditory, and psychomotor set. The resulting set, which we call SAWOY, represents somatic, auditory, visual, vestibular, olfactory, and psychomotor workload scores For psychomotor, we have primary and secondary observable actions. Primary actions are the pilot's flight confrol actions. Secondary actions are everything else (such as pushing buttons or turning knobs). We also infer cognitive cffuit tu cumplcto the model of pilot workload.
41
Multisensory Integration for Pilot Spatial Orientation
F33615-03-M-6360
Assessors Once the State Table is filled, the SD Aiding System uses this information to determine the extent to which the pilot is experiencing spatial disorientation and the best way to help the pilot recover. The assessors, which are part of the State Table, do the first part of this task. They determine the extent to which the pilot is spatially disoriented and the risk surrounding the current situation. These different assessors within the State Table will be referred to as the State Assessor in the rest of this description of the SD Aiding System prototype. The Counterme^ure Assessor determmes the appropriate compensatory actions, based on the outputs of the State Assessor. As mentioned earlier, the SD Aiding System's architecture relies upon a newly developed software product. Micro Saint Sharp: This software has two features tiiat the SD Aiding System uses. The first feature was previously introduced in the State Table subsection; it is a base plugin interface that is used for transferring data fi-om tiie Micro Saint Sharp model to other modules of the SD Aiding System. The second feature is a Micro Saint Sharp wrapper class that allows for the rapid prototyping of C# software. The Micro Saint Sharp wrapper supports having all the SD Aiding System components in one piece of software, including the pilot/aircraft; model (Figure 14). Micro Saint Sharp Wrapper
Stilt Table & Assessors
Pilot/Planc/WorW Model
Couiitcrmeasure Assessor
Displays
-A
J
Figure 14. ^chltecture ttiat uses Micro Saint Sharp for model(s).
State Assessor The State Assessor's primary t^k is to detect an SD situation by monitoring the current states of tiie pilot, aircraft, and world via the data in the State Table. There are three functions that work together to estimate the pilot's spatial disorientation and the severity of the situation (Figure 15): one for the pilot, one for the aircraft, and one for the world. SD Assessor
The firet function is the SD Assessor, which monitors the pilot's vestibular system relative to the aircraft attitude using the SD models of Leans and CorioKs. Its primary goal is to estimate if flie pilot has become spatially disoriented, what type of illusion he or she may be experiencing, and the severity of tiie illusion. This is based on how the pilot's vestibular system reacts to the aircraft's aiigultti Buuclorations aiid tho pilot's hood movomento.
42
Multisensory Integration for Pilot Spatial Orientation
F33615-03-M-6360
Sla(c Assessor Bunk, Head Pontion
>
SI) Assessoi: SD Sevcrify & Type Vestibulai- System Attention Manajtement
t>
Aircraft Assessor Contto! Attitude Iiiipai t Time
Attitude, Vertical Speed
C>
Time of Day, Weather
World Assessor
Visibility
SD State
Figure 15. State Assessor. The SD Assessor is executed each time the State Table is updated with new data about the state of the aircraft or the pilot. For the two demonstration scenarios (Chapter V), this can be as frequently as 8 times per second of simulation time. The Leans and Coriohs models are coded as a series of if-then statements and flags used to determine if the progressing state of the aircraft and pilot match the SD trigger events from the models. As described previously, we use the Mulder's constant to determine, for each data event, if the maneuvers of the aircraft have exceeded the vestibular threshold for pitch and roll (we ignore yaw, for now). Both models in the SD assessor use this calculation when evaluating the state of the vestibular system. Leans Assessor Since the Leans model is based on a sequence of SD friggering events, the code must keep track of which events have occurred within the sequence, hi addition, it must determine if trigger events that have already occurred are still valid. Each time the State Table is updated, the Leans Assessor begins by looking for a roll rate that the vestibular system does not notice based on the rate and diu-ation being below Mulder's constant. For the next State Table update, it first checks that any maneuvers have exceeded Mulder's constant. If Mulder's constant is exceeded (i.e., the motion is detected), the Leans Assessor resets the first trigger and starts over again. But, if Mulder's is still not exceeded, the Leans Assessor then looks for a roll angle of greater than 5 degrees. As the scenario continues, if the pilot's vestibular system is still not reacting based on the Mulder's calculation and the roll angle stays at greater than 5 degrees for greater than 5 seconds, the assessor will determine that a Leans SD has begun and will tell the rest of the system that a Leans is occurring with a low level of confidence. If these conditions continue, the assessor will check to see if tiie aircraft is losing altitude. If it is, then the assessor will increase the confidence level to medium. If these conditions continue, the assessor will look for a roll rate above the threshold of the vestibular system based on the Mulder's calculation. If this occurs, the assessor will increase the SD confidence level to high. Finally, if all these conditions have occurred in sequence and the pilot's head position deviates in the opposite direction from the roll back, the SD confidence level is increased to very high. The second SD trigger event requires that a roll of greater than 5 degrees be held for greater than 5 seconds. During the evaluation of the demonsfration scenario, it is quite common for the 5degree roll event to begin but not last the required 5 seconds before reducing to less than 5
43
Multisensory Integration for Pilot Spatial Orientation
F33615-03-M-6360
degrees. When this occurs, the assessor again determines if the first event was still valid and for the initiation of the second event. In this manner, the Leans Assessor keeps constant track of the state of the aircraft and pilot relative to the Leans model event sequence. Coriolis Assessor
The coding for the Coriohs Assessor is simpler than the Leans because the Coriohs Model requires only a simultaneous combination of two events. Each time the State Table is updated, the assessor checks to see if the Mulder's constant has been exceeded in any of the three planes (yaw, pitch or roll) and if the pilot's head is turned greater than 30 degrees in either of the other two planes, (hi the current prototype, we ignored yaw due to the lack of yaw data.) If these two events occur simultaneously, the Coriohs Assessor determines that an SD may be occurring and sets the confidence level at medium. For example, if the aircraft is changing pitch fast enough to exceed the Mulder's constant for pitch and the pilot's head is turned greater than 30 degrees in the roll plane, the assessor would determine that the pilot could begin to encounter the effects of the Coriolis Illusion. Unlike the Leans Assessor, the Coriohs Assessor does not keep track of any previous events or check if other events are occurring. Table 7 summarizes the previous two paragraphs. Table 7. State Assessor outputs. Data Type Units Range 0,1,2,3 0,1,2 .0,1,2,3,4,5,6,7,8, 9
Parameter Confidence level Illusion type Trigger event
Comments None, Low, Moderate, High None, Leans, Coriolis None, Sub-threshold Roll Rate, Roll Greater than 5 degrees. Loss of Altitude, Sudden Reverse Correction, Reverse Neck Rotation, Head Roll or Yaw, Head Pitch or Yaw, Head Roll or Pitch
When an SD event has been detected, the system must determine the severity of the pilot's situation (Figure 16), The importance of SD severity can be seen in the SD remediation network. This network impHes fliat an increasing severity of SD warrants an mcreasing level of aiding. This is where the other components of the State Assessor become important.
SD possible
Defining conditions: - Aircraft state - External conditions - Pilot state
Defining condiUons: - Aircraft state - External conditions - Pilot state
Defining conditions: - Aircralt state - External conditions - Pilot state
Types of aiding
Types of aiding
Types of aiding
Recovery
^,~- . " det^S*
""^'^ Onset Situattoiw -—#EvolvWg Situations r—t^Crltlca) Situations "*-^£r5Sed
Increasing severity of SD Figure 16, SD remediation network.
44
Multisensory Integration for Pilot Spatial Orientation
F33615-03-M-6360
Aircraft Assessor & World Assessor The Aircraft and World Assessors help the State Assessor estimate the severity of the pilot's situation by analyzing aircraft and world state data. SD events can be divided into three primary levels of severity, where each level infers the goal of the SD Aiding System. These levels are: • Onset situations: Emphasis on prevention (Figure 17) • Evolving situations: Emphasis on helping pilot recognize and recover (Figure 18) • Critical situations: Emphasis on recovery (Figure 19) Types of Aiding: - Normal displays (HDD, HUD, HMD, low tactile) - No audio, olfactory displays
Types of Aiding: - Enhanced displays (HDD, HUD, HMD, low tactile) - Low audio - No olfactory display
.^-^ ://;/-•:/»
Types of Aiding: - Enhanced displays (HDD, HUD, HMD) - Medium tactile - Low audio - No olfactory display
,'//'■
y///-
,^"-
' / ■:■' X
•/K
♦■
Horizon Gone
-* Obscured Horizon
Good Horizon
Defining States; - Aircraft: controlled flight - External: fair visibility - Pilot: no problems
Defining States; - Aircraft: controlled flight - External: good visibility - Pilot: no problems
Defining States; - Aircraft: controlled flight - External: poor visibility ' Pjiot' possibly distracted
Figure 17. SD Onset remediation network.
The State Assessor monitors for situations that fit into the second and third levels, Evolving (Figure 18) and Critical situations (Figure 19). Types of Aiding: - Enhanced displays (HDD, HUD, HMD) - Medium tactile - Medium audio - No olfactory display
Types of Aiding: - SD icons on displays - High tactile - Medium audio - No olfactory display
Types of Aiding: - SD icons on displays - High tactile - High audio - No olfactory display
/ Erraiii; Control
SD Trigger Event /-
Defining States: - Aircraft: SD-inducing maneuver (slow roll, rapid pitch, etc.) - External: no combat reason - Pilot: SD-inducing head position
Defining States: - Aircraft: erratic attitude - External: no combat reason - Pilot: erratic inputs
Unusual Attitude
Defining States: - Aircraft: Initial unusual attitude - External: no combat reason - Pilot: stressed
Figure 18. SD Evolving remediation network.
45
Multlsensory Integration for Pilot Spatial Orientation
F33615-03-M-6360
The Aircraft Assessor monitors the aircraft's state. Its primary goal is to estimate the situation's current risk based on the aircraft's acceleration and position. For instance, the pilot is in a more severe situation if the aircraft is in an unusual attitude and about to crash (Figure 19), and this assessor monitors the aircraft's time until impact with the terrain. The less time the pilot has to recognize and recover from SD, the more intrusive the countermeasures must be. Types of Aiding: - SD icons on displays - High tactile ^ - Olfactory display - Audio recovery commands - Auto-recovery, if commanded
Types of Aiding: - SD Icons on displays - High tactile - High audio - Olfactory display
Impending Crash
Unusual Attitude
Defining States: - Aircraft: unusual attitude with significant airspeed loss or gain - External: no combat reason - Pilot: significant stress
Defining States: - Aircraft: at flight envelope limit - External: no combat reason - Pilot: "Help!" "Recover!"
Types of Aiding: - SD Icons on displays - High tactile - Olfactory display - Audio recovery commands - Auto-recovery - Auto-eJection, if authorized
Inimtaent Crash
Defining States: - Aircraft: imminent ground impact or departure from controlled flight - External: no combat reason - Pilot: incapacitated
Figure 19. SD Critical remediation network.
The World Assessor monitors the external world's state, hi particular, it is concerned with factors that contribute to or increase the pilot's vubierability to SD, These factors include visibility (is the horizon visible?), and the presence of enemy threats. One example is that pilots are more susceptible to SD if they cannot see the real horizon. Another example is that we may suspend countermeasure actions if the pilot is jinking to avoid an enemy missile. These tj^es of calculations are difficult to do, because the required parameters are hard to measure with the technology that is currently available in an aircraft. We do not perform calculations in the prototype tiiat we are not able to do with data provided by a real simulator or aircraft. Consequently, the analyses that occur in this portion of State Assessor are conservative. These concepts are included in our design to ensure completeness.
Countermeasure Assessor The Counterme^ure Assessor uses the SD type and level from the State Assessor to determine what type of cues are appropriate countermeasures. It also uses workload levels (i,e,, SAWOY scores) from the State Table to determine the predicted effectiveness of each countermeasure. Once the Counterme^ure Assessor h^ selected appropriate coimtermeasures for &e SD situation, it sends this information to tiie (simulated) aircraft displays. It also stores which countermeasures it is using in the State Table, so that tiie State Assessor knows which pilot resources are
46
Multisensory Integration for Pilot Spatial Orientation
F33615-03-M-6360
being loaded. The following table contains the type of countermeasures the assessor could select to help the pilot recover from an SD event. Table 8. Countermeasure Assessor outputs.
Aid Outputs Parameter Display status SD icon Audio (spatial) Audio recovery Tactile Olfactory Auto-recovery Auto-ejection
■ Range normal, enhanced Oorl low, mediirai, high Oorl low, medium, high Oorl Oorl Oorl
■.:: Units-:,:'
Data Type
Comments displayed or not volume active or not tactor frequency and amplitude active or not active or not active or not
If the State Assessor detects a change in the current SD event, it alerts the Countermeasure Assessor of this change. For instance, if the State Assessor estimates that the pilot has fully recovered from the SD event, it passes this information to the Countermeasure Assessor. Upon receiving this information, the Countermeasure Assessor terminates the various countermeasures it initiated. The State Assessor also informs the Countermeasure Assessor when the SDsiluation has either decreased or increased in severity, so that the countermeasures can be changed accordingly.
Countermeasures The prototype's Countermeasures represent technologies currently available in a cockpit, such as helmet-mounted displays (HMDs), as well as new technologies, such as tactile vests. The Countermeasures are represented in a simphfied cockpit image (Figure 20) for proof-of-concept demonstration purposes.
SD Aiding System: Class Arctiitecture SDApplication: This is a class that inherits from the Micro Saint Sharp wrapper form class. Micro Saint Sharp models can be opened and executed in it. This class/form ftinctions as an executive that opens and executes all the components of the SD Aiding System via a graphical interface. This includes opening the Micro Saint Sharp model of the pilot, airplane, and world. StateStoragePlugin: This is a class that inherits from IPlugin interface. This is used by the Micro Saint Sharp model to set members of the StateTable class. StateTable: This class provides access to the raw and derived data for the pilot, aircraft, and world. It has pubUc instances of the following classes: PilotTable, AircraftTable, WorldTable, and CountermeasureTable. It is accessible by the Micro Saint Sharp model (via StateStoragePlugin) and the CountermeasureAssessor class. The methods used to determme if a pilot is spatially disorientated, AssessSDLeans and AssessSDCoriolis, are part of this class. When an assessor determines that the pilot's SD state has changed (i.e., the pilot has
47
Multlsensory Integration for Pilot Spatial Orientation
F33615-03-M-6360
become spatially disoriented, or SD has decreased or increased, or the pilot is no longer spatially disoriented), it triggere an event that is monitored by the CountermeasureAssessor class. For each triggered event, the CountermeasureAssessor determines the appropriate coimtermeMures to apply based upon the logic illustrated in Figures 17-19. s 0 «-, ,,-, X..™.-X B» (*• SK« VA
£»s-Jli«r
'fr: :"xysjn*'/r~:." "TSSS ' »*
// , , Vf/T./''. ■
xiT ' AiK^^SpK
Figure 20. Demonstration screen (F-15E front cockpit) with output 'buttons' for multlsensory channels (left column) and assessor outputs (right column)
PUotTable: This class contains the raw data, data calculations, and derived data for the pilot, plus pilot state Msessor fimctioim, which assess the pilot's workload level (SAWOY scores) and current head position. AircraftTable: This class contains the raw data, data calculations, and derived data for the aircraft, plus an aircraft state assessor fimction, which assesses the aircraft's state (i.e. erratic control, unusual attitude, etc.).
48
F33615-03-M-6360
Multisensory Integration for Pilot Spatial Orientation
WorldTable: This class contains the raw data, data calculations, and derived data for the worid, plus a worid state assessor function, which assesses the world's state (i.e. visibility level, combat, etc.) CountermeasureAssessor: This class determines the best countermeasures to apply based on input from an instance of ~ the StateTable class. It also uses pilot workload data (SAWOY scores) from StateTable to determine which countermeasures might not be detected due to overload in a particular channel or channels. For example, if the pilot is talking on the radio, then audio cues might be less effective than other sensory cues (e.g., visual, tactile). CountermeasureDisplays: This class uses the outputs of the CountermeasureAssessor to make the appropriate changes to the SD Aiding System prototype's displays (the colimin of square buttons in Figure 20).
Conclusion Our SD Aiding System builds upon prior intelligent cockpit systems, so we have confidence that the design is robust and suitable for a range of apphcations, including, obviously, spatial disorientation. Our demonstration, which includes the two scenarios described in Chapter V plus a scenario based upon actual data obtained from the Air Force Safety Center proves the feasibility of our model-based concept and approach. The demonstration has been cleared for public release and is available on CD. Interested readers should contact the primary author for a copy of the demonsfration, which executes on Windows NT, 2000, and XP, and requires no other software to run.
49
F33615-03-M-6360
Multisensory Integration for Pilot Spatial Orientation
VII, Major Phase i Accomplishments For this Phase ISBIR, MA&D accomplished the following major objectives: • We performed a literature search, including Russian literature, which formed the foundation of our quantitative, model-based approach. An annotated bibhography is Chapter IX, and is hopefiilly usefiil to other spatial orientation and disorientation researchers. • We designed and developed models for the Leans and CorioUs illusions. The Leans model worked with the actual F-16 data we received from the Air Force Safety Center (AFSC) within the last weeks of this project's technical work. We are especially dehghted that our SD Aiding system is robust enough to work with this data set in a sensible, reahstic manner. (For the actual SD flight data, given to us by AFSC, we took the raw data parameters that we needed, and added small random numbers for other parameters not found in that data set. Then, we ran the data through our SD Aiding System looking for a Leans-like event. We did not try our CorioHs model on the actual data because we did not have pilot head position data. Even without head position data, cair Leans model worked because the 5* step (Figure 9), a head tilt, only mcreases our confidence level; it is not required for a Leans assessment.) • We enhanced Wickens' (1984) Multiple Resource Theory to account for the other senses critical to this effort. We called the resulting'1heory"SAWOY in honor of Dr. Wickens' location in Savoy, Illinois (at the University of Illinois' Aviation Research Laboratory), The newly included senses are somatic, vestibular, and olfactory. A model of pilot workload, using hypothetical (but reahstic) SAWOY scores, mfluenced the SD counterme^ures applied by our SD Aiding System. • We invented an SD icon (Figure 7) to be an intuitive representation of the aircraft pitch and roll. How intuitive it actually is remains to be seen via testing in Ph^e 11. • Most importantly, we delivered a working SD Aiding prototype that serves as an excellent foundation for Phase II development and testing with pilots in a motion-based simulator.
50
F33615-03-M-6360
Multisensory Integration for Pilot Spatial Orientation
VIM. Phase 11 Directions Based upon our success in Phase I, we intend to pursue two major thrusts in Phase 11: 1. Enhance and vaHdate our SD illusion models 2. Enhance and evaluate our SD Aiding System Each of these thrusts has several major components.
Model Improvements To enhance our SD illusion models, we will: • Change from a fixed Mulder's constant comparison with acceleration duration, to a more accurate threshold for each of the three axes (pitch, roll, and yaw). Those thresholds are 3.2°/sec for roll, 2.67sec for pitch, and 1.17sec for yaw. Also, utricle sensing of linear accelerations is discussed (Stapleford, 1968). • Use more accurate washout values for pitch, roll, and yaw based upon the latest research by Dr. Brian Self and colleagues at USAFA (ongoing experiments). • More thoroughly test our models with actual de-identified flight data from AFSC, if such data sets are made available to us. If we receive multiple data sets from AFSC, we will use half for development purposes, and the other half for testing. Lessons learned from such testing will be used to make our models more robust. • Vary our model runs stochastically to explore boundary conditions, stability, and accuracy within a wider range of test conditions than can be done with non-varying X-Plane or AFSC data sets. • Add models for other illusions - such as somatogravic, Giant Hand, and others - in consultation with our customer. The decision criteria for adding illusions will be based upon the illusions frequency of occurrence for USAF (or other DoD) pilots, and the illusion's dissimilarity to others in our set, so as to cover as much of the "illusion space" as practical. If actual AFSC data suggests an illusion, we will use that fact as another criterion. To vahdate our models, we will proceed as follows. The key to our model vahdation is the creation of a disorienting vestibular illusion, in the GAT-II simulator, as represented in the box in the left center of Figure 21. Our intention for initial model validation is to create the Leans, as this is both common and a precursor to more serious incidents of SD (e.g.. Graveyard spin and spiral). Inputs to the illusion creation box are three factors: (1) Scenario parameters, which are those aspects of the simulation dynamics that are effective in creating the illusion. These include three aspects of bank (primarily, although we might consider pitch, or yaw): (i) the degree of bank that is achieved following straight and level flight, (ii) the velocity by which this bank is achieved (rate of change of bank), and (iii) the time duration dtiring which the bank is changing (duration of aircraft rotation). Mote that these three parameters are not independent of each other. If a given target bank angle is to be achieved following an X second duration of change, this will dictate the rate of bank. These three parameters can be combined into what we describe as a "bank profile". An additional scenario parameter, wliicli has twu stales, is wlictlicr tlic bmik ohemgc is aooompliahod
actively by commands given to the pilot, or passively by the simulation. We intend to vary these scenario parameters across a series of SD trials, in order to assess which combinations produce which levels of SD. 51
Multisensory Integration for Pilot Spatial Orientation
F33615-03-M-6360
(2J Factors: - VisibJiitv 'Workload ■ -Other
Instructions given to pilot ...
31
„.., lliusion Creation
^ Pilot Behaviors; - Passive {head tilt) - Active (control inputs)
(>) Scenario- Attitude {bank & pitch) • Attitude change rates ^ - Attitude change durations = Active or Passive inputs
:
Pilot Reports ' J - Matius! (AA, vertical indicator) 1 •• Vocat (Vap, level of t»nfidence)
Other Factors: - Pilot experience level - Repeated measures over conditions
Figure 21. Phase II model validation experimental considerations.
.
(2) Modulating factors are a set of environmental or operating conditions, which we believe will influence the onset and severity of SD. These include: (i) outside world (true horizon) visibility, which, ideally, will be varied at three levels - perfect, degraded (haze), and absent. We do not anticipate that perfect visibility will produce SD, but it will provide us with a set of "control condition" measures of SD = 0, which our model discriminates from the SD > 0 measures; (ii) menial workload which itself will be discriminated between the amount of workload (extraneous task demands) and the source of workload (visual versus non-visual distractions). There may be other modulating factors we wish to examine, but we beUeve these two are the most important. (3) Pilot instructions, such as "Maintain heading 050 at 15,000 feet and 300 knots." Precisely how the instructions will be phr^ed will be dictated by the measurements we will take (see below).
Assuming that we can design a scenario that can both produce the Leans and vary the magnitude of its experience, via the parameters described above, we must then assess the pilot state, as shown as outputs of the illusion creation box in Figure 21. These assessments are reflected both in pilot behavior and explicit pilot reports of SD. Pilot behavior includes passive me^ures - in particular head tilt, which will give us a measure of the pilot's perceived vertical (as inferred by the diflference between the perpendicular to the perceived horizon in IMC and the true horizon m VMC). In later simulations another important p^sive behavioral measure could include measures of eye scanning (away from the horizon). It is possible that we can also obtain p^sive measures of head rotation, to infer scanning away from the outside world and the attitude indicator. Pilot behavior also includes active measures of flight control inputs (i.e., stick or yoke deflection). These are particularly important, as they will assess the moment of active correction from an undesirable bank. Pilot reports are the key assessments of the SD state against which our model will be validated. Manual reports will involve periodic assessments of the pilot's belief in the dhection of vertical. These can be provided by a "sky pomter" held in the left hand, which can be rapidly oriented 52
F33615-03-M-6360
Multisensory Integration for Pilot Spatial Orientation
toward the pilot's belief of which direction is up. This will provide an objective, quantifiable measure of DA. The orientation can be videotaped or assessed by other sensors. Verbal reports will be obtained by asking the pilot to periodically rate his or her degree of certainty in spatial orientation along a 10-point scale. These ratings might be soUcited at the same time as the DA arrow task. They will provide an estimate of VAP. The experimental design will involve manipulating the input variables on the left of Figure 21 to create several conditions. It remains unclear the extent to which a single pilot will experience all conditions. It is likely that some of the experimental variables (such as ambient workload) will be varied between pilots. Also unclear is the amount of experience that we will need fi-om subject pilots. These uncertainties will be defined as we work with the simulator early in Phase II to develop credible scenarios and appropriate ways of measuring DA and VAP.
SD Aiding System Improvements To enhance our SD Aiding System, improvements will include the following. • Enhance and calibrate our SAVVOY scores to more accurately assess pilot workload in all of the sensory channels in which we are interested. • We have heard anecdotally that humans habituate to audio or tactile cues within 10-20 seconds. We will search the literature for this claim. If verified, we will constrain our intelligent audio and tactile cuing to accoimt for this habituation. To evaluate our SD Aiding System, our steps will include the following. • Test it with as much actual.data as practical. • Perform stochastic testing to check boundary conditions. • Conduct pilot-in-the-loop (PITL) trials with components of the system, as well as with the complete system. - To conduct PITL, we will need approval fi-om USAFA's IRB. - To test our multisensory countermeasures, we will first test them in isolation (or use the literature to establish a sensory coimtermeasure's efficacy), and then test them in combination with others in order to achieve an intelligent multisensory approach that appears to be the best combination for a given situation.
Conclusion Phase n will give us an opportunity to calibrate and vahdate our models and to test our SD Aiding System under reaUstic simulated scenarios with Air Force pilots.
53
F33615-03-M-6360
IX.
Multlsensory Integration for Pilot Spatial Orientation
References &, Annotated Bibliography
Adam, E.C. (1994). Head-up displays versus helmet-mounted displays: The issues. Proceedings of the International Society for Optical Engineering: Cockpit Displays, SPIE: Vol. 2219,13-19. HMDs for off-boresight targeting give pilots an important tactical advantage. Alexander, A.L., Wickens, CD., & Hardy, T.J. (2003). Examining the effects of guidance symbology, display size, and field of view on flight performance and situation awareness. Proceedings of the 4f^ Annual Meeting of the Human Factors and Ergonomics Society. Santa Monica, CA: HFES, 154-158. "Two experiments conducted in a high-fidelity flight simulator examined the effects of guidance symbology, display size, and field of view (FOV) on flight performance and situation awareness within a Synthetic Vision System (SVS). In Experiment 1,18 pilots flew hi^lighted and lowli^ted tunnel-in-the-sky displays and a less-cluttered foUowme-aircraft (FMA) through a series of curved approaches over rugged terrain. The results revealed that both tunnels supported better flightpath tracking than the FMA due to the availability of more preview information. Increasing tunnel intensity had no benefit on tracking, and in fact, traffic awareness w^ degraded. In Experiment 2,24 pilots flew a lowlighted tunnel display configured according to different display sizes (small or large) and FOVs (30° or 60°). Measures of flightpath tracking and terrain awareness generally favored the smaller display and the 60° FOV." ASA (1995). Federal aviation regulations &. airman's information manual (ISBN 1-56027-204X). Renton, WA: Aviation Supplies & Academics. Baloh, R.W., & Honrubia, V. (1990). Clinical neurophysiology of the vestibular system (2nd ed.). Philadelphia, PA: F.S, Davis Company. Bainbrldge, L. (1999). Processes underlymg human performance. In D.J. Garland, J.A. Wise, & V.D. Hopkin (Eds.), Handbook of Aviation Human Factors. Mahwah, NJ: Lawrence Erlbaimi Associates, 107-171. A superb chapter for human factors engineers that covers human perception, workload, and the context for human performance. ".. .[C]ontext is a key concept in understanding human behavior." Sensory sensitivity dq>ends on environmental factors, so that "it is difficult to make numerical predictions about sensory performance in particular circumstances, without testing directly." Very sahent signals can be useM as warnings, or be distr^ting nuisances. An iconic "display supports detection, but not discrimination or naming." "It is in combining three or more movements that it is easy to get into difficulties with compatibility. One classic example is the aircraft attitude indicator,... In the design of the indicator, four movements are involved: of the external world, of the display, of the
54
F33615-03-M-6360
Multisensory Integration for Pilot Spatial Orientation
control, and of the pilot's turning receptors.... The attitude instrument can show a moving aircraft, in which case the display movement is the same as the.. .control movement but opposite to the movement of the external world. Or the instrument can show a moving horizon, which is compatible with the view of the external world but not with the movement of the [control]. There is no solution in which all three movements are the same, so some performance errors or delays are inevitable." Cognitive processing involves: "deciding between alternative interpretations of the evidence; integrating data from all sensory sources, together with knowledge about the possibilities, into an inferred percept that makes best sense of all the information; and, recoding, that is, transforming from one type of code to another." Figure 6.22 on page 131 illustrates the cognitive processing. Figure 6.24 on page 133 shows cognition in relation to the external environment. "A person takes anticipatory action, not to correct the present situation, but to ensure that predicted unacceptable states or events do not occur." "Ideally, the display should make exphcit the points that are important for a particular purpose, and provide a framework for thinking." For physical movement skills, "use kinesthetic rather than visual feedback." Barfield, W., & Furness, T.A. (1995). Virtual environments and advanced interface design. NY: Oxford University Press. Begault, D.R., & Pittman, M.T. (1996). Three-dimensional audio versus head down traffic alert and collision avoidance system displays. International Journal ofAviation Psychology, 6, 79-93. Bellenkes, A., Bason, R., &Yacavone, D.W. (1992). Spatial disorientation in naval aviation mishaps: A review of class A incidents from 1980 through 1989. Aviation, Space, and Environmental Medicine, 63{2), 128-31. "SD has long been a major aero-medical factor contributing to naval aviation mishaps. In the past, it has been viewed as a generaUzed phenomenon, described by its Vertigo-related symptoms. More recently, however, three distinct types of SD have been identified, each based on whether the aviator recognizes and responds to its onset. In the current retrospective study. Flight Surgeon and Mishap Investigation Report narratives from 33 Class A mishaps occurring from 1980 through 1989 were reviewed. SD was determined to have been a causal factor in all cases. The mishaps were examined to categorize SD into the three descriptive types and to describe the relationship (if any) between SD and various mission-related factors. Aircraft type, phase of flight, time of day, pilot experience, and flight topography were all considered. The results indicate that Types I and II SD could be identified as causal factors in all 33 Class A mishaps. Further, most Type I SD was experienced primarily by helicopter pilots at night while most Type 11 SD incidents affected jet pilots during day missions." Benson, A. J. (1988). Motion sickness & spatial disorientation. In J. Emstmg & i'. King (Eds.), Aviation Medicine. London: Buttersworth, 318-493.
55
F33615-03-M-6360
Multisensory Integration for Pilot Spatial Orientation
Beringer, D.B., & Ball, J.D. (2000). HUDs versus HDDs: A comparison of formats for presentation ofhighway-in-the-sky primary flight displays. San Antonio, TX: Spatial Disorientation Symposium. Found at: http://www,spatiald.wpafb.af.mil/Primary%20Flight %20Displays/beringer.pdf 'Tilots expressed preference for a wide-angle view in turns but nairower field of view for straight-and-level cruise (less cluttered)." An argument for context-sensitive display formats. Beringer, D.B., Williges, R.C., & Roscoe, S.N. (1975). The transition of experienced pilots to a frequency separated altitude indicator. Human Factors, 17,401-414. Berkley, W.E., & Martin, E.L. (2000). Spatial disorientation in night vision goggle operations. San Antonio, TX: Spatial Disorientation Symposium. Found at: http://www.spatiald.wpafb.af.mil/Primary%20Flight%20Displays/berkley.pdf The impact of NVG operations on SD susceptibility. Berthoz, A., Israel, I., Georges-Francois, P., Grasso, R., & Tsuzuku, T. (1995). Spatial memory of body linear displacement: What is being stored? Science. 269,95-98. Beyer, M. (1985). Spatial disorientation in the F-15. In Proceedings of the Aircraft Attitude Awareness Workshop. Wright-Patterson AFB, OH: Flight Dynamics Laboratory (October 810), pp 1-4-1 to 1-4-5. Lists factors Mt considered major contributors to SD, some formation cues, HUD deficiencies, VMC complacency, and urges vertifiige traming.' Boff, K.R., & Lincoln, J.E. (1988). Engineering data compendium: Human perception and performance Volume I. Wright-Patteraon AFB, OH: Harry G. Armstrong Aerospace Medical Research Laboratory. Section 3.2 contains the formula for the vestibular sptem responses to momentary and prolonged stimuH. In particular, Mulder's constant, the threshold for angular acceleration duration (i.e., 2°/sec), as well as adaptation (habituation or recalibration) times. Borah, J., Young, L.R., & Curry, R.E. (1988). Optimal estimator model for human spatial onQntsAon. Annals of the New York Academy ofSciences, 545,51-13. "A model is presented to predict human dynamic spatial orientation in response to multisensory stimuli. Motion stimuH are first processed by dynamic models of the visual, vestibular, tactile, and proprioceptive sensors. Central nervous system function is modeled m a steady state Kalman filter that optunally blends information fi-om the various seiKore to form an estimate of spatial orientation. Where necessary, nonlinear elements preprocess inputs to the linear central estimator in order to reflect more accurately some nonUnear human response characteristics. Computer implementation of the model has
56
F33615-03-M-6360
Multisensory Integration for Pilot Spatial Orientation
shown agreement with several important quaUtative characteristics of human spatial orientation." Box, G. (1979). Robustness in the strategy of scientific model building. In R.L. Laimer & G.N. Wilkinson (Eds.), Robustness in Statistics. St. Louis, MO: Academic Press, 202. Braithwaite, M.G., Beal, K.G., Alvarez, E.A., Jones, H.D., & Estrada, A. (1998). The optokinetic cervico reflex during simulated helicopter flight. Aviation, Space, and Environmental Medicine, 69{ 12),1166-1173. "The optokinetic cervico reflex (OKCR) is a recently hypothesized, visually driven reflex that serves to stabilize the image of the external horizon on the retina during roll maneuvers in high-performance aircraft. Although reported anecdotally, head tilt during hehcopter flight has not been studied formally. Such research is required to determine the fill! impact and significance that it may have on the flying performance of a rotary-wing aviator. The aim of this study was to investigate the relationship between horizon position and the perception of orientation and, thus, to generate vital information to assess whether OKCR plays an important role in spatial disorientation. A UH-60 flight simulator study, with 20 volunteer pilots participating, was performed to examine the effects of this reflex during day flight and during flight with night vision goggles (NVGs). The results confirm that the OKCR occurs during simulated hehcopter flight, both with and without NVGs. As with previous studies, head roll increased during flight under visual meteorological conditions in relation to an increasing aircraft roll angle up to a maximum sustainable level and then remained constant. Head roll did not occur during flight under instrument meteorological conditions. The presence of the OKCR will impact rotarywing operations. Various aspects are discussed, and recommendations are made for fiiture research." Braithwaite, M. G., Durnford, S.J., Crowley, J.S., Rosado, N.R., & Albano, J.P. (1998). Spatial Disorientation in U.S. Army Rotary-Wing Operations. Aviation, Space, and Environmental Medicine, 69{\\), 1031-1037. Braithwaite, M.G., Durnford, S.F., Groh, S.L., Jones, H.D., Higdon, A.A., Estrada^, 4=5 & Alvarez, E.A. (1998). Flight simulator evaluation of a novel flight instrument display to minimize the risks of spatial disorientation. Aviation, Space, and Environmental Medicine, 69{S),1?>2>-1A1.
Braithwaite M.G, Hudgens J.J., Estrada, A., & Alvarez, E. A. (1998). An evaluation of the British Army spatial disorientation sortie in U.S. Army aviation. Aviation, Space, and Environmental Medicine, 5P(8), 727-32. "Following didactic instruction, most aircrews are able to experience some of the disorienting illusions and limitations of the orientation senses in a variety of ground-based devices. In order to reinforce instruction in SD within the environment in which they operate, British Army Air Corps helicopter pilots also receive an airborne demonstration of the limitations of their orientation senses prior to rotary-wing instrument fli^t train-
57
F33615-03-M-6360
Multisensory Integration for Pilot Spatial Orientation
ing. The objective of this assessment was to determine whether the SD demonstration sortie would be an effective adjunct in training aircrew in SD in the U.S. Army. There were 45 aviators and training personnel who experienced the sortie and gave their opinion in questionnaires. The following conclusions were made: the maneuvers performed in the SD demonstration sortie, and the sortie overall, were extremely effective at demonstrating the limitations of the orientation senses; the SD sortie attracted a significantly higher rating in its effectiveness to train aviators in SD than all the currently available methods; the introduction of the sortie into the initial flight training syllabus would be a distinct enhancement to the SD training of aviators and ^sociated personnel; and the introduction of the sortie into refresher trainmg in field units would also be an advantage. Other services are encouraged to consider this enhancement to the SD training of aviatore." Brandt, T. (1997). Cortical matching of visual and vestibular 3-D coordinate maps. Annals of Neurology, 42,9B3'9B4. Broomhall, L. (2003). Spatial disorientation: Something to avoid. MS&TMagazine, 5,29-32. A training technology review article that describes two simulators from two different manufacturers. Brown, D.L., DeVilbiss, C.A., Ercoline, W.R., & Yauch, D.W. (2000). Post roll effects on attitude perception: "Gillingham Illusion." Aviation, Space, and Environmental Medicine, 71, 489-495. Bryan, L.A., Stonecipher, J.W., & Aron, K. (1954). 180-degree turn experiment (Aeronautics Bulletin #11). Urbana,IL: UmversityofIllinois,histitute of Aviation. Describes a procedure for non-instrument pilots to fly out of IMC, if they accidentally fly into it. Carretta, T.R, Periy, D.C., Jr., & Ree, M.J. (1996). Prediction of situational awareness in F15 pilots, IntemationalJoumal of Aviation Psychology, 6{\), 21-41. "Situational awareness (SA) is a skill often deemed essential to pilot perfonnance in both combat and non-combat flying. A study was conducted to determine if SA in U.S. Air Force F-15 pilots could be predicted. The pMticipants were 171 active duty F-15 A/C pilots who completed a test battery representative of various psychological constructs proposed or demonstrated to be valid for the prediction of performance in a wide variety of military and civilian jobs. These predictore encompassed measures of cognitive ability, psychomotor ability, and personality. Supervisor and peer ratings of SA were collected. Supervisors and peers showed substantial a^eement on the SA ratings of the pilots. The first unrotated principle component extracted from the supervisor and peer ratings accounted for 92.5% of the variability of ratmgs. The unrotated first principle component served m the SA criterion. Flying experience me^ured in number of F-15 houre was the best predictor of SA. After controlling for the effects of F-15 flying hours.
58
F33615-03-M-6360
Multisensory Integration for Pilot Spatial Orientation
the measures of general cognitive ability based on working memory, spatial reasoning, and divided attention were found to be predictive of S A. Psychomotor and personality measures were not predictive. With additional F-15 flying hours it is expected that pilots would improve their ratings of SA." Chelette, T.L. (2001). Measuring the head tilt illusion during sustained acceleration. Human Systems I AC Gateway, 12(3), 4-6. "Magnitude of roll illusion (in degrees) Roll illusion = 0.3397 x arcsin{(G0.25 - 1) x sin [head pitch] x sin [head yaw]} Pitch illusion = 0.1491 x arcsin{(G0.25 - 1) x sin[head pitch] X cos[head yaw]}" "Specifically, an upward head pitch combined with a head yaw into a turn, as is common in formation flying, can result in a sensation of underbank and a pitch-up of the aircraft. Intended corrective action actually overbanks the aircraft with a pitch down, causing loss of altitude. Downward head pitches during turning, as is common during bombing or strafing runs, can cause a sensation of overbanking. Intended corrective action actually underbanks the aircraft, causing altitude gain that could lead to midair collision when in formation flight." Cheung, R. (2000). Non-visual spatial orientation mechanisms. San Antonio, TX: Spatial Disorientation Symposium. Found at: http://www.spatiald.wpafl3.af mil/MechanismsStudies /cheung.pdf Post-rotational decay in Roll (4s) < Pitch (7s) < Yaw (16s), measured fi"om duration of post-rotational decay of the resulting illusory sensation of rotation. There is a greater rate of error development in roll than in pitch and yaw. Semicircular canal inadequacies: Limited threshold of vestibular perception 0.14, 0.5 and 0.5°/s^ for yaw, roll and pitch respectively. Perceived angular velocity is less than the actual angular velocity. Absence of sensation of rotation during constant velocity rotation. Apparent sensation of rotation in the opposite direction during deceleration. Persistent apparent sensation of rotation in the opposite direction, after physical rotation has actually stopped. Greater rate of error development in roll > pitch > yaw. Cheung, R., & Hofer, K. (2003). Eye tracking, point of gaze, and performance degradation during disorientation. Aviation, Space, and Environmental Medicine, 74(1), 11-20. "The cognitive cockpit concept has been proposed as a potential disorientation countermeasure. It involves monitoring the pilot's physiological, behavioral and subjective responses during disorientation. This data is combined to provide a real time model of pilot state, which is used as a basis for optimizing pilot performance. This study attempts to investigate whether there are consistent behavioral or physiological markers that can be monitored during a specific disorientation scenario. An Integrated Physiological Trainer with interactive aircraft controls and an eye-tracking device was employed. Fourteen subjects proficient in maintaining straight-and-level flight and who have acquired the skills in changing attitude participated in the study. They were exposed to a flight profile consisting of straight-and-level flying and change in attitude without expo-
59
F33615-03-M-6360
Multisensory Integration for Pilot Spatial Orientation
sure to a head roll (control condition) and a profile with exposure to a head roll (experimental conditions) during constant yaw rotation. Flight performance parametere and subjects' eye movements and point of gaze behavior were monitored continuously. Immediately on the return to upright head position, all subjects reported a strong apparent pitch displ^ement that lasted < or = 20 s and a lesser sensation of lateral movement. Significant differences (p < 0.01) were noted on a number of scanning behaviore between the control and the experimental conditions. The appearance of Nystagmus was apparent as indicated by the number of involuntary saccades during disorientation. Flight performance decrement in the experimental conditions was reflected by a significant deviation in maintaining airspeed (p < 0,01). It appears that the pitch illusion consistently affects visual scanning behavior and is responsible for the decrement in flight performance observed in the simulator." Cheung, R., Money K., Wright, H., & Bateman, W. (1995). Spatial disorientation-implicated accidents in Canadian forces, 1982-92. Aviation, Space, and Environmental Medicine, 66(6% 579-85. "In a recent survey of CFl 8 aircrew human factors, 44% of pilots reported experience with spatial disorientation (SD), of whom 10% had experienced more than 3 episodes. In order to investigate further, we have completed a retrospective study of SD-imphcated category A accidents (where an aircraft is destroyed, declared missing, or damaged beyond economic repair) in the Canadian Forces (CF) during 1982-92, An overview of all SD occurrences (including accidents and incidents) across aircraft types is also presented. Information was gathered concerning the genesis and severity of disorientation so that research effort and pilot training could be appropriately implemented. Mishap investigation summaries involving category A accidents where SD was implicated were obtained from the CF Directorate ofFlight Safety and reviewed. We also examined in detail the Board of Inquiry Reports of these accidents. The role of disorientation in these accidents was assessed. There were 62 category A accidents between 1982-92 and, in 14, SD had been assigned as a possible cause factor in the accident records. When divided into the categories of Recognized SD (RSD), Unrecognized SD (USD), and Incapacitating SD (ISD), all but two fell into the category of USD (the pilots were unaware of the disorientation). Of tiie SD ^cidents, 11 involved a total loss of 24 lives. The majority of the accidents happened during the day, and pilots' cumulative flying experience did not appear to be a significant factor. According to our assessment, there were two episodes of vestibular origin, involving the somatogravic illusion. Three episodes of disorientation occurred over fi-ozen lakes, one over glassy water, and one over ocean." Cohen, D., Otakeno, S., Previc, F.H., & Ercoline, W.R. (2001). Effect of "inside-out" and "outside-in" attitude displays on off-axis tracking in pilots and nonpilots. Aviation, Space, and Environmental Medicine, 72(3), 170-176. "Pilots employing helmet-mounted displays spend sustained periods of time looking offaxis, necessitating the inclusion of attitude symbology on the hehnet to mamtam spatial awareness. We examined how fimdamentally different attitude references, a movinghorizon ('inside-out') or a moving-aircraft ('outside-in'), affected pilot and nonpilot atti-
60
F33615-03-M-6360
Multisensory Integration for Pilot Spatial Orientation
tude control when looking on- or off-axis. Both a rear-view and a side-view outside-in perspective were depicted to investigate the effect of control-display compatibility.... Subjects performed a compensatory pitch-roll tracking task either looking on-axis or 90 degrees off-axis using three symbologies: 1) a compressed pitch ladder with horizon line; 2) a 3-D aircraft representation viewed from the rear; and 3) a 3-D aircraft representation viewed from the side. Tracking error in roll and pitch, control bias, and subjective ratings were collected and analyzed.... There was no significant difference in the tracking performance of U.S. Air Force pilots in pitch and roll using the inside-out or outside-in rear-view formats on- and off-axis, although they preferred the inside-out format. Nonpilots tracked significantly better using the outside-in rear-view format, which they also preferred. Both groups fracked poorly using the outside-in side-view format and control-display compatibility had no important effect. Pilots are equally adept using outside-in and inside-out displays. Given that an outside-in display may better reflect a person's inherent frame of reference for orientation (as evidenced by the nonpilots' superior performance with it), the resuhs seem to indicate that pilots, through experience, have adapted to an inside-out frame of reference." Collins, D.L., & Harrison, G. (1995). Spatial disorientation episodes among F-15C pilots during Operation Desert Storm. Journal of Vestibular Research, 5(6), 405-10. "Spatial Orientation (SO) under flight conditions is the accurate 'integration' of sensory inputs from the dynamic aviation environment that result in safe and effective goaloriented performance. Insidious sensory mismatches routinely occur during flight, impeding pilot performance. When this sensory dissonance occurs, if not appropnately resolved, it will result in perceived or actual errors in aircraft confrol that are estimated to cost the Air Force between $150 and $200M per annum in aircraft accidents. A scientific survey was created and administered to 96 F-15C combat pilots after their return from Desert Storm. The survey sought to determine where in the flight profile, and under what conditions, spatial disorientation (SD) episodes occurred. The survey consisted of multiple choice and open-ended questions. The analyses of the data revealed that visual transitions from inside to outside the cockpit (or the reciprocal) [e.g., target acquisition] under different conditions of flight were associated with the occurrence of SD episodes. The frequency of SD episodes varied depending on visual fransitions (or no visual fransitions) and types of flight conditions (for example, night-time and bad weather). This SD survey provided flight information that allowed us to direct research to those areas that were problematic during combat operations." Cone, S.M., & Hassoun, J.A. (1992). Attitude awareness enhancements for the F-16 head-up display (Final report ASC-TR-92-5017). Wright-Patterson AFB, OH: Aeronautical Systems Center. The F-16 System Program Office identified a set of HUD enhancements for evaluation: "(1) extended horizon, (2) ghost horizon, (3) articulated nose down pitch bars, (4) removal of the 2:1 pitch scale compression, (5) moving nose down pitch bar tic marks to the inside of the pitch bars, (6) modified bank angle indicator, and (7) modified zenith/nadir symbols." Experimental results for 15 pilots flying simulated unusual atti-
61
F33615-03-M-6360
Multisensory Integration for Pilot Spatial Orientation
tude recoveries showed faster reaction times and strong preference for modifications 1-5 &7. Results for the modified bank angle indicator were mixed, Costello, R.G. (1976), Continuous compensatory audio manual tracking. In Proceedings of Twelfth Annual Conference on Manual Control (NASA TM X-73,170). Moffett Field, CA: Ames Research Center, 406-421. Glider pilots may use an audio variometer for indicatmg their sink or climb rate so that they can maintain visual scans and not have to look inside at their vertical speed indicator. Increasing tone pitch indicates climbing; descent is noted by the decreasing pitch of the tone. The author speculates that pilots use the tone for coarse ^sessments of their flight strategy, while using the horizon for fine tuning their path. Craig, G., Brown, A., Jennings, S., & Cheung, R. (2003), Flight test of three attitude indicators for unusual attitude recovery. Presented at Aerospace Medical Association's Annual Meeting, May 4-9,2003, San Antonio, TX, FUght test compared a conventional AI, an arc-segmented attitude reference, and a novel asymmetric AI. During unusual attitude recoveries, the asymmetric AI supported quicker recoveries and fewer errors, Davenport, C. (2000). Spatial disorientation: The USAF experience, FY 1991-FY2000: How much are we willing to pay! San Antonio, TX: Spatial Disorientation Symposium, Found at: http://www.spatiald,wpafb.af.mil/Mishap%20Studies/Davenport,pdf The top 10 contributing factors to SD mishaps are: attention management, judgment/decision-making, mission demands, psychological factors, mental fatigue, visibility, training, behavior, personal/community factors, and instrumentation. Davenport, C. (2003). Personal communication (email message of 7/9/2003). Vestibular threshold of greater than 2 degrees per second per second «;celeration normally results in a sensed motion. However, if the pilot is task overloaded, even greater accelerations may not be perceived, DeHart, R.L., & Davis, J.R. (eds.) (2002), Fundamentals of aerospace medicine (3'^ ed,, ISBN 0-7817-2898-3). New York: Lippincott Wilhams & WilMns. A must have reference for any serious SO/SD researcher. Chapter 8, Spatial Orientation, by A.J. Parmet and Kent K, Gillingham, pages 184-244, covers all of the essentials for this topic, including: traiKlational and rotational motion, actions and reactiom, visual orientation, vestibular function, perceptions, other senses of motion and position, illusions, the dynamics of spatial orientation and disorientation, other sensory phenomena, situational awareness, and motion sickness.
62
F33615-03-M-6360
Multisensory Integration for Pilot Spatial Orientation
Important excerpts are: "the actual vestibular perceptual thresholds are 'constant except when they vary'" (page 201), which supports our model-based Monte Carlo approach to modeling the vestibular system. "The leans [is] the most common of all vestibular illusions in flight" (page 221), which supports our first scenario focusing on the Leans. Dieterich, M., Bucher, S.F., Seelos, K.C., & Brandt, T. (1998). Horizontal or vertical optokinetic stimulation activates visual motion-sensitive ocular motor and vestibular cortex areas with right hemispheric dominance: An fMRI study. 5ram, 727,1479-1495. Duffy, C.J., & Wurtz, R.H. (1995). Responses of monkey MST neurons to optic flow stimuli with shifted centers. Journal ofNeuroscience, 15(7), 5192-5208. Endsley, M.R, & Rosiles, S.A. (1995). Auditory localization for spatial orientation. Journal of Vestibular Research, 5(6), 473-85. "The use of 3D auditory technology that provides localization of auditory cues presented through headphones is proposed as a means of providing supplemental information to pilots on the spatial orientation of an aircraft. This technique shows promise for reducing accidents due to spatial disorientation associated with high visual load. A study was conducted using USAF pilots as subjects to determine desirable inverted question mark cue characteristics for accurately locaUzing auditory cues using this technique. The study examined the use of 9 different cue types at each of 2 frequency levels. It was found that the accuracy of subjects' localization of cues in elevation was greatly enhanced by the use of multidimensional cues that provided redundant elevation information through varying frequencies and distance from the horizon cues in addition to the inherent spatial location information. Trade-offs in azimuth localization accuracy and response time were noted, however. Recommendations are made for fiirther developing and investigating this technique for the aircraft spatial orientation task." Engineering Acoustics, Inc. (2003). See: http://www.navysbir.brtrc.coni/cap/briefingsadmin/ ea.asp. Describes the tactile situation awareness system (TSAS) and claims reduced perceived workload and improved "performance in spatial tasks, especially in the presence of disfracting influences." Ercoline, W.R. (1997). Introduction to spatial disorientation training. Found at: www.sam. brooks.afmil/web/ram/SPATIALD/instrume.html. Ercoline, W.R. (1998). In Minutes of the 22"^ meeting of the DoD flight symbology working group. Moffett Field, CA: NASA Ames Research Center. Ercoline asserts, "Attitude symbology is not needed on HMDs to maintain attitude awareness when looking off-axis to find and track a target during restricted visibility."
63
F33615-03-M-6360
Multisensory Integration for Pilot Spatial Orientation
Ercoline, W.R. (2000). The attitude component of the primary flight reference: Where do we go from here? San Antonio, TX: Spatial Disorientation Symposium. Found at: http://www. spatiald.wpafb.af.mil/Primary%20Flight%20Displays/ercolineb.pdf. Ercoline rqjorts a study of 3 different attitude displays for use with an HMD. The socalled grapefruit presentation had the best results in terms of reaction time, error rates and subject preference. Furthermore, the Class A mishap rate due to SD is largely unchanged smce the 1970s. Ercoline, W.R., DeVilbiss, C.A., & Lyons, T.J. (1994a). Trends in USAF spatial disorientation accidents - 1958-1992. In Proceedings of the SPIE Conference (A95-12001-0154 in Orlando, FL). BelUngham, WA: Society ofPhoto-Optical Instrumentation Engineers, 257-260. The rate of major aircraft accidents from the period 1958-1971 was 5.36 per 100,000 flying hours; the rate was 2.22 during the period 1972-1992. Even thou^ the accident rate decre^ed, the rate of SD-related accidents remained about the same: 0,32 and 0.35. Ercoline, W.R., Freeman, J.E., Gillingham, K.K., & Lyons, T.J. (1994b). Classification problems of US Air Force Spatial Disorientation accidents, 1989-91. Aviation, Space and Environmental Medicine, 65, 147-152. Ercoline, W.R., & Previc, F. (2001). Spatial disorientation, geographic disorientation, loss of situation awareness, and controlled flight into terrain. Human Systems lAC Gateway, 12(3), 1012. Spatial disorientation related to the loss of situation awareness. Ercoline, W.R., Self, B.P., & Matthews, R.S. (2002), Effects of three helmet-mounted display symbologies on unusual attitude recognition and recovery. Aviation Space and Environmental Medicine, Nov;73(ll): 1053-8. "Hetaiet-mounted displays (HMDs) allow pilots to view aircraft instrument information while looking to the side, away from the aircraft centerline axis. In that situation, pilots may lose attitude awareness and thus develop spatial disorientation, A secondary ccncem is flie possible effects of visual conflict between tiie apparent motion of traditional, nose-referenced flight symbology and the off-axis view of the outside world. Alternative symbologies will provide improved attitude awareness for HMDs when compared with the conventional inside-out symbology now used with head-up displays (HUDs), if the HUD symbology is used on a HMD. The 9 pilots were presented 48 randomly arranged unusual attitude conditions on a HMD. The three symbologies included: 1) the insideout representation now used with fixed HUDs, which features a moving horizon and pitch ladder; 2) an outside-in display that depicts a moving aircraft relative to a fixed horizon; and 3) an inside-out novel symbology termed the grapefruit' display (OD). The background scene contained a mix of either a front view orientation or a side view one. Conditions were randomized within and across subjects. Subjective preferences were col-
64
F33615-03-M-6360
Multisensory Integration for Pilot Spatial Orientation
lected after the completion of all tasks. Analysis of variance repeated measures design revealed that stick input for the GD was significantly faster with fewer roll reversal errors than either of the other two. The time to recover to straight and level was significantly shorter for the front view orientation than the side view. Of the nine pilots, eight preferred the GD symbology as a method of presenting attitude information on the HMD. Results suggest the current HUD symbology is not the best way of displaying attitude information on the HMD. Given the conditions of this study, the best way of presenting the pilot with attitude information on the HMD is with the GD symbology." Eriksson, L., Johansson, K., & von Hofsten, C. (2003). Peripheral vision effects on spatial orientation driven by focused depth. Presented at a poster session j of the 47* Annual Meeting of the Human Factors and Ergonomics Society. Denver, CO. "Enhanced support of pilot spatial orientation (SO) could be achieved by presenting flight-adapted visual flow with conformal horizon in the peripheral visual field. This could be implemented on...HUDs...or...HMDs.... The [experimental] results indicate that focused depth drives the effects of peripheral visual flow on SO. Fadden, S., Ververs, P. M., & Wickens, C. D. (2001). Pathway HUDS: Are they viable? Human Factors ^5,173-193. Forbes, T.W. (1946). Auditory signals for instrument flying. Journal of the Aeronautical Sciences, May, 255-258. Tones used to augment visual attitude displays and directions. Gallimore, J.J., Brannon, N.G., Patterson, F.R., & Nalepka, J.P. (1999). Effects of FOV and aircraft bank on pilot head movement and reversal errors during simulated flight. Aviation, Space, and Environmental Medicine, 70(12), 1152-1160. "Investigated the effects of field of view (FOV) and aircraft bank on pilot head movement and reversal error during simulated flight. It was hypothesized that as FOV decreased, there would be a significant reduction in Opto-Kinetic Cervical Reflex (OKCR)-induced head movement. Reduced FOV was also hypothesized to increase control reversal errors. To test this hypothesis 12 US military pilots completed simulated flight tasks in a stationary dome. Head tilt, pitch, and yaw were recorded as a fimction of aircraft bank and FOV (40, 60, and 100 degrees circular). The number of control reversal errors was analyzed to investigate signs of spatial disorientation. Results indicated that during visual meteorological condition (VMC) maneuvers pilots exhibited significant OKCR; however there were no significant differences among the 3 levels of FOV. FOV significantly affected head pitch movements imder VMC and instrvunent meteorological conditions. Pilots yawed their heads in the direction of aircraft bank under VMC. Pilots committed 22 reversal errors out of 72 trials (30.55%). The magnitude of the error was largest in the 40 degree FOV condition.
65
F33615-03-M-6360
Multisensory Integration for Pilot Spatial Orientation
Gallimore, J.J., & Liggett, K.K. (2000). Implications ofspatial sensory reflex research on primaryflight display design. San Antonio, TX: Spatial Disorientation Symposium. OKCR occurs in VMC (when the horizon is visible), not in IMC. Apparently, it is due to the reflexive response to keep the horizon stable within the visual field. Head tilt from OKCR is likely to put the pilot's eyes outside the HUD eye box. Frame of reference is dictated by the pilots' attentional activities, hnplications for transitions between different frames of reference are pertinent to HMD symbology; traditional symbology should not be used. Gallimore, J.J., Patterson, F.R,, Brannon, N.G., & Nalepka, J.P. (2000). The opto-kinetic cervical reflex during formation flight. Aviation, Space, and Environmental Medicine, 7I(B% 812-821. "Weather formation flight is a difficuh task prone to episodes of spatial disorientation. Therefore, investigation of sensory reflexes under these conditions is critical. Recent studies have shown that the opto-kinetic cervical reflex (OKCR) occurs during VMC flight conditions and serves to estabhsh the horizon retinal image as a stabilized primary visual-spatial cue. The purpose of this research was to investigate the OKCR and field of view (FOV).during formation flight under VMC and IMC, There were 2 experiments conducted in which a total of 26 pilots completed simulated flight tasks in a stationary dome. Head tih was examined m a function of aircraft bank with unrestricted FOV in Experiment I. Experiment II exammed head tilt under three FOV conditions (40 degrees, 60 degrees, and 100 approximately circular). During VMC maneuvers pilots exhibited significant OKCR. There were no differences in head tih between Solo Figure 8 and Formation Figure 8 VMC conditions. Pilots did not tih tiieir heads under IMC Formation Flight. FOV did not significantly affect the OKCR. Pilots exhibit the OKCR during formation and solo VMC t^ks. However, the OKCR is reduced when compared with low level navigation t^ks, indicating a difference in the visual cues between taste. Pilots do not exhibit OKCR during IMC flight; therefore, the OKCR will have an impact on formation flights in and out of clouds leading to sensory conflicts caused by repeated realignment of visual and vestibular systems." Gawron, V., & Knotts, L. (1984). A preluninary flight evaluation of the peripheral vision display i^ing the NT-33 A aircraft. Proceedings of the 25** Annual Meeting of the Human Factors Society. Santa Monica, CA: Human Factors Society, 539-541. GilUngham, K.K. (1992). The spatial disorientation problem m the United States Air Force. Joumalof Vestibular Research, 2,297-306. "Spatial disorientation (SD) in flight wastes hundreds of milUons of dollare worth of defense capability annually and continues to kill ah-crew. SD results primarily from madequacies of human visual and vestibular sensory systems in the flying environment; but other factors, such as task saturation and distraction, precipitate it. The United States Air Force is conducting a three-pronged research and development effort to solve the SD problem. We are attempting 1) to elucidate further the mechanisms of visual and vestibular orientation and disorientation, 2) to develop ground-based and inflight training
66
F33615-03-M-6360
Multisensory Integration for Pilot Spatial Orientation
methods for demonstrating to pilots the potential for SD and the means of coping with it, and 3) to conceive and evaluate new ways to display flight control and performance information so that pilots can maintain accurate spatial orientation." Gillmgham, K.K., & Previc, F.H. (1993). Spatial orientation inflight (AL-TR-1993-0022). Wright-Patterson AFB, OH: Air Force Armstrong Laboratories. Gilson, R.D., Ventola, R.W., & Fenton, R.E. (1975). A kinesthetic-tactual display for stall deterrence. In Eleventh Annual Conference on Manual Control (NASA TM X-62,464; under FAA contract DOT-FA74WA-3515). Moffett Field, CA: Ames Research Center, 440-451 Describes a device for the yoke or stick of an aircraft that pushes into the hand to indicate AOA. Goldberg, M.E., Eggers, H.M,, & Gouras, P. (1991). The ocular motor system, hi E.R. Kandel, J.H. Schwartz, & T.M. Jessell (Eds.), Principles of neural science. Norwalk, CT: Appleton & Lange, 660-677. Gomez, G. (2002). Spatial Disorientation: Something old & something new. hi Essays & Articles. Found with Google search at: http://wvirw.isamindia.org/essays/cme_spatial.shtml Excellent historical overview and statistics. Vision gives 90% of the input to the brain for orientation. "The other senses play a supporting role in correct perception of aircraft orientation." "Visual dominance falls into two categories: the congenital type, in which ambient vision provides dominant orientation cues through natural neural coimections and fiinctions, and the acquired type, in which orientation cues are gleaned through focal vision and are integrated as a result of training and experience into an orientation percept. This complex skill must be developed through training and maintained through practice, and its fragility is one of the factors that make spatial disorientation such a hazard." "Visual cues from instruments utiUze focal rather than the ambient mode of vision and therefore place greater demands on central processing resources." "A pilot's radio transmission that the aircraft controls are malfimctioning should not, therefore, be taken as conclusive evidence that a confrol malfimction caused a mishap: spatial disorientation could have been the real cause." "The basic concept of SD containment is to convert all Type I SD to Type II SD and prevent a Type II SD from becoming a Type HI SD." The author also presents an SD Threat CheckUst, which includes: "FUght over featureless terrain" (e.g., ocean or desert); and aircrew factors, such as "high arousal and anxiety which increase susceptibility to SD," drugs which impair a pilot's "ability to suppress nystagmus," and fatigue or task overload. Gopher, D., Weil, M., & Barakeit, T. (1994). Transfer of skill from a computer game to flight. Human Factors, 36, 387-405. Guedry, F.E. (1992). Perception of motion and position relative to the earth: An overview. Annals of the New York Academy of Sciences, May 656, 315-328. Found at: http://www. annalsnyas.org/cgi/content/absfract/656/1/315.
67
F33615-03-M-6360
Multisensory Integration for Pilot Spatial Orientation
"Results of the five experiments are consistent with the following generalizations. Canalmediated turn perception (pitch, roll, or yaw) in earth-horizontal or earth-vertical plane, is suppressed in direct relationship to the magnitude of a linear acceleration vector lying in the plane of a responding canal when the magnitude of the linear vector is constant or increasing and when its direction is either fixed or rotating in the same direction as the concomitant canal signal. Canal-mediated turn perception (pitch, roll, or yaw) is not suppressed by a coplanar linear vector that is counter-rotating relative to the canal signal. Change in perceived attitude (pitch, roll, or yaw) is very sluggish in the absence of concordant canal information; attitude change may not be an immediate otolith-mediated perceptual event but a slowly developing perception dependent upon cognitive appreciation of an immediate otolith angular position signal. OtoMth phasic neural units, unreinforced by appropriate canal signals, may contribute more to a brief linear velocity component in perception than to rate of attitude change. Otolith-mediated attitude perception within a given earth-vertical plane can be distorted by strong coplanar angular velocity canal information. Once distorted, return to veridical attitude perception can be gradual because, in the absence of compHmentary canal or visual information, recovery is dependent upon relatively slow cognitive appreciation of a prevailing otolith position signal. Several attractive hypotheses relatmg to the dynamics of attitude perception can only be tested by substantially more data on the dynamics of spatial orientation perception. Most of our objectives cannot be achieved without models that yield valid prediction of the dynamics of spatial orientation percqition. All of the observations in these experiments were carried out in darkness, or, in the simulated catapuh experiment, without external visual reference. Various forms of visual information will change the dynamics of spatial orientation perception. My discussion has been limited to consideration of the vestibular system, as though the canal and otoUth s^tems completely controlled the dynamics of spatial orientation perceptions. Obviously other partners in the dynamics of postural control, including vision, proprioception, and expectation, must be included in this challenging field of research. Dedication to stereotyped ideas about objectivity in the 20th century has hindered advancement of knowledge on the dynamics of spatial orientation perception relative to rate of progress achieved by several scientists of the 18th and 19th centuries, who provided word pictures of perceived motions and tilts along with descriptions of the motions that engendered the pictures." Haworth, L. A., & Seery, R. E. (1992). Rotorcraft helmet mounted display symbology research (SAE Technical Paper 921977). Warrendale, PA: Society of Automotive Engineers. Haxby, J.V., Horwitz, B., Ungerleider, L.G., Maisog, J.M., Pietrini, P., & Grady, C.L. (1994). The fimctional organization ofhumanextrastriate cortex: A PET-i
68
F33615-03-M-6360
Multisensory Integration for Pilot Spatial Orientation
Herdman, CM., Johannsdottir, K.R., Armstrong, J., Jarmaz, J., LeFevre, J., & Lichacz, F. (2000). Mixed-up but flyable: HMDs with aircraft- and head- referenced symbology. In D. Harris (Ed.), Proceedings of the Third International Conference on Engineering Psychology and Cognitive Ergonomics, 5. Edinburgh, Scotland: Ashgate, 73-80. Hess, R.A. (1980). Structural model of the adaptive human pilot. Journal of Guidance and Control, Vol. 5(5), 416-423. This article suggests a general model and formulas for signal processing in pursuit and compensatory tracking tasks, which are helpfiil for explaining observed data, but are not as good at predicting performance. Holmes, S.R., Bunting, A., Brown, D.L., Hiatt, K.L., Braithwaite, M.G., & Harrigan, M.J. (2003). Survey of spatial disorientation in military pilots and navigators. Aviation, Space, and Environmental Medicine, 74(9), 957-965. "752 UK aviators answered an SD survey that showed 92% of respondents experienced the Leans, the most frequently experienced SD event from the survey. Next most frequent was loss of horizon due to atmospheric conditions (82%), then misleading, altitude cues (79%), sloping horizon (75%), and disfraction-induced SD (66%). The researchers correlated SD experiences with training (groimd and in-flight) and found a significant correlation between fraining and SD recognition and severity. The researchers concluded that in-flight fraining was most beneficial and should be tailored to the specific aircraft and circumstances (e.g., use of NVGs)." Howard, I.P. (1986). The perception of posture, self-motion and the visual vertical. In K.R.Boff, L.Kaufinan, & J.P. Thomas (Eds.), Handbook of Perception and Human Performance (Volume I). New York: John Wiley & Sons, 18.1-18.62. Visual-vestibular interactions, dampening effects, and thresholds of detectable motions. International Standards Organization (2002). ISO 14915-3.■2002(E), Annex D: Design issues and cognitive background. Human signal processing bottlenecks and an assertion: "Generally our eyes are drawn to moving shapes, then complex, different, and colorfiil objects." Ivanov, A.I., & Lapa, V.V. (2002). The effect of mobility of the information field of the helmet-mounted indicator on pilot's efficiency. Aviakosm. Ekolog. Med., 56(4), 37-40. "Results of an experimental investigation of pilot's efficiency with the use of a helmetmounted indicator (HMI) are reported. Displacement of the HMI information field in consequence of head movements in search for external objects and target acquisition was shown to impact reUability of spatial orientation and cause difficulties during construction and realization of aircraft control movements. These difficulties are ascribed to impairment of fimctioning of the human 'body scheme' (internal systems of coordinates)
69
F33615-03-M-6360
Multisensory Integration for Pilot Spatial Orientation
and modification of the geometric relations of the trae and HMI displayed horizon. The conclusion is that to improve efficiency of pilots using HMI designed should be a device which will align the HMI information field with the longitudinal cabin axis after each head movement." Jia, H.B., Yu, L.S., Bi, H.Z., Wang, K.N., Lra, Z., & Xie, S.J. (2001). Ground simulation of the G-excess illusion. Space Medicine and Medical Engineering, 14(2), BB-91. 'To observe the subjects' perception of orientation following certain head movements or change of simulator cab attitude in hypergravity (HG), and assess the feasibility of sunulating G-excess illusion on the ground by a centrifiige-like Spatial Disorientation (SD) simulator. 1.6 G force field WM generated by planetary rotation of the simulator. Perception of orientation of the cab were collected fi-om twelve male pilots' report following their heads pitch movements in pitch plane or cab attitude changes in roll plane under 1,6 G. While making a pitch-up head movement, the pilots experienced a 63.8 degrees +/48.3 degrees pitch-up attitude change of the cab in pitch plane, and when the cab was tilted left 20 degrees, pilots experienced a tilt-left perception of 48.6 degrees +/- 39.4 degrees in roll plane. Althou^ there's strong Coriolis effects onboard the SD simulator under 1.6 G, most pilots experienced the G-excess illusion. It demonstrated that it was feasible to use the centrifuge-like device to generate this kind of illusion on the ground." Johnson, K.R. (2000). Spatial disorientation in military aviation. Presented at the Spatial Disorientation Symposium, San Antonio, TX, Found at: www.spatiald.wpafl3,af.mil/library_ san.asp. Johnson, S.L., & Roscoe, S.N. (1972). What moves, the airplane or the world? Human Factors, 14,107-129. Kaczmarek, K.A. (2000). Electrotactile adaptation on the abdomen: Preliminary results. IEEE Transactions on Rehabilitation Engineering, 8(4), 499-505. "Electrotactile (electrocutaneous) stimulation at currents greater than sensation threshold causes sensory adaptation, which tanporarily raises the semation threshold and reduces the perceived magnitude of stimulation. After 15 min[utes] of moderately intense exposure to a conditioning stimulus (10 s[econds] on, 10 s[econds] off), the sensation threshold elevation for seven observera was 60-270%, depending on the current, fi-equency, aad number of pulses in the burst structure of the conditioning stimulus. Increases in any of these parametens increased the sensation threshold elevation. Adaptation and recovery were each complete in approximately 15 min[utes]." Kandel, E.R. (1991). Perception of motion, dqjth, and form. In E.R. Kandel, J.H. Schwartz, & T.M. Jessell (Eds.), Principles of neural science (3^ ed.). Norwalk, CT: Appleton & Lange, 440-466. I^ndel, E.R., Schwartz, J.H., & Jessell, T.M. (Eds.) (1991). Principles of neural science (3rd ed.). Norwalk, CT: Appleton & Lange.
70
F33615-03-M-6360
Multisensory Integration for Pilot Spatial Orientation
Kehoe, N.B. (1985). Colonel Kehoe's spatial disorientation (SD) incident in an F-15 during VMC. In Proceedings of the Aircraft Attitude Awareness Workshop. Wright-Patterson AFB, OH: Flight Dynamics Laboratory (October 8-10), pages 1-5-1 to 1-5-4. Personal experience: Noise cue alerted pilot to unusual attitude - going very fast. Kelly, J.P. (1991). The neural basis of perception and movement. In E.R. Kandel, J.H. Schwartz, & T.M. Jessell (Eds.), Principles of neural science. Norwalk, CT: Appleton & Lange, 283-295. Kirkham, W.R. (1978). Spatial disorientation in general aviation accidents. Aviation, Space, and Environmental Medicine, 49, 1080-1086. "Spatial disorientation (SD) refers to an incorrect self-appraisal of the attitude or motion of the pilot and his aircraft with respect to the earth. This paper defines elements of SD problems as encountered in general civil aviation. Accident reports made by the National Transportation Safety Board for a recent 6-year period were reviewed. Statistical computations were made relating SD to fatal accidents. Small fixed-wing aircraft (under 12,500 lb) accounted for 97.3 percent of all SD accidents. Inclement weather was associated with 42 percent of all fatal accidents, and SD was a cause or factor in 35.6 percent of these cases. Non-instrument-rated pilots were involved in 84.7 percent of SD weatherinvolved accidents. These and other data attest to the importance of this psychophysiological phenomenon (SD) in flight safety. Suggestions are made of ways to improve pilots' awareness and understanding of this problem." Knapp, C.J., & Johnson, R. (1996). F-16 Class A mishaps in the U.S. Air Force, 1975-93. Aviation, Space, and Environmental Medicine, 67{?)), Ill-l%2i. "All USAF F-16 fighter Class A (major) aircraft mishaps from 1975-93 were analyzed; using records from the U.S. Air Force Safety Agency (AFSA). There were 190 Class A mishaps involving 204 F-16's and 217 aircrews during this 19-yr period. The overall Class A rate was 5.09 per 100,000 flight hours, more than double the overall USAF rate. The mishaps are categorized by year, month, time of day and model of aircraft in relation to mishap causes as determined and reported by AFSA. Formation position, phase of flight and primary cause of the mishap indicate that maneuvering, cruise and low-level phases account for the majority of the mishaps (71%), with air-to-air engagements associated with a higher proportion of pilot error (71%) than air-to-groimd (49%)). Engine failure was the number one cause of mishaps (35%), and colUsion with the ground the next most frequent (24%). Pilot error was determined as causative in 55% of all the mishaps. Pilot error was often associated with other non-pilot related causes. Chaimelized attention, loss of situational awareness and spatial disorientation accovmted for approximately 30% of the total pilot error causes foimd. Pilot demographics, flight hour/sortie profiles, and aircrew injuries are also listed. Fatahties occurred in 27% of the mishaps, with 97% of those involving pilot errors."
71
F33615-03-M-6360
Multlsensory Integration for Pilot Spatial Orientation
Kovalenko, P.A. (1991). Psychological aspects of pilot spatial orientation. ICAO Journal, ¥tf(3), 18-23. "Researchers examined the psychological aspects of pilot spatial orientation to aircraft attitude. Study participants completed questionnaires and made drawings of view-fromthe-ground and aircraft front window and of attitude indicators, llien made flights in a simulator or aircraft with unknown pitch attitude. Analysis of data indicates that pilots favored a view-from-the-ground indicator. The main drawback to the view-from-theaircraft indicator w^ mobility of image. The study also examined spatial-orientation techniques pilots use in different flight phases and identified seven factors in effective spatial-orientation techniques. Other components of the study included a comparison of the manipulative capability of pilots and nonprofessional participants and pilot recall of a set of images from long-term and operational memory." Lappe, M. (1997). Analysis of self-motion by parietal neurons. In P. Thier & H.O. Kamath (Eds.%Parietal lobe contributions to mentation in 3D space. Heidelberg: Springer-Vtjrlag, 597-618. Lawson, B.D., Kass, S.J., Kennedy, RS., Muth, E.R., & Smith, S.A. (2002). Vestibular stimuh may degrade situation awareness even whai spatial disorientation is not expressed. Human Factors and Medicine Symposium, Spatial Disorientation in Military Vehicles: Causes, Consequences and Cures Panel. La Caruna, Spain: NATO Research & Technology Agency," LeBlaye, P., Roumes, C, Fornette, M.P., & Valot, C. (2002). Head up displays symbology (HUD): Pre-normative studyfor GFAC/SFACT (DCSD TR 2/05007). Paris: ONERA. "This report is the final report of the first phase of a study of head up displays (HUD) symbology conducted for DGAC/SFACT, in the frame of its pre normative research program for civil aviation safety. This report describes the main steps and results of the study: 1. Comparative analysis of the JAA and FAA regulations concerning HUD in general, and more especially, the specifications rfjout their symbology 2. State of the interpretation of the existing regulations, through the interviews of certification experts 3. Comparative analysis of the symbologies of existing HUD products and comparison with the requirements of the regulation 4. Current state of the operational use of HUD, through the available safety reporting sptems and interviews with the users 5. Synthesis of the lack of the regulation in regard with the needs of the certification experts and with the operational difficulties encountered by the users." Levlson, W., Elktnd, J., & Ward, J. (1971). Studies of multi-variable manual control systems: A model for task interference (NASA contractor report 1746). Washington, DC: NASA.
72
F33615-03-M-6360
Multisensory Integration for Pilot Spatial Orientation
Levy, J.L., Foyle, D.C., & McCann, R.S. (1998). Performance benefits with scene-linked HUD symbology: An attentional phenomenon? In Proceedings of the 42nd Annual Meeting of the Human Factors and Ergonomics Society. Santa Monica, CA: Human Factors Society. Liggett, K.K., & Gallimore, J.J. (2002). An analysis of control reversal errors during unusual attitude recoveries using helmet-mounted display symbology. Aviation, Space, and Environmental Medicine, 73(2), 102-111. "Spatial disorientation (SD) refers to pilots' inability to accurately interpret the attitude of their aircraft with respect to Earth. Unfortunately, SD statistics have held constant tor the past few decades, through the transition from the head-down attitude indicator (AI) to the head-up display (HUD) as the attitude instrument. The newest attitude-indicating device to find its way into military cockpits is the helmet-mounted display (HMD). HMDs were initially introduced into the cockpit to enhance target location and weapon-pointing, but there is currently an effort to make HMDs attitude reference displays so pilots need not go head-down to obtain attitude information. However, imintuitive information or inappropriate implementation of on-boresight attitude symbology on the HMD may contribute to the SD problem. The occurrence of control reversal errors (CREs) during imusual attitude recovery tasks when using an HMD to provide attitude information was investigated. The effect of such errors was evaluated in terms of altitude changesduring recovery and time to recover. There were 12 pilot-subjects who completed 8 unusual attitude recovery tasks. Results showed that CREs did occur, and there was a significant negative effect of these errors on absolute altitude change, but not on total recovery time. Results failed to show a decrease in the number of CREs occurring when using the HMD as compared with data from other studies that used an AI or a HUD. Results suggest that new HMD attitude symbology needs to be designed to help reduce CREs and, perhaps, SD incidences." Liggett, K,K., Reising, J.M., & Hartsock, D.C. (1999). Development and evaluation of a backgroimd attitude indicator. IntemationalJournal ofAviation Psychology, 9, 49-71. Livingstone, M., & Hubel, D. (1988). Segregation of form, color, movement, and depth: Anatomy, physiology, and perception. Science, 240, 740-749. Long, J. (2002). Heads up on heads-up: SDO hazards from moving tape HUD symbology. Flying Safety. Kirtland AFB, NM: Air Force Safety Center, 4-9. This article describes roll vection induced by HUD airspeed and altitude "tapes" moving in opposite directions during a rapid descent. Lyons, T.J., Ercoline, W.R., Freeman, J.E., & Gillingham, K.K. (1993). Epidemiology of United States Air Force spatial disorientation accidents: 1990-1991. In Aircraft accidents: Trends in aerospace medicine investigation techniques (AGARD CP 532:31-1 to 31-11). Neuilly Sur Seine, France: Advisory Group lor Aerospace Research and Development.
73
F33615-03-M-6360
Multisensory Integration for Pilot Spatial Orientation
"Spatial disorientation (SD) continues to be a contributing factor to a fairly constant proportion of military aircraft accidents. The United States Air Force (USAF) fielded a new accident investigation reporting form in July 1989, which for the first time specified SD Type 1, Type 2, and Type 3 m possible causes of aircraft accidents. Of a total of 91 major accidents that occurred over the2-year period beginning in October 1989, SD contributed significantly to 13 (14 percent). Although this percentage is hi^er than that reported in previous studies, the actual rate of SD accidents per 100,000 flying hours (.1843) is lower ttian previously reported. Type 1 SD was the cause of all 13 accidents; 9 of the 13 were fatal; 6 occurred in night or instrument meteorological condition (MC) conditions; and 11 involved cockpit attention problems, such as inattention, distraction, or channelized attention. Pilot inexperience did not appear to be a factor: average total flying time for die 13 pilots was 1,687 hours. Coding for SD on accident investigation reporting forms was not consistent. There were both individual differences between flight surgeons and pilots, and trends in reporting overtime. There is, however, a consensus that SD represents a major problem in military aviation. A scientific approach to this important problem would be facilitated if agreement could be reached on definitional and semantic issues." Lyons, T.J., Ercoline, W.IL, Freeman, J.E., & Gillingham, K.K. (1994). Classification problems of U.S. Air Force spatial disorientation accidents, 1989-91. Aviation, Space, and Environmental Medicine, 65,147-152. Statistics for SD accidents and illusions, but inconsistent reporting makes it difficult to state the magnitude of specific issues. Macurdy, J.T. (1934); Disorientation and vertigo, with special reference to aviation. British Journal of Psychology, 25,42-54. Malinin, I., Ercoline, W.R., Previc, F.H., & Malinina, H. (2000). The consequences of adding runway symbology to the head-up display. Presented at the Spatial Disorientation Symjposium, 15-17 November, 2000, San Antonio, TX. Found at: http://www.spatiald.wpafb.af.mil/ Primary%20Flight%20Displays/malininr.pdf While the focus of this presentation was on CFIT accident prevention using HUD symbols, it offers a taxonomy of a pilot's processing of flight symbology to maintain spatial attitude awareness during IFR and VFR flight. McCarley, J.S., Wickens, CD., Goh, J., & Horrey, W.J. (2002), A computational model of attention/situation awareness. In Proceedings of the 4