THE
ROYAL
SOCIETY
OF
MEDICINE
Volume 99
September 2006
Diabetes management in the USA and England: comparative analysis of national surveys Arch G Mainous III 1 Charles J Everett 3
Vanessa A Diaz 2 Sonia Saxena 5 Richard Baker 7 Richelle J Koopman 4 Azeem Majeed 6
J R Soc Med 2006;99:463–469
SUMMARY Objectives To compare diabetes management in adults between England and the United States, particularly focusing on the impact of a universal access health insurance system. Design Analysis of the nationally-representative surveys Health Survey of England, 2003 (unweighted n =14 057) and the National Health and Nutrition Examination Survey, 2001–2002 (unweighted n =5411). Setting and participants Adults 20–64 years of age; individuals 465. Main outcome measures Glycaemic, lipid and blood pressure control and medication use among individuals with previously diagnosed diabetes. Results Among those aged 20–64 the prevalence of diagnosed diabetes was lower in England (2.7%) than in the USA (5.0%). The proportion with diabetes receiving treatment was similar for the two countries. However, the mean HbA1c in England was 7.6%: in the USA it was 7.5% for those with insurance and 8.6% for those without insurance. The proportion of individuals on ACE inhibitors in England was 39%: in USA it was 39% for those with insurance, and 14% for those without. Conclusions Individuals in a healthcare system providing universal access have better managed diabetes than those in a market based system once one accounts for insurance.
In 2003, 20.1% of adults aged 18–64 (35.9 million people) in the USA reported that they had no health insurance.1 The lack of health insurance by a substantial proportion of the population has brought calls for a system of universal access to healthcare, and suggestions of the need to examine the performance of countries health systems in other countries for potential lessons to improve the USA healthcare system.2–4
1
Professor, 2Assistant Professor, 3Research Associate, 4Assistant Professor,
Department of Family Medicine, Medical University of South Carolina, Charleston, South Carolina, USA; 5Lecturer, 6Professor, Department of Primary Care and Social Medicine, Imperial College, London; 7Professor, Department of Health Sciences, University of Leicester, Leicester, UK Correspondence to: Arch G. Mainous III PhD E-mail:
[email protected]
The USA and the UK are similar in many ways. However, in terms of healthcare there is a substantial difference between the countries with the universal access to care in the UK provided via the National Health Service (NHS) versus the market-based approach in the USA. Although some recent studies have compared healthcare activity in the US Health Maintenance Organization, Kaiser Permanente, to the NHS, these studies have been criticized on methodological grounds. In addition, there is a potential biases when comparing a privately insured population in the USA with the universal coverage provided by the NHS to all sections of the population in the UK.5–8 Diabetes mellitus is a common and potentially disabling chronic disease.9 People with diabetes are at an increased risk for a number of complications including retinopathy, renal disease and heart disease.10 The American Diabetes Association in the USA and Diabetes UK in the UK, as well as the National Service Framework for Diabetes in the UK, has recommended monitoring diabetes and its complications through the use of periodic tests as well as appropriate management once complications are identified.11–13 Relatively few studies have used a cross-national comparison focusing on specific disease areas such as diabetes, particularly with clinical indicators. The purpose of this study was to compare indices of diabetes management between the market-based healthcare system of the USA and the universal access healthcare system in England using nationally representative data.
RESEARCH
JOURNAL OF
METHODS
The data used for the present study come from the National Health and Nutrition Examination Survey (NHANES), 2001–2002, and the 2003 Health Survey for England (HSE). The NHANES 2001–2002 is a nationally representative sample of the non-institutionalized USA population. The NHANES design includes an over-sampling of minorities and an ability to make population estimates. The HSE is an annual survey based on a nationally representative, probability sampling design for England. The individuals included in this study were aged 20 years and older. This age range was selected because it corresponded to that previously used in national estimates
463
JOURNAL
OF
THE ROYAL
SOCIETY OF
MEDICINE
of diabetes prevalence in the USA.14 A total of 5.411 unweighted participants were included in the NHANES 2001–2002. The 2003 HSE included 14 057 unweighted participants. Variables
464
Previously diagnosed diabetes: A diagnosis of diabetes was assessed by asking if a doctor has ever told the respondent that he or she has diabetes. This categorization has been used in previous studies.15,16 This question was included in both surveys. At the time of the study, England and the USA used identical criteria for the diagnosis of diabetes, a fasting plasma glucose of 7.0 mmol/L. Undetected elevated blood glucose: Both the NHANES and HSE used high performance liquid chromatography (HPLC) methods to measure haemoglobin A1c (HbA1c) although they did not use the same machine. Data from a study of 10 different laboratories indicates that laboratories that use HPLC methods tend to have small variations between them suggesting general comparability in the values.17 These findings are similar to results found in several different countries.18,19 The use of HbA1c as a population screener for diabetes has shown significant utility and may work as a screener with a conservative estimate of the prevalence of diabetes.20 Hanson et al.21 showed that fasting plasma glucose and HbA1c are similar in predictive ability for the detection of non-insulin-dependent diabetes mellitus (NIDDM) as defined by World Health Organization criteria. HbA1c has been used as a population-based screener for diabetes in several studies.16,22 HbA1c of less than 6.1% has been considered normal in the UK since 1993.13,23 Also, an HbA1c of 6.1% or above has been shown to carry a much greater annual risk for the development of diabetes.24 Following Rohlfing’s work,20 we define potentially undetected elevated blood glucose as HbA1C greater than 6.1% among those who denied a previous diagnosis of diabetes and were not on insulin or oral agents. Age at diagnosis: The age at which patients were diagnosed with diabetes was available in both surveys. Current treatment: Among those with diagnosed diabetes, the use of insulin or oral medication for diabetes treatment was available in both surveys, and calculated from separate variables for each treatment. Because of the importance of nephropathy as a potential complication of diabetes, and the effectiveness of ACE inhibitors as treatment for the progression of microalbuminuria to nephropathy, we also evaluated the proportion with diagnosed diabetes currently on ACE inhibitors.25,26 Control of diabetes: We examined glycaemic, lipid and blood pressure control according to prevailing standards in the USA and England at the time of data collection. As with
Volume
99
September
2006
all of the control measures, the American Diabetes Association standards of medical care released in 2000 were considered appropriate for the USA because of the 2001–2002 data collection time frame.11 For England and the 2003 HSE, the UK Diabetes standards from 2000, and the National Institute of Clinical Excellence (NICE) standards from 2002 if they differed from the UK Diabetes 2000 standards, were used as guides for appropriate standards.12,13,27,28 Among those previously diagnosed with diabetes, we assessed elevated HbA1c as representative of glycaemic control. We examined HbA1c as a continuous variable as well as glycaemic control, which was defined as HbA1c 57% in the USA and 57.5% in England. Blood pressure was assessed three to four times in an examination by trained personnel in both the NHANES and the HSE. For blood pressure we used the mean of these readings. US diabetes patients were considered to have elevated blood pressure when the mean systolic blood pressure greater than 130 mm Hg or diastolic blood pressure greater than 85 mm Hg. In England, mean systolic blood pressure greater than 140 mm Hg or diastolic blood pressure greater than 80 mm Hg was considered elevated. The non-fasting total cholesterol was collected in both the NHANES and the HSE and was available for analysis. Although total cholesterol is not a specific target for control in the USA it is incorporated into diabetes management targets in the UK. Total cholesterol control was defined as total cholesterol 55.2 mmol/L in the USA and 55 mmol/L in England. Insurance: Individuals in the NHANES were asked several questions regarding health insurance. For the general characterization of the population we subdivided the population into those with public insurance, those with private insurance or no insurance. This was later characterized simply as having health insurance or not. Although more than 10% in the UK have some form of private medical insurance to supplement care from the NHS, since the NHS provides universal access supplemental insurance was not considered and everyone was considered to have insurance. 29 Sociodemographic characteristics: Several relevant sociodemographic characteristics were also assessed in the NHANES and the HSE. These include age, gender, body mass index (BMI) and income. BMI was derived from height and weight measurements (kg/m2) collected in the physical examination. Because of the evidence that suggests that access to care is a significant barrier in healthcare delivery independent of socioeconomic status, we utilized the information contained in the NHANES and the HSE regarding self-reported annual income. To standardize the monetary information across the countries we multiplied British pounds by a constant of 1.54 which was the
JOURNAL OF
THE
ROYAL
SOCIETY
prevailing exchange rate on 1 January 2003. Additionally, both surveys provided income estimates standardized to represent poverty levels. The NHANES contains a measure of the poverty income ratio and the HSE contains equivalent incomes which adjust for McClements household score (i.e. dependent on number, age and relationships of adults and children in the household). Analysis plan
We used SAS callable SUDAAN software to take the complex sample design used in the NHANES into account in the analysis. Our analysis incorporated both the stratification and clustering aspects of the sampling design. The proper weighting procedures include adjustments for the basic probability of selection and the adjustments for non-response and post-stratification. Since minorities were oversampled, and a complex sampling design was employed, sampling weights provided by the NHANES were used to compute population estimates based on weighted parameter estimates and standard errors. We used SAS software for analysis of the HSE. Our analysis incorporated the sample weights recommended to account for an individual’s probability of selection and nonresponse. Analyses were performed for individuals 20–64 years of age. A second set of analyses were computed comparing the
OF
MEDICINE
Volume 99
September 2006
USA and England among 465 year olds. This second set of analyses involving an older age category was undertaken because individuals 465 are eligible for Medicare, a publicly funded universal access healthcare system in the USA. Thus, the 20–64 age comparison provides populationbased evidence of a US market-based healthcare system and a universal access system in England. The 465 year age group comparison allows for a potentially comparable comparison in terms of access to care between the USA with England, because of the universal access through Medicare in the USA and the National Health Service in the UK. RESULTS
The characteristics of individuals in the USA and England aged 20–64 and 65 years and older are shown in Table 1. Although the characteristics of the two countries exhibit many similarities, among individuals 20–64 as well as those 465 years, the prevalence of diagnosed diabetes is less in England than in the USA. The undetected elevated blood glucose may provide an indication of the amount of undiagnosed diabetes in the population and, therefore, detection differences in the two populations. The prevalence of diagnosed diabetes is lower in England than in the USA among 20–64 year olds: the absolute proportion of the population with likely
Table 1 Characteristics of the population in the USA and England Individuals aged 20–64
Individuals 65 and older
USA
England
USA
England
40.0
41.4
74.8
74.5
Male
48.9
49.7
41.6
43.6
Female
51.1
50.3
58.4
56.4
NonHispanic white
69.6
89.9
83.5
97.1
NonHispanic black
11.7
2.5
7.9
1.2
Other
18.7
7.6
8.6
1.7
28.0
26.9
28.0
27.8
5US$20 000
16.5
18.3
33.4
60.6
4US$20 000
83.5
81.7
66.6
39.4
Public
10.9
100
100
100
Private
69.0
None
20.1
Age, mean (years) Gender (%)
Race (%)
Body mass index, mean (kg/m 2 ) Annual income (%)
Insurance (%)
Diagnosed diabetes (%)
5.0
2.7
15.2
9.7
Without diagnosed diabetes with HbA1c46.1% (%)
2.2
1.5
5.7
6.6
465
JOURNAL
OF
THE ROYAL
SOCIETY OF
MEDICINE
Volume
99
September
2006
Table 2 Comparison of the management of diagnosed diabetes among 20-64 year olds USA insurance USA total
With
Without
England total
Age of diagnosis Mean (years)
40.4
40.7
38.1
40.7
HbA1c Mean (%) In control (%)
7.7
7.5
8.6
7.6
48.9
50.2
39.9
56.7
5.5
5.4
6.2
5.3
47.5
46.8
51.9
39.5
Total cholesterol Mean (mmol/L) In control (%) Blood pressure (BP) Systolic BP (mm Hg)
466
126.6
126.3
128.4
136.5
Diastolic BP (mm Hg)
72.8
72.5
74.6
74.7
In control (%)
59.3
59.9
55.5
55.4
undetected diabetes is smaller in England than in the USA. However, adding the undetected proportion to the diagnosed prevalence in England (4.2%) was still less than the diagnosed prevalence in the USA of 5.0%. Further, in the USA minorities account for a larger proportion of the population than in England. Among individuals 20–64 years old in the USA, 16% of nonHispanic whites, 22% of nonHispanic blacks, and 35% of individuals classified as ‘other’ race/ethnicity did not have health insurance. Table 2 presents a comparison of treatment and diabetes control among those aged 20–64 years with diagnosed diabetes. The proportion with diabetes in the USS who did not have insurance was 12.3%. Of these, 9.4% of nonHispanic whites, 12.3% of nonHispanic blacks and 17.9% of individuals categorized as ‘other’ did not have health insurance. Although mean levels of biomarkers for glycaemic and lipid control are similar for the total country estimates, uninsured individuals in the USA do worse. In terms of control, the pattern suggests that patients in England are more under control according to their country specific standards for care. When we examined the glycaemic control of some vulnerable populations like nonwhite minorities and low income individuals, patients in England showed patterns similar or better than that of vulnerable populations in the USA with insurance. The results for nonwhite patients with diabetes in the USA and England indicated that for these individuals 20–64 years of age in the USA, the mean HbA1c was 8.0% with 43.7% in control. In England, the mean HbA1c for nonwhites aged 20–64 years of age with diabetes was lower than in the USA with a mean of 7.4% and 56.0%
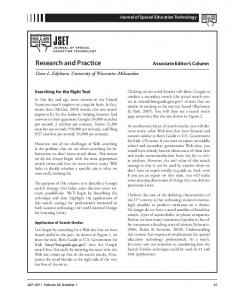
in control. Among nonwhite individuals in the USA with insurance the mean HbA1c was 7.9% (44.6% in control) and 8.6% for those without insurance (39.2% in control). For income 5US dollars 20 000 / year, individuals aged 20–64 in the USA, the mean HbA1c was 7.6% with 48.9% in control. In England, the mean HbA1c for individuals with income 5US dollars 20 000 / year was lower than in the USA with a mean of 7.4% and 59.1% in control. Among low income individuals in the USA with insurance the mean HbA1c was 7.3% (51.2% in control) and 8.4% for those without insurance (42.4% in control). Because average income levels may differ in the two countries and not represent poverty, we also examined glycaemic control among individuals aged 20–64 in the lowest quartile of the poverty income ratio in the USA and the lowest quartile of equivalent income in England. Among individuals in the lowest quartile in the USA with insurance the mean HbA1c was 7.7% (47.6% in control) and 8.3% for those without insurance (42.8% in control). Individuals in England in the lowest quartile of equivalent income had a mean HbA1c of 7.5% with 56.0% in control. The proportion being treated is similar between the USA and England when comparing countrywide totals (Figure 1). However, the pattern suggests that individuals in the USA who do not have insurance do less well in comparison to others in the US who are insured or to people in a national health system with universal access as practiced in the UK. Significantly fewer uninsured persons with diabetes took insulin or oral medications. In addition, among USA patients, uninsured persons not on medication for their diabetes had significantly higher HbA1c (8.9%) than insured persons with diabetes not on medication (6.1%).
JOURNAL OF
THE
ROYAL
SOCIETY
OF
MEDICINE
Volume 99
September 2006
Figure 1 Use of insulin or oral medication and use of ACE inhibitors among 20–64 year olds who have diagnosed diabetes
Table 3 indicates that individuals in the USA and England 465 years of age have similar levels of glycaemic control. DISCUSSION
The results of this comparison of diabetes management available in the USA and in England suggest a lower prevalence of diagnosed diabetes in England, but similar patterns of treatment and absolute levels among 20–64 year olds with diagnosed diabetes. However, individuals without insurance cover in the USA exhibit a pattern of lower proportions on treatment and worse control. This study suggests that a nationwide system of universal access to care is a viable way to deliver care for a chronic disease like diabetes thereby providing adequate care to all of the citizens. This pattern held for the vulnerable populations of minorities and the poor. Although minorities do less well in both countries than the aggregate nationwide estimates, minorities in England have estimates closer to the nationwide estimates. Minorities in the USA have higher mean HbA1c than their counterparts in England and 56% of minorities in England have appropriate glycaemic control while only 39% of uninsured minorities in the USA are under control. Individuals 65 years and older in both countries have universal access and have generally similar patterns of
control of their diabetes. The data support the Institute of Medicine’s report on the impact on health outcomes of a lack of insurance and seem to indicate a benefit on a countrywide scale of universal access to healthcare in terms of management of a chronic disease like diabetes.30
Table 3 Comparison of the management of diagnosed diabetes among 465 year olds, all with access through Medicare or the National Health Service USA
Age of diagnosis Mean (years)
58.7
England
64.9
HbA1c Mean (%)
7.0
7.2
63.0
66.6
5.0
5.3
57.1
42.1
Systolic BP (mm Hg)
137.7
143.6
Diastolic BP (mm Hg)
62.1
69.9
In control (%) Total cholesterol Mean (mmol/L) In control (%) Blood pressure (BP)
36.9
45.2
Use of insulin or oral medication (%)
In control (%)
84.2
77.1
Use of ACE inhibitors (%)
45.1
49.2
467
JOURNAL
468
OF
THE ROYAL
SOCIETY OF
MEDICINE
The USA has a variety of healthcare insurance systems in place in its market-based structure. Costs of services and types of services covered vary widely. However, the current results indicate that the 20% of the population who do not have any insurance do worse, and that addressing this issue of access to care is possible on a national basis. These data suggest that if healthcare coverage of the entire population is a societal goal then a nationwide universal access system may be an effective delivery system for covering the total population. In addition to providing universal access to care, a nationwide coordinated healthcare system can implement quality improvement programme initiatives for chronic diseases such as diabetes similar to that seen in the NHS with the Quality and Outcomes Framework. 31 There are several strengths to this study. First, this is one of the first cross-national comparisons of nationally representative data on management and control of disease. This study focused on individual level data and included clinical outcomes and indicators of diabetes control. Second, although the healthcare delivery systems in the USA and England differ, at the time of the study England and the USA used identical criteria for the diagnosis of diabetes—a fasting plasma glucose of 7.0 mmol/L. Moreover, the variables included in both data sets allowed for direct comparisons between the two populations. There are several limitations to this study that should be noted. First, although diagnostic criteria in the two countries were similar and we were able to examine the same measures of control of diabetes, the treatment goals did differ somewhat between the two countries. Thus, the patients in England were more likely to be in control but the goals were less stringent than those in the USA (e.g. control of HbA1c 57.5% in England, HbA1c57% in the USA). Second, much like previous comparisons of the NHS to Kaiser Permanente and Medicare, because of the unique sampling frames and survey designs used by the NHANES and the HSE we were limited to evaluating patterns between the countries.5,6 However, the findings do point to the value of comparing health care systems and show the disparities between the insured and the uninsured in the USA, a distinction that is not relevant in a universal access healthcare system. Third, the data for this study come from surveys undertaken prior to the major experiment in improving quality of care found in the 2004 Quality and Outcomes Framework in the NHS.31 Thus, the control of diabetes in England may differ from the current findings and be even better. The findings do, however, indicate the benefits of access to care in comparison to another health care system. Fourth, neither the NHANES nor the HSE distinguishes type 1 from type 2 diabetes in the question of whether the patient had been previously diagnosed with diabetes. Although, the study is focused on adults this may
Volume
99
September
2006
have affected the results if one country had a different case mix of diabetes. Despite the differences in the healthcare systems of the UK and USA, many of the measures of care were similar for the UK sample and for the USA sample with insurance. This suggests that access to health coverage is a key determinant of quality of care for a chronic condition such as diabetes. The general clinical outcomes of diabetes management were also similar even though the USA spending on healthcare is much higher than the UK spending. Hence, for chronic diseases such as diabetes that can be largely managed without inpatient care, a system like the NHS that provides universal coverage free at the point of use, may be substantially more cost effective than the more mixed system found in the USA. Acknowledgments This study was supported in part by grants 1D12HP00023 from the Health Resources and Services Administration; grant 1 P30 AG21677 from the National Institute on Aging; and grants 1 R21 DK067130 and 1R21 DK066066 from the National Institute of Diabetes and Digestive and Kidney Disease. Competing interests
None declared.
REFERENCES
1 Cohen RA, Coraty-Nelson Z. Health Insurance Coverage: Estimates From The National Health Interview Survey, 2003. June 2004[http:// www.cdc.gov/nchs/nhis.htm] 2 Shaw JC Oh. Canada: comparing single-payer health care with practice in the United States. Am J Med 2005;118:1064–6 3 Brown LD. Comparing health systems in four countries: lessons for the United States. Am J Public Health 2003;93:52–6 4 Light DW. Universal health care: lessons from the British experience. Am J Public Health 2003;93:25–30 5 Feachem RG, Sekhri NK, White KL. Getting more for their dollar: a comparison of the NHS with California’s Kaiser Permanente. BMJ 2002;324:135–41 6 Ham C, York N, Sutch S, Shaw R. Hospital bed utilisation in the NHS, Kaiser Permanente, and the US Medicare programme: analysis of routine data. BMJ 2003;327:1257 7 Himmelstein DU, Woolhandler S. Getting more for their dollar: Kaiser v the NHS. Price adjustments falsify comparison. BMJ 2002;324:1332 8 Talbot-Smith A, Gnani S, Pollock AM, Gray DP. Questioning the claims from Kaiser. Br J Gen Pract 2004;54:415–21 9 Harris MI, Flegal KM, Cowie CC, et al. Prevalence of diabetes, impaired fasting glucose, and impaired glucose tolerance in US adults. Diabetes Care 1998;21:518–24 10 Eastman RC, Javitt JC, Herman WH, et al. Model of complications of NIDDM. II. Analysis of the health benefits and cost-effectiveness of treating NIDDM with the goal of normoglycemia. Diabetes Care 1997; 20:735–44 11 American Diabetes Association. Standards of medical care for patients with diabetes mellitus. Diabetes Care 2000;23:S32–42 12 Department of Health. National Service Framework For Diabetes: Standards. London: DoH, 2001 [http://www.doh.gov.uk/nsf/diabetes/pdfs/ diabetesnsf.pdf]
JOURNAL OF
THE
ROYAL
SOCIETY
13 Diabetes UK. Recommendations for the Management of Diabetes in Primary Care, 2nd edn, revised. London: Diabetes UK, 2000 [http:// www.diabetes.org/clinicalrecommendations/Supplement101/S33.htm] 14 Cowie CC, Rust KF, Byrd-Holt D, et al. Prevalence of diabetes and impaired fasting glucose in adults—United States, 1999–2000. MMWR 2003;52:833–7 15 Mainous AG III, Koopman RJ, Gill JM, Baker R, Pearson WS. The relationship between continuity of care and diabetes control: evidence from the Third National Health and Nutrition Examination Survey. Am J Public Health 2004;94:66–70 16 Koopman RJ, Mainous AG III, Baker R, Gill JM, Gilbert GE. Continuity of care and recognition of diabetes, hypertension and hypercholesterolemia. Arch Intern Med 2003;163:1357–61 17 Italian Society of Diabetology. Risultati dello studio pilota sul controllo di qualita’ del dosaggio dell’emoglbina glicosilata. Diabete 1994;6:89–92 18 Weykamp CW, Penders TJ, Muskiet FAJ, van der Slik W. Glycohemoglobin: comparison of 12 analytic methods, applied to lyophilized haemolysates by 101 laboratories in an external quality assurance programme. Ann Clin Biochem 1993;30:169–74 19 John WG. Performance of glycated haemoglobin analysis: data from the UK national external quality assessment scheme (UK NEQAS). Biochim Clin 1989;13(suppl 8):253 20 Rohlfing CL, Little RR, Wiedmeyer HM, et al. Use of GHb (HbA1C) in screening for undiagnosed diabetes in the U.S. population. Diabetes Care 2000;23:187–91 21 Hanson RL, Nelson RG, McCance DR, et al. Comparison of screening tests for non-insulin-dependent diabetes mellitus. Arch Intern Med 1993; 153:2133–40
OF
MEDICINE
Volume 99
September 2006
22 Park PJ, Griffin SJ, Sargeant DM, Wareham NJ. The performance of a risk score in predicting undiagnosed hyperglycemia. Diabetes Care 2002;25:984–8 23 Guidelines for good practice in the diagnosis and treatment of NIDDM. Report of a Joint working Party of the British Diabetic Association, The Research Unit of the Royal College of Physicians and the Royal College of General Practitioners. J R Coll Physicians Lond 1993;27:259–66 24 Edelman D, Olsen MK, Dudley TK, Harris AC, Oddone EZ. Utility of hemoglobin A1c in predicting diabetes risk. J Gen Intern Med 2004;19:1175–80 25 American Diabetes Association. Standards of medical care for patients with diabetes mellitus. Diabetes Care 1999; 22: S32-41 26 American Diabetes Association. Standards of medical care in diabetes. Diabetes Care 2004;27:S15–35 27 National Institute for Clinical Excellence. Management of type 2 diabetes. Management of blood glucose. Inherited Clinical Guideline G. London: NICE, 2002 [http://www.nice.org.uk] 28 National Institute for Clinical Excellence. Management of type 2 diabetes. Management of blood pressure and blood lipids. Inherited Clinical Guideline H. London: NICE, 2002 [http://www.nice.org.uk] 29 Private Medical Insurance UK Market Sector Report. London: Laing & Buisson, 2001 [http:www.laingbuisson.co.uk] 30 Institute of Medicine. Care Without Coverage: Too Little, Too Late. Washington: National Academy Press, 2002 31 Roland M. Linking physicians’ pay to the quality of care—a major experiment in the United Kingdom. N Engl J Med 2004;351:1448–54
469