Bulk metallic glasses (BMGs) have recently gained popularity due to the
development of ... glass formation ability that allow the processing of bulk
specimens.
Copyright(c)JCPDS-International Centre for Diffraction Data 2001,Advances in X-ray Analysis,Vol.44
RESIDUAL STRESSES IN TUNGSTEN / BULK METALLIC GLASS COMPOSITES Danut Dragoi1, Ersan Üstündag1,†, Bjørn Clausen1 and Mark A. M. Bourke2 (1)
Department of Materials Science, California Institute of Technology, Pasadena, CA 91125, USA (2) Manuel Lujan, Jr. Neutron Scattering Center, Los Alamos National Laboratory, Los Alamos, NM 87545, USA ABSTRACT Bulk metallic glasses (BMGs) have recently gained popularity due to the development of new alloys that yield a glassy structure even with “conventional” metal processing such as casting. The unique properties of BMGs potentially place them among significant engineering materials: very high strength (1.9 GPa) and fracture toughness (40-55 MPa.m1/2), a near theoretical specific strength, excellent wear and corrosion resistance, and a high elastic strain limit (up to 2%). Composites made of BMG matrices reinforced with metallic fibers (e.g., tungsten) have been shown to be superior to monolithic BMGs. However, the thermal expansion mismatch between the fibers and the matrix generate thermal residual stresses. Time-of-flight (TOF) neutron powder diffraction offers a unique tool to determine these stresses/strains in the fibers. Strain data obtained along the fibers and in the transverse direction are presented as a function of fiber content. The data analysis technique (Rietveld refinement) showed that there is severe texture in the fibers. Experimental data are then compared to an analytical calculation using the Eshelby method which also allows the prediction of the residual stresses in the glass matrix. INTRODUCTION Although metallic glasses have been made since 1960s, specimen dimensions were previously limited to tens of µm due to the very fast cooling rates (about 106 to 1012 K/s) needed in order to prevent crystallization. Recently, multicomponent alloys have been developed with exceptional glass formation ability that allow the processing of bulk specimens. One of the most successful bulk metallic glass (BMG) alloy series (Zr-Ti-Cu-Ni-Be) has been developed at Caltech [1]. These alloys form glass at critical cooling rates as low as 1 K/s allowing the casting of specimens up to 5 cm in diameter. The ability to prepare large specimens has permitted the bulk characterization of these materials using more “traditional” techniques. The unique properties of BMGs potentially place them among significant engineering materials: very high strength (1.9 GPa) and fracture toughness (40-55 MPa.m1/2), a near theoretical specific strength, excellent wear and corrosion resistance, and a high elastic strain limit (up to 2%) [2, 3]. A major drawback of BMGs is that they fail catastrophically by forming localized shear bands. To avoid this and to obtain more damage tolerant BMGs, they are reinforced with fibers or particulates [4, 5, 6]. These studies demonstrated that the composite approach could be quite beneficial. The reinforcements interact with the shear bands and act as obstacles against their propagation. Even in high rate dynamic deformation, the addition of reinforcements causes the development of multiple shear bands, thus increasing the amount of strain accommodated by the †
Corresponding author; electronic mail:
[email protected].
1681
This document was presented at the Denver X-ray Conference (DXC) on Applications of X-ray Analysis. Sponsored by the International Centre for Diffraction Data (ICDD).
This document is provided by ICDD in cooperation with the authors and presenters of the DXC for the express purpose of educating the scientific community. All copyrights for the document are retained by ICDD. Usage is restricted for the purposes of education and scientific research. DXC Website – www.dxcicdd.com
ICDD Website - www.icdd.com
Copyright(c)JCPDS-International Centre for Diffraction Data 2001,Advances in X-ray Analysis,Vol.44
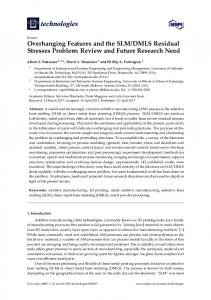
material [5]. Despite these significant improvements, there are a number of unresolved fundamental issues about how exactly the reinforcements interact with the shear bands. In addition, the ‘best’ reinforcement and its morphology are yet to be identified. A critical issue in the BMG-matrix composites is the presence of thermal residual stresses due to the coefficient of thermal expansion (CTE) mismatch between the matrix and the reinforcements. Since these stresses are predicted to reach several hundred MPa [4], they are expected to significantly influence the mechanical behavior of the composite. For instance, tensile residual stresses in the reinforcement will be beneficial in tension as cracks (or shear bands) will be attracted towards regions in tension increasing the probability of being blunted or stopped by the reinforcement. The goal of this work is to assess the thermal residual stresses/strains in BMGs and their composites using neutron powder diffraction (NPD). It is part of a systematic study of the interactions between the matrix and reinforcements in BMG composites. EXPERIMENTAL PROCEDURE Unidirectional tungsten (W) fibers of about 250 µm in diameter were used as inclusions in a BMG alloy in four volume fractions: 20, 40, 60 and 80%. The processing technique was melt infiltration casting and is described elsewhere [7]. The presence of heavy elements such as Zr, Ni and W precludes the use of low-energy X-ray diffraction to determine the residual stresses in the reinforcements. For this reason, the diffraction experiments were conducted on the Neutron Powder Diffractometer at the Los Alamos Neutron Science Center (LANSCE). This facility uses spallation neutrons and the time-of-flight (TOF) technique [8] which means that entire diffraction patterns (for a certain range of d-spacings) are measured simultaneously by, in this case, two detector banks at scattering angles of plus and minus 90°. The diffraction data were analyzed using the Rietveld refinement technique [9, 10]. Fig. 1 shows schematically the geometry of the experiment conducted at LANSCE. The incident “white” neutron beam is at 45° from the surface of the sample. The diffracted neutrons are detected simultaneously in two detectors, bank 3 at 2θ=+90° (diffracting vector perpendicular to the fiber) and bank 4 at 2θ=– 90° (diffracting vector parallel to the fibers). In the Rietveld analysis, the following parameters were refined (in order): scale factor, background, lattice parameter, orientation distribution function (ODF) using harmonic functions for the texture, absorption, extinction, and atomic displacements (Uiso). All of these parameters are described elsewhere [11]. The ODF procedure for determining the Incident neutron beam preferred orientation factor is the pole distribution, which is the probability to α=45 find the diffracting vector along a given particular direction called the Diffracted neutron beam preferred orientation axis. The pole distribution function, as introduced by 2θ=-90 2θ=90 Bunge [12], is a sum of symmetrized spherical harmonics, which are Bulk metallic glass orthogonal functions. The order of the ODF harmonic functions, which is the Tungsten fiber number of terms in the sum of the symmetrized spherical harmonics, Figure 1. Schematic diagram for TOF neutron was a key factor to describe the diffraction of tungsten / bulk metallic glass composite. texture of the W in W/BMG
1692
Copyright(c)JCPDS-International Centre for Diffraction Data 2001,Advances in X-ray Analysis,Vol.44
1703
110
220 330
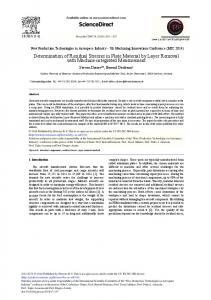
Figure 2. TOF neutron diffraction data of reference W fibers; diffraction vector was parallel to the fiber. A strong [hh0] texture can be observed. The second set of the tick marks correspond to the Al tube that held the fibers.
composites. As it is seen in Fig. 2, the W shows a very strong texture. Acid etching and scanning electron microscope pictures revealed an elongated grain structure in line with the texture seen in the TOF data. The Rietveld refinements confirmed the existence of a fiber texture. The results are shown in Table I. The symbol (||/⊥) in the header of some columns indicates that the two numbers in each cell refer to the directions parallel and perpendicular to the fiber, respectively. To quantify the experimental errors, especially the displacement error in the diffractometer, the 80% W composite was run five times. The results suggest that strain values are within ±1x10⁻⁴. The quality of the fits was quantified by the Rp (R-Bragg) parameter which was usually around 6% indicating good fits. The isotropic atomic displacement (Uiso), values were compared to calculated values for W obtained from the Debye equation [13] and were seen to be in good agreement. Table I. Rietveld refinement results obtained on W/BMG composites. Fiber Vol. Frac. %
W lattice parameter (||/⊥ ⊥) (Å)
Strain, (||/⊥ ⊥) (x10-6 )
100*Uiso (||/⊥ ⊥)
Rp, % (||/⊥ ⊥)
20
3.16554(1) 3.16765(5)
-1084 244
0.18 0.28
5.9 5.7
3.16704(3) 3.16714(4) 3.16897(7) 3.16687(7) 3.16605(4) 3.16688(5) 3.16897(8) 3.16687(5)
-612 84 -381 19 -198±91 141±80 0 0
0.25 0.27 0.23 0.31 0.24 0.25 0.24 0.30
5.6 5.0 6.3 5.5 6.7 6.4 6.0 7.7
40 60 80 100 (ref.)
Copyright(c)JCPDS-International Centre for Diffraction Data 2001,Advances in X-ray Analysis,Vol.44
1714
ESHELBY CALCULATIONS The Eshelby model [14] has traditionally been used in calculating residual and applied stresses in composites (see, e.g., [15]). It was originally developed for an infinite size sample that contains a single ellipsoidal inclusion, but was later improved to account for higher concentrations of inclusions via the mean field approach [16]. Although this new form of the model is not as accurate at high inclusion concentrations as it is at low ones, it can still be used to obtain approximate values for stresses/strains in composites. In the present study, it was assumed to be valid for all fiber concentrations. Since the NPD method could not be used to determine the strains in the BMG matrix directly, the Eshelby model presented a powerful means to calculate them using the measured strains in the W fibers. The following equation was used in this calculation [15,17]:
ε BMG ( f ) = f ( S − I ))[(CW − C BMG )( S + f ( I − S )) − C BMG ] CW (α BMG − α W )∆T −1
(1)
where, f is the fiber volume fraction, S is the Eshelby tensor (for infinite fiber geometry), CW and CBMG are the stiffness matrices of the fiber and the matrix (both assumed to be isotropic in this case), respectively, αBMG and αW are the CTEs of the two phases, I is the 6x6 unit matrix, ∆T is the temperature difference between the measurement temperature (25°C) and the temperature at which residual stress buildup starts during cooling ("freezing" temperature). ∆T was varied in the above calculation until a good fit to the neutron data was reached. In Fig. 3 two different ∆T values are shown: ∆T = 325°C which assumes that the glass transition temperature of the BMG alloy, Tg, (~350°C [1]), is the "freezing" temperature; and ∆T = 130°C obtained from the fit to the NPD data. Table II exhibits the values used in the Eshelby calculations. Table II. Material data used in the Eshelby model. Material
Young’s modulus, GPa
Poisson’s ratio
W
410
0.28
CTE (α) 10-6 /°C 4.5
BMG
96
0.36
9.0
500 0 -500
-6)
-1000 -1500 TOF data, longit.
-2000
TOF data, transv.
-2500
Eshelby, transv., dT=130
-3000
Eshelby, longit., dT=130
-3500
Eshelby, transv., dT=325
-4000
Eshelby, longit., dT=325
-4500 0
0.2
0.4
0.6
0.8
1
W volume fraction
Figure 3. Transverse and longitudinal strains measured by TOF-NPD and calculated using the Eshelby model for two different ∆T values.
Copyright(c)JCPDS-International Centre for Diffraction Data 2001,Advances in X-ray Analysis,Vol.44
The measured residual strains in W can be explained by the fact that its CTE is lower than that of BMG. When the composite is cooled from the "freezing" temperature, compressive axial residual strains will be generated in the fibers. The radial and hoop strains in W will also be compressive. This predicted strain state in the fibers is roughly confirmed by the NPD data (Fig. 3). Note that the measured average transverse strains are a combination of the radial and hoop strains in the fibers (= 2(εradial + εhoop)/π [18]). To balance the strains in the fibers, the matrix, on the other hand, will have tensile axial and hoop strains and compressive radial strains. When the Eshelby model was applied to the TOF data, it was observed that the measured strain values are usually much smaller than those predicted by taking the Tg as the "freezing" temperature (Fig. 3). In fact, a much smaller ∆T (~130°C) was found to fit the experimental data more closely. Assuming the Eshelby model is valid for all fiber volume fractions, this surprising result suggests that residual strain generation does not start at the Tg of the matrix, but it occurs at a lower temperature. The validity of this assumption was checked later [19] using viscosity data for BMG to determine the stress relaxation time as a function of temperature. It was seen that the BMG matrix practically behaved as an elastic solid just below its Tg. Therefore, the ∆T (~130°C) predicted by the Eshelby model seems to be too low. Therefore, although it correctly predicts the evolution of the thermal residual strains as a function of fiber volume fraction, the Eshelby model underestimates the "freezing" temperature in these composites. This failure of the model is probably due to its lack of consideration of the fiber-tofiber interactions present in the W/BMG composites. The Eshelby model was also used to 300 calculate the residual stresses in the two phases (Fig. 4). As expected, the 200 longitudinal stresses in the W drop as 100 its volume fraction increases. A reverse trend is observed in the BMG 0 matrix. Note that the transverse -100 stresses change, too, although on a much smaller scale. For instance, in -200 W-longit. the 20% W composite, the average W-transv. -300 axial stress in the fibers is about −300 BMG-long MPa while the same stress in the -400 BMG-trans matrix is about +80 MPa. In the 80% -500 W composite, these values are about −40 MPa and +170 MPa, -600 respectively. Of course, there will be 0 0.1 0.2 0.3 0.4 0.5 0.6 0.7 0.8 0.9 1 severe stress gradients in the matrix in W, volume frac the vicinity of fibers. These gradients Figure 4. Residual stresses in W and BMG as predicted are expected to interact strongly with by the Eshelby model. the shear bands. In conclusion, the TOF neutron diffraction method was shown to be useful in determining residual strain states deep inside W/BMG composites. It was observed that significant residual stresses/strains exist in these materials although their values were lower than expected. Current work involves the application of stress to monitor the in-situ mechanical behavior of the W fibers in order to understand the interactions between them and the matrix shear bands.
1725
Copyright(c)JCPDS-International Centre for Diffraction Data 2001,Advances in X-ray Analysis,Vol.44
ACKNOWLEDGEMENTS This study was supported by the Army Research Office (grant no. DAAD19-00-1-0379) and the National Science Foundation (CAREER grant no. 9985264). It also benefited from the national user facility at the Lujan Center supported by the Department of Energy under contract W-7405ENG-36. Helpful discussions with Dr. R. B. von Dreele (LANSCE) on the use of the GSAS program are appreciated. The authors would also like to express their gratitude to Prof. W. L. Johnson (Caltech) for providing the specimens and for insightful discussions on BMGs. REFERENCES 1. Peker, A. and Johnson, W. L., Appl. Phys. Lett., 1993, 63, 2342. 2. Gilbert, C. J., Ritchie, R. O. and Johnson, W. L., Appl. Phys. Lett., 1997, 71 (4), 476. 3. Bruck, H. A., Christman, T., Rosakis, A. J. and Johnson, W. L., Scripta Metall., 1994, 30, 429. 4. 5. 6. 7.
Conner, R. D., Ph. D. thesis, California Institute of Technology (1997). Conner, R. D., Dandliker, R. B. and Johnson, W. L., Acta Mater., 1998, 46 (17), 6089-6102. Choi-Yim, H. and Johnson, W. L., Appl. Phys. Lett., 1997, 71 (26), 3808. Dandliker, R. B., Conner, R. D., and Johnson, W. L., J. Mater. Res., 1998, 13 (10), 28962901.
8. Jorgensen, J. D., David, W. I. F., and Willis, B. T. M., International Tables for Crystallography, Vol. C, Mathematical, Physical and Chemical Tables, Ed. Wilson, A. J. C., Kluwer Academic Publishers, 1992, 87. 9. Rietveld, H. M., J. Appl. Cryst., 1969, 2, 65-71. 10. Larson, A. C. and von Dreele, R. B., GSAS-General Structure Analysis System, LAUR 86748, Los Alamos National Laboratory, 1986. 11. Young, R. A., The Rietveld Method, International Union of Crystallography, Oxford University Press, Oxford, U.K., 1996. 12. Bunge, H. J., Texture Analysis in Material Science, Butterworth, London, U.K., 1982. 13. Cullity, B. D., Elements of X-ray Diffraction, 2nd edition, Addison-Wesley, Reading, MA, 1978. 14. Eshelby, J. D., Proc. Roy. Soc., 1957, A 241, 376-396. 15. Withers, P. J., Stobbs, W. M. and Pedersen, O. B., Acta Metall., 1989, 37 (11), 3061-3084. 16. Pedersen, O. B., Acta Metall., 1983, 31, 1795. 17. Nemat-Nasser, S. and Hori, M., Micromechanics: Overall Properties of Heterogeneous Materials, 2nd edition, North Holland, 1999. 18. Clausen, B., Üstündag, E., Dragoi, D. and Bourke, M.A.M., to be submitted to Acta Mater., 2001. 19. Dragoi, D., Üstündag, E., Clausen, B. and Bourke, M.A.M., submitted to Scripta Mater., 2001.
1736