excitation of the lower levels of Zn and Cd atoms by monoenergetic electrons. ... a new mechanism is proposed for population of the levels in electron-atom ...
Resonance effects in inelastic collisions of slow electrons with cadmium and zinc atoms O. B. Shpenik, I. P. Zapesochnyi, V. V. Sovter, E.
E.
Kontrosh, and A. N. Zavilopulo
Uzhgorod State University (Submitted May 2, 1973) Zh. Eksp. Teor. Fiz. 65, 1797-1805 (November 1973)
A spectroscopic method has been used to make precision measurements of the cross sections for excitation of the lower levels of Zn and Cd atoms by monoenergetic electrons. In the excitation curves a large number of peaks of a resonance nature are observed which are due to cascade transitions or to decay of negative ions. In the excitation function of the 51 PI level of Cd, minima (antiresonances) are observed which coincide in energy with the location of resonances in the excitation functions of the 3 S 1 levels. A single-level Breit-Wigner formula has been used to describe the peaks near the threshold in the excitation functions of the deepest 3S 1 levels of Zn and Cd, and a new mechanism is proposed for population of the levels in electron-atom collisions.
Recently significant interest has arisen in the study of resonances in collisions of slow monoenergetic electrons with atoms and molecules. This is associated with the establishment and rapid development of a new direction in the physics of electron-atom collisions-the spectroscopy of negative ions. [1, 2J The most promising means of observing resonances in the total cross sections for excitation of levels is the spectroscopic method. The possibilities of this method have been demonstrated in several studies[3-6J in which the resonance nature of the excitation of certain levels of Hg, He, Ne, and Rb near threshold was established. The present article is devoted to the search for resonances in the total cross sections for electronic excitation of the lower levels of zinc and cadmium by means of precision measurements of the optical excitation functions of spectral lines. APPARATUS AND EXPERIMENTAL METHOD
The main parts of the experimental equipment consist of a large metal demountable vacuum chamber in which is located a miniature collision chamber (cell) filled with vapor of the metal being studied, an electron monochromator, an opticai system, and apparatus for detection of the radiation. Atoms of the substance being investigated are excited by collisions of electrons inside the collision chamber, while shaping of the electron beam and monochromatization by a 127° cylindrical electrostatic analyzer are accomplished outside the cell under high-vacuum conditions. The vapor-filled cell is prepared of stainless steel in the form of a parallelopiped inside which is made a channel 20 mm in diameter. On one end of the cell is mounted the electron monochromator, and on the other end the electron detector. To avoid interference from reflected and secondary electrons, the detector was made in the form of a deep Faraday cup and covered with aquadag. The vapor studied entered the cell through a vapor pipe from a separate reservoir. To avoid evaporation of metal onto the surfaces of the insulators of the electronic system and the window, the temperature of the collision chamber and the electron monochromator was maintained 15-20° above the temperature of the ampoule with the working substance, which determined the vapor pressure in the cell (and consequently also the concentration of atoms in the collision volume). Radiation of the atoms was observed at an angle of 90° to the electron beam direction. A high-aperture monochroma898
Sov. Phys.-JETP, Vol. 38, No.5, May 1974
tor type MDR-2 was used for spectral decomposition of the radiation. Detection of the radiation was accomplished by means of a photomultiplier counting individual photoelectro~s, with modulation of the light flux. The system for counting the photomultiplier pulses included a wideband amplifier, a pulse-height discriminator, a standardpulse shaper, an electronic switch, and two scalers. Modulation of the light flux was accomplished by blocking the electron beam by rectangular pulses symmetrical in time, with a frequency of 560 Hz, fed to the accelerating electrode of the electron monochromator. Pulses from the photomultiplier (selected FEU-18A tubes) were switched to two scalers synchronously with the electron beam modulation. A useful signal was separated from the total signal accumulated by the first scaling circuit by subtraction of the noise pulses accumulated by the second scaler. The current of exciting electrons to the collector was amplified by a narrow-band amplifier type V6-4, and the signal was then fed to an analog-to-digital converter where a proportional conversion was carried out of the amplitude of the alternating voltage to a number of pulses. These pulses were further amplified and detected by a separate scaler. The starting and stopping of all three scalers were strictly synchronized. The pulses in the radiation channel were counted until some fixed number of pulses in the current-detection channel was collected. Operation in this mode is equivalent to reducing the detected radiation to the same values of exciting electron current. The time resolution of the individualphotoelectron counting system was 1 IJ.sec or better. The sensitivity threshold of the electron current measurement channel was 1 x 10⁻¹⁰ A for an input impedance of 100 kn. The amplitude of the modulating pulses was 0-300 V. The rise and fall times of the pulses was 3 IJ.sec or less. The exposure time for the detected radiation was the same for different energies of the incident electrons for each individually recorded spectral line. It was chosen from the condition of accumulating that number of useful pulses whose statistical spread did not exceed 3% at the peak of the excitation functions. For lines of various intensities the exposure time varied from 1 to 10 min. The total time of measuring the excitation functions of one line was as high as 10-15 hours. Accordingly, we took measures for reliable stabilization of all the parameters of the equipment with time, and the measurements Copyright © 1975 American Institute of PhysiCS
898
TABLE I
Ele-I
IExcitation' three~Old,1
ment
Level
Cd
5'P, 5'P, 6'S, 7'S, 7'S. 8 'So S'D,>! 6 3 Dl'J.3
3,80 5,41 6,39 7,76 7.88 8,29 7,37 8.10
Transition measured I., A 16E. evl 3261(5 'So - 5 'P,) 2288 (5'S. --' 5'P,) 5086 (5 'P, - 6 'S,) 3133 (5 'p, -7 'S,) 5155 (5'P,-7 'So) 4307 (5'P,- 8 'So) 3610 (5'P,-5'D ...) 2980 (5'P, - 6 'D... )
Averaged location of peaks
Zn
4'P, 5·S. 6'S, 6'S. 4'D'23 5'Dlt.
4,03 6.66 8.11 8,18 7,78 8,50
3076 4811
:~1J18/35
5182 3345 2800
(4'So -4'P,) (4'P, -5'S.) (4'P.,-6'S.) (4'P, - 6'S.) (4'P, -4'D133) (4'P, - 5 'D,,,)
Averaged location of peaks
0,08' 0,08 0.08 0,08 0,08 0.08 0.08 0.08
Location of peaks E, eV
4.16 6,82
!4,16 0,0814.36 0,12 0,16 0,16 0.14 0,14
7,24' 7.24 7.38
7.95' 7.98 8.20 7,96 8,18 7.95 7.94
6.82! 7.241 7,38! 7.96
7.18
7.56
7.80
8,22
8,4D
9.38
8,19[8.3719.381 11.83
8,35 8.34 8.30
8,60
12,18 12,18
11.85 11.86 11.80 11.80
8.36 8.36
10,90 10.90 10.85 10,85
8.80 8.80
\4,3617,18\7,5617,80 18.22\8,33\8.60 !8.80
I
11.98 12.01)
I
11,99
12.18
11.30 11.25 11.25
11,8J
10,87 111,27 Itt.80
*-minima.
were begun after 4-5 hours of operation of all parts of the apparatus.
Qr----------------------------,
The measurements were made with a concentration of atoms in the cell no greater than 1 x 1014 cm-3 and an electron current density in the beam of less than 10-5 A/cm2 • The half-width of the electron energy distribution function was AE = 0.08 eV for study of most of the lines. Calibration of the electron energy was accomplished with an accuracy of ± 0.04 eV from the excitation threshold of the most intense lines Zn(;\,3076 A) and Cd(;\,3261 A) and from the shift in the volt-ampere characteristic of the electron current to the collector. EXPERIMENTAL RESULTS AND DISCUSSION In the course of a detailed study of the energy de-
pendence of the excitation cross sections of eight spectrallines of Cd and six lines of Zn, we obtained qualitatively new information on the mechanism of the inelastic process-the excitation by slow electrons of a number of the lower singlet and triplet S, P, and D levels of these atoms. In Table I we have collected the experimental results, and the excitation functions of the most interesting lines are shown in FigS. 1-6. Most of these curves have a large number of clearly separated and narrow resonance peaks whose energy width is no greater than the energy spread of the electrons. We can expect that their true width is still narrower. In addition to the resonances mentioned, the excitation curve for the resonance line of Cd ;\,2288 A reveals two distinct antiresonance dips.
A detailed analysis permits us to separate the extrema into two groups: 1) maxima which are a manifestation of cascade transitions, and 2) maxima and minima which directly reflect the complex nature of the population of the upper level of a given spectral line.
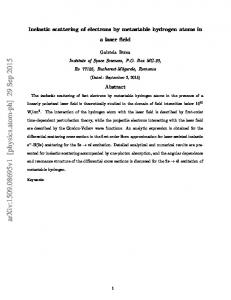
1.0 FIG. I. Energy dependence of the excitation cross sections for spectral lines ofed: I-X2288A(5 1 So-5 1 P.), 2-X326IA(5 1 So-5 3 P,}.
the Cd;\' 5086 A. line (correspondingly the peaks at E = 8.18 eV in the excitation function of the Cd ;\,3133 A line and also at E = 7.80 eV for the Zn ;\,4811 A line). Estimates show that the fraction of cascade population of the 63 S l level of Cd at E = 7.38 eV from 63 P Olll levels amounts to almost 60%. We note that, in addition to cascade transitions from the usual levels of Cd, in the excitation function of the ;\,3133 Aline there is a peak at E = 9.38 eV which may be due to cascade transitions from shifted 5p5p 3 P01 terms l ) (Similarly the peaks at E = 12.18 eV in the excitation functions of the other lines of Cd and at E = 11.80 eV for the ;\,5182 Aline of Zn are due in all probability to cascade transitions from the deepest Beutler levels, which lie above the ionization potential). 0
Assignment of certain peaks to the first group is indicated by such facts as the insignificant excess of the maximum pOint above the excitation energy of the levels from which cascade transitions are pOSSible, and the comparable cross sections for excitation of the corresponding lines. [7] To this group we assign the peaks at E = 7.38 eV and E = 8.20 eV in the excitation function of
All of the remaining peaks we assign to the second group, and from now on we will call them resonances. The first bell-shaped peaks at E = 6.82 eV and E = 7.18 eV in the excitation functions of the lines "-5086 A of Cd and ;\,4811 A of Zn and equally the narrower peaks in the excitation functions of the Zn and Cd lines, in view of their energy location2 ), indicate the existence of a complex nature of the excitation of the levels. The cause of the appearance of resonances we associate with the formation and subsequent decay of short-lived states of negative ions, which is substantiated by: a) the energy
899
0, B. Shpenik et al.
Sov. Phys.·JETP, Vol. 38, No.5, May 1974
899
Qr---------------------,
Qr----------------,
o o ~~~~~~~~~~~~ 8,0 J.O fD,O 11,0 12.0 E, eV
FIG. 4. Energy dependence of the excitation cross sections for spectrallines of Cd: I-XSISSA (SIP I -7 1S0 ), 2-M307A (SIP I -8 1S0 ). FIG. 2. Energy dependence of excitation cross sections of spectral lines of Cd: I-XS086A (S3P2-63S1)' 2-X3133A (S3P I -7 3Sd.
Q~----~------
Q,--------------,
!~J" JV -.AJv
E,eV
FIG. 5. Energy dependence of the excitation cross sections for spectral lines of Zn: I-M81IA (4 3P2-S3Sd, 2-X3076A (4 1Sii-4 3P 1).
Q
FIG. 3. Energy dependence of the excitation cross sections for spectrallines of Cd: I-X3610A (S3P 2-S 3D 123 ), 2-X2980A (S3P 2-6 3D 123 ).
agreement of these peaks in the excitation functions of the lines of other series (see Table I); b) their insignificant energy spread (less than 0.1 eV according to refs. 4 and 9). At the present stage of the investigations it is difficult to indicate nonambiguously specific levels of the negative ion (which are responsible for appearance of the resonances discussed); however, their energy locations obviously must be close [2J to the observed resonances. We note that the resonances at 11.83 eV in the excitation functions of the Cd lines and at 10.87 eV in the excitation functions of the Zn lines (see Table I) are located lower than the deepest Beutler terms of these elements. We can therefore assume that they are due to those negative ion states which are formed by addition of the incident electron to the electronic configuration of the deepest Beutler terms: 3d9 4s2 4p41 for Zn and 4d 9 5s2 5p 1 for Cd.
FIG. 6. Energy dependence of the cross sections for excitation of Zn spectral lines: I-X334SA (4 3P2 4 3D 123 ), 2-X2800A (4 3P2-S 3D 123 ).
z
4 4 ...............,.:!-'-'4L.U.~-'-'-'~U""O"'u 8,0 1.0 10.0 f/.O 12,0 E,eV
a clearly expressed phase opposition of extrema, with the energy widths coinciding. The existence of this phase opposition in the total cross sections for excitation of the levels is not accidental [10J but indicates the close relation between the excitation processes of the different energy levels. Such a phase opposition is perhaps due to the competition of two elementary processes: excitations of Cd atoms to the + 51 Pl state and formation of those states of the Cd- negative ion whose decay further populates the 63S1 state of the atom.
Let us turn our attention to an interesting result of our studies: In the excitation functions of the 6agl and 51 Pl levels of Cd at E = 7.24 eV and E = 7.96 eV there is
It is interesting to note that resonance effects and cascade transitions playa negligible role in population of the 43p~ and 53p~ levels of Zn and Cd, as indicated by the absence of extrema in the excitation functions of the resonance intercombination lines ;\3076 A of Zn and
900
O. B. Shpenik et al.
Sov. Phys.-JETP, Vol. 38, No.5, May 1974
900
;\3261 Aof Cd (see Figs. 1 and 5). Therefore we can assume that the excitation functions of these lines essentially reproduce the nature of the excitation of the levels mentioned above from the ground state of the atom. Proceeding from the suggestion made above that excitation of the levels occurs through an intermediate state of the negative ion, we used a single-level BreitWigner formula for description of the singularities in the cross sections for excitation of the 53 S1 levels of Zn and 63S1 and 51Pl levels of Cd in the near-threshold region. 3 ) Near the resonance the level excitation cross section Q is described by the following expression [12] : n ror, Q= k' (E-Ep)'+'/,(ro+I\)"
/J../O;l!cm'
'l to
E,eV
,
/
\":-"
7
IS
Ii
t
!(j
S
S
(1)
where r 0 is the partial width for decay of the negative ion into an electron and an atom in the normal state, r 1 is the partial width for decay of the ion into an electron and an atom in the 3S1 state, E is the incident electron energy, ~ is the energy of the intermediate state, and k is the wave number of the incident electron. The partial widths are related to the Wigner reduced widths y~ and y~ by the equations
Ii
7
0
s'so FIG. 8
FIG. 7
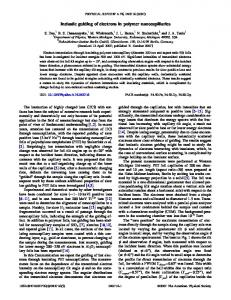
FIG. 7. Comparison of theoretical (solid curve) and experimental (points) data for excitation cross sections of 6 3 S t (I) and 51 PI (2) levels of Cd. The excitation curve of the 51 PI level is given in relative units. FIG. 8. Diagram of transitions in the Cd atom.
(2)
where k = v'2mE/li, kl = v'2m(E - EJ/li, and El is the threshold energy.
---L E,eV
I
TABLE II Excited level
I ~:
10"I~:X"'IE
X eV-cm
eV-cm
TABLE III P'
evi E
P
eV '
Excited level
I~: 10"I~:Xl0'" E,evIE"ev X eV-cm
eV-cm
P
For the first bell-shaped peak in the excitation curves 2.9 \ 3.;, 17.181 6.66 -,-,'s-',z-.n-+I-2-·,,--i-I-1.-~-j1-7-.0-~-j1-7-.3-6 5 S Zn I. of the 53S1 levels of Zn and 63S1 levels of Cd we obtained 6'S,Cd 2.9 2.8 il.7:; U.38 6'S,Cd 1.2 1." 7.21 I 7.16 Wigner reduced widths and improved the energy values of the compound states. The results are shown in Table Comparison of the experimental data near the resonII, together with the threshold energy values. Similarly, ance witn the calculation according to Eq. (6) is given in the theoretical estimates for the second narrower Fig. 7. The good agreement of the behavior of the theorresonance in the excitation functions of the levels disetical curve with experiment in the region of the anticussed have been collected in Table III. As a result of resonance indicates the existence of strong interference. substitution of the parameters of Tables IT and ITI into The divergence of the curves in the high energy region Eq. (1) we obtain for the 63S1 level of the Cd atom is evidently due to the crude approximation of the smoothly varying portion of the curve. 61l'1-6.38/E E= [ + 12.6l'1-7.16/E] .10 m2 3
(E-6.75)'+0.021E
-19
(E-7.24)'+0.0018E
[c
J.
(3)
A comparison of calculations based on Eq. (3) with experiment is given in Fig. 7. Let us turn now to discussion of the antiresonance in the excitation function of the 51p~ level of Cd. In a wide energy region from the reaction threshold Eth the relative excitation cross section of the smoothly varying part of the curve can be approximated by the straight line (4)
where c is a constant. In the case of interference between direct excitation of the Cd 51p~ level and the compound state of the Cdnegative ion at 7.24 eV, the following expression [12] is valid: n [ 2r(E-E p) Q='k' 2-2cos6(0)- (E-Ep)'+'/,rz sin26(0)
+
r'
(E-Ep)'+'/,r' cos 26(0)
]•
(5)
where 6 (0) is the phase shift. If we assume that cos 26(0) < 0, then near E = 7.24 eV, with allowance for Eqs. (4) and (5), we have 1.7 (1-7.16/E) 'I. Q=81 (E-E th ) - (E-7.24)'+0.0018E
901
Sov. Phys.-JETP, Vol. 38, No.5, May 1974
j
(6)
Thus, our analysis shows that the following mechanism exists for excitation of the 63 S1 and 51p~ levels of Cd. Direct excitation of the 6~1 level in this energy region is practically nonexistent (see the diagram in Fig. 8), while the 51p~ level is populated directly from the ground state. For electron energies from threshold to E = 7.16 eV, excitation of the 63S1 is accomplished only through the Cd- intermediate state, whose half-width amounts to 0.68 eV. The resonance peak at E = 7.24 eV appears as the result of population of the 63S1 level through the energetically higher intermediate Cd- state. Appearance of an antiresonance in the excitation curve of the 51p~ level is in turn a consequence of interference in the formation of Cd- (E = 7.24 eV) as the result of the two processes-the direct transition from the ground state of the Cd atom and through the resonance 51p~ level. The authors express their gratitude to E. P. Stakhno and N. N. Vasilevskil'for assistance in preparing the counting system for individual photoelectrons. t)Radiative transitions 5s5p3P~12 -SpSp 3 P OI (E =9.17 eV, E = 9.27 eV) were observed by Garton [8J in the cadmium arc spectrum. 2)They are located at energies lower than the neighboring levels from which cascade transitions are possible. 3)The possibility of applying this formula to electron-atom collisions was demonstrated for the metastable 2 3S 1 level of He. [11]
O. B. Shpenik et al.
901
lU. Fano and J. W. Cooper, Phys. Rev. 138, A400 (1965). 2 C. E. Kuyatt, J. A. Simpson, and S. R. Mielczarek, Phys. Rev. 138, A385 (1965). 3 I. P. ZapesochnYl and O. B. Shpenik, Zh. Eksp. Teor. Fiz. 50, 890 (1966) [Sov. Phys.-JETP 23, 592 (1966)]. 4 J. M. Kurepa, Doktorska dissertacija, Beograd, 1972. 5 E. Kisker, Z. Phys. 256, 121 (1972). 6 O. B. Shpenik, I. P. ZapesochnYl, V. V. Sovter, and N. N. Vasilevskil, Pyataya Vseosyuznaya konferentsiya po fizike elektronnykh i atomnykh stolknovenil (AllUnion Conf. on the Physics of Electronic and Atomic COllisions), Abstracts of Reports, Uzhgorod, 1972, p. 16. 7V. V. Sovter, I. P. ZapesochnYl, and O. B. Shpenik,
Optika i spektroskopiya 35, (1973) [Optics and Spectroscopy 35, in press] • 8 G. Garton, in "Na poroge v kosmos" (At the Threshold to Space), IIL, 1960, p. 218. 9 H. G. M. Heideman, W. Van Dalfsen, and C. Smit, Physic a 51, 215 (1971). 10 J. Arol Simpson, G. E. Chamberlain, and S. R. Mielczarek, Phys. Rev. 139, A1039 (1965). 11 E. Barranger and E. Gerjuoy, Phys. Rev. 106, 1182 (1967). 12 Ta-You Wu and T. Ohmura, The Quantum Theory of Scattering, Russ. trans!., Nauka, 1969.
902
o. B. Shpenik et at
Sov. Phys.·JETP, Vol. 38, No.5, May 1974
Translated by C. S. Robinson 184
902