128 sized image and covers a patch of roughly 8 square kilometers. This is ... 2) Standard Deviation: It is the square root of the variance of the distribution and is ...
Priti Maheshwary et. al. / International Journal of Engineering Science and Technology Vol. 2(9), 2010, 4306-4311
Retrieval of Remote Sensing Images Using Color, Texture and Spectral Features PRITI MAHESHWARY Research Scholar, Department of Computer Application, Maulana Azad National Institute of Technology, Bhopal, MP, India.
NAMITA SRIVASTAVA Department of Mathematics, Maulana Azad National Institute of Technology, Bhopal, MP, India. Abstract: The remote sensing images are increasing day by day therefore storage and retrieval of these images is of significant importance. In this paper a prototype model for retrieval of remote sensing images on the basis of color moment and gray level co-occurrence matrix feature is developed and different vegetation index feature is extractor as color, texture and spectral. These three features plays important role in determining contents in remote sensing images. The results obtained are promising and these results can further be used for detecting change in different areas of remote sensing images. Keywords: Remote Sensing Image Retrieval, NDVI, Clustering. 1 Introduction The volume of remotely sensed image continues to grow at an enormous rate due to advances in sensor technology for both high spatial and temporal resolution. NASA Earth Observing System (EOS) is projected to receive one terabyte of image data per day when it is fully operational. Existing information systems allow formulating only simple queries based on sensor type, geographical location, and date of capture. The information contained in simple queries is often less relevant than the content of the remote sense image because of this the retrieved remote sensing the images are not that relevant. Therefore new technologies are needed to easily and selectively access the information contents from the image archives to increase the actual exploitation of satellite observations. One way to solve this problem is to describe the images keywords. However, this requires manual classification of images, which is not practical as databases contains thousands of images and also the size of the database is growing day by day. Another problem is incompleteness of a limited set of keyword descriptors. It significantly reduces query effectiveness. Content Based Image Retrieval (CBIR) is a set of techniques for retrieving semantically relevant images from an image database based on automatically derived image features [1]. Content Based Image Retrieval may be used for retrieving remote sensing images from the database. Digital image consists of discrete picture elements called pixels. Associated with each pixel is a number represented as Digital Number (DN) that depicts the average radiance of relatively small area within a scene. The range of DN values being normally 0 to 255. As the pixel size is reduced more scene detail is preserved in digital representation. In CBIR features are extracted from every image on the basis of its pixel values and comparison is done on the basis of defined rules. These features become the image representation for measuring similarity with other images in the database. By calculating the differences in the feature images are compared and then retrieved. Early CBIR methods used global feature extraction to obtain the image descriptors. QBIC [2], developed at the IBM Almaden Research Center, extracts several features from each image, namely color, texture and shape of the image. These descriptors are obtained globally by extracting information on the means of color histograms for color features; global texture information on coarseness, contrast, and direction; and shape features about the curvature, moments invariants, circularity, and eccentricity. Photo-book-system [3], Visual-Seek [4], and Virage [5], also uses global features to represent image semantics.
ISSN: 0975-5462
4306
Priti Maheshwary et. al. / International Journal of Engineering Science and Technology Vol. 2(9), 2010, 4306-4311 In this paper we have developed a prototype for retrieving Remote Sensing Images based on the content of it. In Section 2 we discuss the methodology and in Section 3 and 4 experimental setup and the results obtained are discussed respectively. 2. Methodology Traditionally, satellite image classification is done on the basis of pixels. LISS III image has 23.5m resolution, a 128 × 128 sized image and covers a patch of roughly 8 square kilometers. This is too large an area to represent precise ground segmentation, but our focus is on building a querying and browsing system rather than showing exact boundaries between classes. The images are divided into rectangular patches which make it very convenient for feature extraction as well as browsing. In our prototype system a query image is taken and then images similar to the query images are found on the basis of color, texture and vegetation index similarity. The system performs three main tasks. They are 1) Color Moment Feature Extraction 2) Grey Level Co-Occurrence Matrix (GLCM) Texture Feature Extraction 3) NDVI Calculation.4) Retrieval of the query image from the database. 2.1 Color Moment Feature Extraction The Color Moment is calculated by calculating 1) Mean 2) Standard Deviation and 3) Skewness. The ith color channel at the jth image pixel is defined as pij. The three color moments are defined as: 1) Mean: It is the average color value in the image and is calculated as j 1
Ei N
1 Pij N
2) Standard Deviation: It is the square root of the variance of the distribution and is calculated as
1
j 1
i pij Ei 2 N N 3) Skewness: It is the measure of the degree of asymmetry in the distribution and is calculated as
1 si 3 N
j 1
p
ij
N
3 Ei
Our system calculates these features and stores them in the feature database. 2.2 Glcm Texture Feature Extraction Grey-Level Co-occurrence Matrix texture measurements have been the workhorse of image texture since they were proposed by Haralick in the 1970s [6]. It calculates 1) Contrast 2) Correlation 3) Energy 4) Homogeneity 5) Entropy. This calculation uses only the values in the GLCM. i)
Contrast
Contrast
N 1
P i j
i , j 0
ii) Correlation
Correlation
N 1
P
i , j 0
ISSN: 0975-5462
2
ij
ij
i j 2
4307
Priti Maheshwary et. al. / International Journal of Engineering Science and Technology Vol. 2(9), 2010, 4306-4311 iii) Energy
Energy
N 1
P
i , j 0
2
ij
iv) Homogeneity
Homogeneity
N 1
Pij
1 i j
i , j 0
v) Entropy
Entropy i 0
N 1
N 1 j 0
2
Pij XLog Pij
These features are calculated with distance 1 and angle 0, 45 and 90 degrees and stored in feature database. 2.3
Normalized Difference Vegetation Index
Spectral feature is used to measure the information among different bands. The most universally used Landsat TM image has seven bands, and each has corresponding application field. These bands can be used individually or in combination of different bands to form some useful features. The most useful and widely used features are multispectral feature vegetation index, and normalized difference of vegetation index (NDVI). The NDVI is calculated as
NDVI
DN Infra DN Re d
DN Infra DN Re d
DNInfra is the gray of infrared band (the fourth band of TM image), DNRed is the gray of red band (the third band of TM image). 2.4 Similarity Matching Many similarity measures have been developed for extracting features from an image. The most commonly used techniques are Euclidean distance and Manhattan distance. The Euclidean distance is calculated as
d
n
x i 1
i
yi
2
The Manhattan distance is calculated as n
d xi y i i 1
In our prototype system Manhattan distance is used for calculating the distance between data points because it gives better results due to its grid property. 3. Experimental Plan For our experiments, we have used 2 LISS III + multi-spectral satellite images with 23.5m resolution. Three semantic categories namely fields, water, and vegetation have been used for experiment. In consultation with an expert, we choose near-IR (infra-red), red and green bands as the three spectral channels for classification as well as for displaying the retrieved images. The reason for this is that near-IR band is selected over blue band because of a somewhat inverse relationship between a healthy plant’s reflectivity in near-IR and red, i.e., healthy vegetation reflects high in near-IR and low in red. Near-IR and red bands are important for establishing difference between vegetation types and states. Blue light is very abundant in the atmosphere and is diffracted all over the place therefore it create noise and is often avoided. Visible green is used because it is less noisy and provides unique information compared to Near IR and red.
ISSN: 0975-5462
4308
Priti Maheshwary et. al. / International Journal of Engineering Science and Technology Vol. 2(9), 2010, 4306-4311 The pixels dimensions of each satellite image are used in our experiments are 5760x3597.The choice patch size is critical. A patch should be large enough to encapsulate the visual features of a semantic category, while being small enough to include only one semantic category in most cases. We choose patch size 128×128 pixels as used in SIMPLicity [7]. 2800 patches are obtained from an image. These patches are stored in a database along with the identity of their parent images and the relative location within them. The retrieval results for various categories are shown in Figure 1, 2 and 3.
Figure 1: Retrieval Result for Vegetation Class
Figure 2: Retrieval Result for Water Class
ISSN: 0975-5462
4309
Priti Maheshwary et. al. / International Journal of Engineering Science and Technology Vol. 2(9), 2010, 4306-4311
Figure 3: Retrieval Result for Field Class
The evaluation of the different trial runs is done using precision/recall criteria. Recall and Precision are set based measures. They evaluate the quality of an unordered set of retrieved images [8]. Recall is a measure of the ability of a system to present all relevant images and is calculated as Recall =
Number of Relevant images Retrieved Number of Relevant Images in the database
Precision is a measure of the ability of a system to present only relevant images and is calculated as Precision =
Number of Relevant images Retrieved Total Number of Retrieved Images
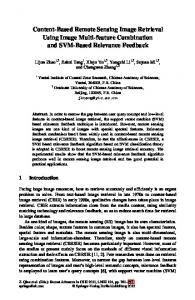
The result of Precision and Recall Graph is shown in Figure 4 and 5.
Precision Graph 0.8 0.7 0.6 0.5 0.4 0.3 0.2 0.1 0
Field Vegetation Water
Figure 4: Precision Graph
ISSN: 0975-5462
4310
Priti Maheshwary et. al. / International Journal of Engineering Science and Technology Vol. 2(9), 2010, 4306-4311
Recall Graph 0.7 0.6 0.5 0.4 0.3 0.2 0.1 0
Field Vegetation Water
Colormoment
GLCM
NDVI
All
Figure 5: Recall Graph
4. Conclusion In this paper we have developed a prototype system for retrieving contextually similar remote sensing images for a given query images. For our experiments, we have used 2 LISS III + multi-spectral satellite images with 23.5m resolution. The pixels dimensions of each satellite image are used in our experiments are 5760x3597.The choice patch size is critical as it should be large enough to encapsulate the visual features of a semantic category. Three semantic categories namely fields, water, and vegetation have been used for experiments. It is clear that color moment and vegetation index gives good result than GLCM. Precision and recall graph shows that combining all features i.e. color moment, GLCM and NDVI gives better results. 5. References [1] [2]
Li, J., Wang, J. Z. and Wiederhold, G., “Integrated Region Matching for Image Retrieval,” ACM Multimedia, 2000, p. 147-156. Flickner, M., Sawhney, H., Niblack, W., Ashley, J., Huang, Q., Dom, B., Gorkani, M., Hafner, J., Lee, D., Petkovic, D., Steele, D. and Yanker, P., “Query by image and video content: The QBIC system,” IEEE Computer, 28(9), 1995,pp.23-32 [3] Pentland, A., Picard, R. and Sclaroff S., “Photobook: Content based manipulation of image databases”, International Journal of Computer Vision, 18(3), 1996, pp.233–254 [4] Smith, J.R., and Chang, S.F., “Single color extraction and image query,” In Proceeding IEEE International Conference on Image Processing, 1997, pp. 528–531 [5] Gupta, A., and Jain, R., “Visual information retrieval,” Comm. Assoc. Comp. Mach., 40(5), 1997, pp. 70–79 [6] R. M. Haralick, K. Shanmugam, and I. H. Dinstein, "Textural Features for Image Classification," Systems, Man and Cybernetics, IEEE Transactions on, vol. 3, pp. 610-621, 1973. [7] J. Z. Wang, J. Li, and G. Wiederhold, SIMPLIcity: Semantics-Sensitive Integrated Matching for Picture Libraries, IEEE Trans. Patt. Anal. Mach. Intell., vol. 23, pp. 947-963, 2001. [8] Common evaluation measures by Trec-Evaluation Report. [9] Eka Aulia, “Hierarchical Indexing for Region based image retrieval”, A thesis Submitted to the Graduate Faculty of the Louisiana State University and Agricultural and Mechanical College. [10] Shi, J., and Malik, J., “Normalized Cuts and Image Segmentation,” Proceedings Computer Vision and Pattern Recognition, June, 1997, pp. 731-737 [11] Smith, J., “Color for Image Retrieval”, Image Databases: Search and Retrieval of Digital Imagery, John Wiley & Sons, New York, 2001, pp.285-311 [12] Zhang, R. and Zhang, Z., (2002), “A Clustering Based Approach to Efficient Image Retrieval,” Proceedings of the 14th IEEE International Conference on Tools with Artificial Intelligence, pp. 339.
ISSN: 0975-5462
4311