ORIGINAL RESEARCH published: 25 July 2017 doi: 10.3389/fnins.2017.00426
Revisiting the Neural Basis of Acquired Amusia: Lesion Patterns and Structural Changes Underlying Amusia Recovery Aleksi J. Sihvonen 1, 2*, Pablo Ripollés 3, 4, 5 , Antoni Rodríguez-Fornells 3, 4, 6 , Seppo Soinila 7 and Teppo Särkämö 2 1 Faculty of Medicine, University of Turku, Turku, Finland, 2 Cognitive Brain Research Unit, Department of Psychology and Logopedics, Faculty of Medicine, University of Helsinki, Helsinki, Finland, 3 Cognition and Brain Plasticity Group, Bellvitge Biomedical Research Institute (IDIBELL), L’Hospitalet de Llobregat, Barcelona, Spain, 4 Department of Cognition, Development and Education Psychology, University of Barcelona, Barcelona, Spain, 5 Poeppel Lab, Department of Psychology, New York University, New York, NY, United States, 6 Catalan Institution for Research and Advanced Studies, Institució Catalana de Recerca i Estudis Avançats (ICREA), Barcelona, Spain, 7 Division of Clinical Neurosciences, Turku University Hospital and Department of Neurology, University of Turku, Turku, Finland
Edited by: Daniela Sammler, Max Planck Institute for Human Cognitive and Brain Sciences (MPG), Germany Reviewed by: Anne Caclin, Institut National de la Santé et de la Recherche Médicale, France Philippe Albouy, McGill University, Canada *Correspondence: Aleksi J. Sihvonen
[email protected] Specialty section: This article was submitted to Auditory Cognitive Neuroscience, a section of the journal Frontiers in Neuroscience Received: 12 April 2017 Accepted: 11 July 2017 Published: 25 July 2017 Citation: Sihvonen AJ, Ripollés P, Rodríguez-Fornells A, Soinila S and Särkämö T (2017) Revisiting the Neural Basis of Acquired Amusia: Lesion Patterns and Structural Changes Underlying Amusia Recovery. Front. Neurosci. 11:426. doi: 10.3389/fnins.2017.00426
Although, acquired amusia is a common deficit following stroke, relatively little is still known about its precise neural basis, let alone to its recovery. Recently, we performed a voxel-based lesion-symptom mapping (VLSM) and morphometry (VBM) study which revealed a right lateralized lesion pattern, and longitudinal gray matter volume (GMV) and white matter volume (WMV) changes that were specifically associated with acquired amusia after stroke. In the present study, using a larger sample of stroke patients (N = 90), we aimed to replicate and extend the previous structural findings as well as to determine the lesion patterns and volumetric changes associated with amusia recovery. Structural MRIs were acquired at acute and 6-month post-stroke stages. Music perception was behaviorally assessed at acute and 3-month post-stroke stages using the Scale and Rhythm subtests of the Montreal Battery of Evaluation of Amusia (MBEA). Using these scores, the patients were classified as non-amusic, recovered amusic, and non-recovered amusic. The results of the acute stage VLSM analyses and the longitudinal VBM analyses converged to show that more severe and persistent (non-recovered) amusia was associated with an extensive pattern of lesions and GMV/WMV decrease in right temporal, frontal, parietal, striatal, and limbic areas. In contrast, less severe and transient (recovered) amusia was linked to lesions specifically in left inferior frontal gyrus as well as to a GMV decrease in right parietal areas. Separate continuous analyses of MBEA Scale and Rhythm scores showed extensively overlapping lesion pattern in right temporal, frontal, and subcortical structures as well as in the right insula. Interestingly, the recovered pitch amusia was related to smaller GMV decreases in the temporoparietal junction whereas the recovered rhythm amusia was associated to smaller GMV decreases in the inferior temporal pole. Overall, the results provide a more comprehensive picture of the lesions and longitudinal structural changes associated with different recovery trajectories of acquired amusia. Keywords: music, amusia, stroke, recovery, voxel-based morphometry, voxel-based lesion-symptom mapping
Frontiers in Neuroscience | www.frontiersin.org
1
July 2017 | Volume 11 | Article 426
Sihvonen et al.
Neural Basis of Acquired Amusia
INTRODUCTION
images, and evaluates the presence or absence of lesion in each voxel to finally associate this information with the behavioral data. Previous studies investigating the neural basis of acquired amusia have been limited to symptom-led and lesion-led studies of individual cases or small patient groups (Kester et al., 1991; Liegeois-Chauvel et al., 1998; Ayotte et al., 2000; Schuppert et al., 2000; Rosslau et al., 2015; for a review see Stewart et al., 2006). Recently, we utilized VLSM in a sample of 77 stroke patients from two Finnish cohorts (from Helsinki and Turku) to map the lesioned brain regions specifically associated with acquired amusia (Sihvonen et al., 2016). The results revealed that damage to the right STG, middle temporal gyrus (MTG), insula, and putamen form the crucial neural substrate for acquired amusia. In addition, we performed longitudinal VBM analyses on the Helsinki cohort, which showed that patients with non-recovered (persistent) amusia had greater GMV decrease (i.e., atrophy) in the right STG and MTG and white matter volume (WMV) decrease in the right MTG over a 6-month follow-up compared to non-amusic patients. Additionally, in a more recent paper, insular stroke lesions were associated with musical short-term memory deficits (Hirel et al., 2017). In this study, we aim to extend and replicate the previous findings by utilizing a longitudinal design (acute and 6month post-stroke) in a pooled cohort of altogether 90 stroke patients drawn from two independent cohorts (Helsinki, N = 47 and Turku, N = 43). Specifically, by applying VLSM on the pooled data and comparing non-amusic, recovered amusic, and non-recovered amusic patients, we sought to determine (i) which acute stage lesions would predict later recovery from amusia using VLSM with data from both cohorts (N = 90). Moreover, using longitudinal VBM analyses, we sought to determine (ii) whether the difference in GMV reported for non-recovered amusics vs. non-amusics in the Helsinki cohort (Sihvonen et al., 2016) would be replicated in the Turku cohort (N = 43) and (iii) whether the pooled data would show additional regions associated with amusia and also pinpoint regions specifically associated with amusia recovery. Furthermore, we aimed to (iv) provide more accurate outlook on gray and white matter changes associated with pitch and rhythm amusia. Based on our previous findings (Sihvonen et al., 2016), we hypothesized that lesions giving rise to acquired amusia would comprise at least the right basal ganglia, superior/middle temporal regions, and insula. We also hypothesized that in addition to the right temporal/subcortical areas also inferior frontal and parietal regions, especially in the right hemisphere, would be associated with amusia and its recovery. Furthermore, based on our previous results, we hypothesized that the right temporal GMV decreases would locate more posteriorly in pitch amusia and more anteriorly in rhythm amusia.
The perception and experience of music in the healthy brain is based on the functioning of a large-scale bilateral neural network comprising temporal, frontal, parietal, cerebellar, and subcortical areas (Schmithorst, 2005; Brattico et al., 2011; Alluri et al., 2012; Zatorre and Salimpoor, 2013; Koelsch, 2014). In amusia, the ability to perceive music is impaired by either abnormal brain development (congenital amusia) or brain tissue damage (acquired amusia). While congenital amusia is generally described as a deficit in processing pitch—arguably due to an impairment of pitch perception and/or pitch-specific short-term or working memory—the processing of musical rhythm, timbre, and emotions can be affected as well (Stewart et al., 2006; Marin et al., 2012; Tillmann et al., 2015, 2016; Peretz, 2016; Whiteford and Oxenham, 2017). The majority of the neuroimaging studies examining defective music processing in the brain have been carried out on congenital amusia, a condition affecting 2–4% of the population (Kalmus and Fry, 1980; Henry and McAuley, 2010). In contrast, acquired amusia is a relatively common disorder after a middle cerebral artery (MCA) stroke, with incidence ranging from 35 to 69% (Ayotte et al., 2000; Schuppert et al., 2000; Särkämö et al., 2009; Sihvonen et al., 2016). Evidence derived from MRI morphometry studies, utilizing e.g., voxel-based morphometry (VBM; Ashburner and Friston, 2000), an automated method for analyzing gray matter and white matter differences between groups or across time, has implicated reduced white matter concentration in the right inferior frontal gyrus (IFG; Hyde et al., 2006; Albouy et al., 2013) and right superior temporal gyrus (STG; Albouy et al., 2013) in congenital amusics. Additionally, the cortex in both of these areas have been shown to be thicker in congenital amusic subjects than in controls (Hyde et al., 2007). However, the reported results have been contradictory regarding laterality of the observed effect: a recent study showed that congenital amusics had decreased gray matter volume (GMV) in the left IFG and STG with no differences observed in the right homologous areas (Mandell et al., 2007). Taken together, these findings suggest that congenital amusia may be a somewhat heterogeneous condition (Omigie et al., 2012). The two types of amusia, acquired and congenital, may have partly distinct neural basis. Congenital amusia is a developmental deficit and thus impedes acquiring musical syntax (Stewart, 2008), whereas acquired amusia represents a shift from a normal to deficiently functioning music processing system caused by a brain lesion. Studying brain lesions and associated cognitive deficits is essential in uncovering crucial brain regions that are causally connected (Rorden and Karnath, 2004). This can be achieved by voxel-based lesion-symptom mapping (VLSM), which is an advanced MRI analysis method investigating the relationship between focal brain damage and behavioral data on a voxel-by-voxel basis (Bates et al., 2003). Compared to the traditional lesion-led or symptomled approaches, VLSM allows both binary and continuous analyses and does not require patient grouping by lesion site. VLSM utilizes three-dimensional lesion maps formed from MRI
Frontiers in Neuroscience | www.frontiersin.org
MATERIALS AND METHODS Subjects and Study Design Subjects (N = 100) were acute stroke patients enrolled in two music intervention studies in Helsinki and Turku, Finland. Fifty
2
July 2017 | Volume 11 | Article 426
Sihvonen et al.
Neural Basis of Acquired Amusia
patients were recruited during 2004–2006 from the Department of Neurology, Helsinki University Central Hospital (HUCH) and 50 patients during 2013–2015 from the Department of Clinical Neurosciences, Turku University Hospital (Tyks). All patients had an MRI-verified acute ischemic stroke or intracerebral hemorrhage in the left (N = 49) or right (N = 51) hemisphere and subsequent cognitive and/or motor deficits, and they were all right-handed. Patients with hearing loss, prior neurological or psychiatric disease, or substance abuse were not included. All subjects gave written informed consent in accordance with the Declaration of Helsinki. The protocol was approved by the Ethics Committees of the HUCH and the Hospital District of Southwest Finland. All patients received standard medical treatment and rehabilitation for stroke. In both studies, all subjects underwent an MRI within 3 weeks of the stroke onset (acute stage) and at 6-month post-stroke stage. Behavioral assessment was performed at the acute and 3-month post-stroke stages. Out of the 100 recruited patients, 90 patients completed the 6-month MRI follow-up (Helsinki N = 47, Turku N = 43) and were included in the present study. The demographic and clinical characteristics of the patients are presented in Table 1.
widely used, gold standard method for diagnosing amusia. MBEA was assessed at the acute stage and at the 3-month post-stroke stage as a part of a larger neuropsychological testing battery. The average score of the Scale and Rhythm subtests of MBEA was utilized as an index of overall music perception (referred to hereafter as MBEA total score). Following the cut-off values of the original MBEA (Peretz et al., 2003) applied in our previous studies (Särkämö et al., 2009; Sihvonen et al., 2016), patients with the MBEA total score NRA) × Time (6 months > Acute) contrasts were calculated. Rhythm and pitch amusia were evaluated using preceding contrasts but with pNRA, pRA, and pNA, and rNRA, rRA, and rNA groups. Results were thresholded at a whole-brain uncorrected p < 0.005 at the voxel level (extent threshold: k > 100 voxels). Only clusters surviving an FWEcorrected p < 0.05 threshold are reported. Neuroanatomical areas were identified using the Automated Anatomical Labeling Atlas (Tzourio-Mazoyer et al., 2002) included in the xjView toolbox
Voxel-based morphometric analysis was carried out using SPM8 software. Our original VBM study was based on the Helsinki cohort (N = 47), which is included in the present study. Therefore, in the current study with a higher statistical power, VBM was carried out using both the replication cohort (Turku; N = 43) and the combined Helsinki-Turku cohort (N = 90). The preprocessed GM and WM images were entered into a second-level analysis using a Group (NA/RA/NRA) × Time (Acute/6 months) mixed between-within subjects analysis of
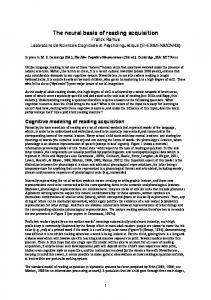
FIGURE 3 | Acute stage VLSM results for scale and rhythm amusia: pooled analysis. Continuous analyses of (A) MBEA Scale score and (B) MBEA Rhythm score. (C) is an overlap image comparing Rhythm (red) and Scale (blue) subtests’ continuous results. Neurological convention is used with MNI coordinates at the bottom left of each slice. All statistical maps are thresholded at an FDR-corrected p < 0.05 threshold. Critical brain structures are labeled. CAU, Caudate; GP, globus pallidus; HIP, hippocampus; IFG, inferior frontal gyrus; INS, insula; MTG, middle temporal gyrus; PUT, putamen; STG, superior temporal gyrus.
Frontiers in Neuroscience | www.frontiersin.org
6
July 2017 | Volume 11 | Article 426
Sihvonen et al.
Neural Basis of Acquired Amusia
stringed statistical criteria (p = 0.005 uncorrected), the NRAs showed a distinct lesion pattern in the right STG, IFG, and insula compared to the RAs (Figure 2D). Separate continuous VLSM analyses for the acute stage MBEA Scale and Rhythm scores indicated largely overlapping results (Figure 3). In both analyses, lesion patterns comprised right temporal (STG, MTG) and subcortical (caudate, putamen, globus pallidus) as well as the right hippocampus, insula, and IFG. Overlaying both results revealed that the lesion pattern associated with pitch amusia extended more anterolaterally compared to the rhythm amusia lesion pattern (Figure 3C). The present results extend our previously published results showing that—in addition to the right temporal, insular, and subcortical regions—stroke lesions associated with amusia comprise the right IFG and hippocampus. Additionally, in the current study with a higher statistical power, lesions comprising the left IFG were associated with less severe and transient amusia.
(http://www.alivelearn.net/xjview/). In addition to the previously determined covariates (education and lesion size), a covariate for the scanner was added in the gray and white matter VBM analyses, since the Turku and Helsinki patients were scanned with two different MRI scanners.
RESULTS Voxel-Based Lesion-Symptom Mapping: Pooled Cohort Amusia In the continuous acute stage VLSM analysis of all subjects (combined Helsinki–Turku cohort), low acute stage MBEA total scores were associated with a lesion area comprising the right temporal (STG, MTG), and subcortical (caudate, putamen, globus pallidus) regions as well as the right IFG, hippocampus and insula (Figure 2A). In the binary acute stage VLSM analyses, a direct comparison between the non-recovered amusic (NRA) and non-amusic (NA) patients yielded essentially the same results (Figure 2B). In contrast to this extensive right hemispheric lesion pattern, a comparison between the recovered amusics (RAs) and NAs showed a smaller lesion localized at the left IFG (Figure 2C). Comparison between the NRAs and RAs did not yield any significant effects using the FDR-correction, but with slightly less
Voxel-Based Morphometry: Replication Cohort Longitudinal VBM analyses using the replication (Turku) cohort revealed similar results as our previously published study utilizing the Helsinki-cohort: Non-recovered amusia was
TABLE 2 | Gray matter volume decreases (6-month stage—acute stage) in amusia: pooled analysis. 6 MONTHS > ACUTE Condition
Figure 4 panel
Non-amusic > Non-recovered amusic
A
Area name
Coordinates
Cluster size
t-value
Right hippocampus
23 −13 −17
1,33,258
5.49*
8,913
4.43*
11,739
3.33*
Right superior temporal gyrus (BA 22, 38) Right heschl’s gyrus (BA 42)
63 −38 −12
Right inferior temporal gyrus (BA 20, 21)
64 −14 −23
Right precentral gyrus (BA 6)
Recovered amusic > Non-recovered amusic
B
C
64 −14 10
Right middle temporal gyrus (BA 19, 21, 22, 37, 39) Right insula (BA 13)
Non-amusic > Recovered amusic
54 3 −8
44 −1 −4 54 −6 7
Right middle frontal gyrus (BA 10)
31 65 7
Right inferior frontal gyrus (BA 44)
55 13 9
Right superior parietal lobule (BA 7)
21 −73 55
Right inferior parietal lobule (BA 40)
46 −63 43
Right putamen
18 13 −7
Right caudate
9 12 9
Right thalamus
21 −28 14
Right amygdala
23 −1 −17
Right parahippocampal gyrus (BA 35)
31 −38 −14
Right inferior parietal lobule (BA 40)
60 −31 46
Right postcentral gyrus (BA 2)
64 −28 35
Right inferior frontal gyrus (BA 47)
34 20 −16
Right superior Temporal Gyrus (BA 22, 38)
53 −43 10
Right middle Temporal Gyrus (BA 21)
63 −31 −18
Right inferior Temporal Gyrus (BA 20, 21)
61 −41 −21
*p < 0.005 FWE-corrected at the cluster level. BA, Brodmann area.
Frontiers in Neuroscience | www.frontiersin.org
7
July 2017 | Volume 11 | Article 426
Sihvonen et al.
Neural Basis of Acquired Amusia
Voxel-Based Morphometry: Pooled Cohort
associated with greater GMV decreases in the right STG and MTG, pitch amusia with GMV decreases in the right MTG, and rhythm amusia with anterior temporal GMV decreases. Additional GMV and WMV findings were observed and the results for the replication cohort are presented in the Supplementary Material.
Gray and White Matter Volume: Amusia Similar to the replication cohort results, the pooled longitudinal VBM analysis yielded significant Time (6 months > Acute) × Group interactions for NA > NRA, NA > RA, and RA > NRA in GMV. However, these analyses extended our previous
FIGURE 4 | Gray matter VBM results of pooled analysis: amusia. Time (6 months > Acute) × Group interactions for gray matter volume. (A) Non-amusic vs. non-recovered amusics; (B) Non-amusic vs. recovered amusics; (C) Recovered vs. non-recovered amusics. Results are thresholded at a whole-brain uncorrected p < 0.005 at the voxel level (extent threshold: k > 100 voxels) using MNI coordinates. Only clusters surviving an FWE-corrected p < 0.05 threshold are reported and labeled (see also Table 2). Bar plots for GMV differences in 6 months—Acute in significant clusters (Table 2) are shown: bar = mean, error-bar = standard error of the mean. AMY, Amygdala; CAU, caudate; HIP, hippocampus; IFG, inferior frontal gyrus; INS, insula; IPL, inferior parietal lobule; ITG, inferior temporal gyrus; MFG, middle frontal gyrus; MOG, middle occipital gyrus; MTG, middle temporal gyrus; PCG, postcentral gyrus; PHG, parahippocampal gyrus; PUT, putamen; STG, superior temporal gyrus.
Frontiers in Neuroscience | www.frontiersin.org
8
July 2017 | Volume 11 | Article 426
Sihvonen et al.
Neural Basis of Acquired Amusia
frontal (IFG), and parieto-occipital (IPL, MOG) regions as well as in the right insula and right subcortical (putamen, caudate, thalamus) and limbic structures (amygdala, hippocampus, PHG) compared to the pNA group (Table 4, Figure 6A). Compared to the pRAs, the pNRAs showed greater GMV decrease in the right STG, MTG, IPL (Table 4, Figure 6B). Corresponding areas emerged in the longitudinal WMV analysis: Significant Time (6 months > Acute) × Group interaction was found for pNA > pNRA, showing greater WMV decrease for pNRA group in the right temporal (STG, MTG, ITG), frontal (IFG, PreCG), parieto-occipital (IPL, PCG, MOG), and subcortical regions (putamen, caudate, globus pallidus, thalamus; Table 5, Figure 6C).
results by showing a set of new regions involved in amusia and its recovery. Compared to both NAs and RAs, the NRAs showed greater GMV decrease in the right temporal (STG, MTG) and frontal (IFG) regions. Compared to the NAs, additional GMV decrease in the NRAs was seen in other right temporal [Heschl’s gyrus (HG)] and frontal [precentral gyrus (PreCG), middle frontal gyrus (MFG)] areas as well as in right parietal [inferior parietal lobule (IPL), superior parietal lobule (SPL)], subcortical (putamen, caudate, thalamus), and limbic [amygdala, hippocampus, parahippocampal gyrus (PHG)] areas as well as in the right insula (Table 2, Figures 4A,C). Furthermore, the RAs showed greater GMV decrease than the NAs in right parietal [IPL, postcentral gyrus (PCG)] areas (Table 2, Figure 4B). The longitudinal VBM analysis for WMV changes revealed significant Time (6 months > Acute) × Group interactions for NA > NRA and RA > NRA. Compared to both NAs and RAs, the NRAs showed greater WMV decrease in right temporal [MTG, inferior temporal gyrus (ITG)] and subcortical (putamen, caudate) areas as well as in the right hippocampus (Table 3, Figures 5A,B). Compared to the NAs, additional WMV decrease in the NRAs was observed in other right temporal (STG, HG), frontal (PreCG), parieto-occipital [IPL, SPL, PCG, superior occipital gyrus (SOG), middle occipital gyrus (MOG)], and insular areas (Table 3, Figure 5A).
Gray and White Matter Volume: Rhythm Amusia When the MBEA Rhythm subtest was analyzed separately, we found that the rNRAs showed greater GMV decrease in the right temporal (STG, MTG, ITG, HG, fusiform gyrus), frontal (IFG), and parietal (IPL) regions as well as in the right insula and right subcortical (putamen, caudate, thalamus) and limbic structures (amydgala, hippocampus, PHG) compared to the rNA group (Table 6, Figure 7A). The rRA group showed also greater GMV decrease compared to the rNAs, but restricting to the right parieto-frontal area (IPL, PCG, and PreCG; Table 6, Figure 7B). Interestingly, the rNRAs showed greater GMV decrease in the right inferior temporal (ITG, fusiform gyrus) and limbic areas (hippocampus, PHG) compared to the rRAs (Table 6, Figure 7C).
Gray and White Matter Volume: Pitch Amusia Separate analysis of the MBEA Scale subtest yielded similar results as above: In the Scale subtest, the pNRAs showed greater GMV decrease in the right temporal (STG, MTG, ITG, HG),
TABLE 3 | White matter volume decreases (6-month stage—acute stage) in amusia: pooled analysis. 6 MONTHS > ACUTE Condition
Figure 6 panel
Non-amusic > Non-recovered amusic
A
Area name
Coordinates
Cluster size
t-value
Right hippocampus
40 −23 −16
1,10,744
5.86*
29,103
4.48*
Right superior temporal gyrus Right heschl’s gyrus
B
52 −26 9
Right middle temporal gyrus
55 −29 −6
Right inferior temporal Gyrus
55 −24 −23
Right insula
Recovered > Non-recovered amusic
57 −31 17
38 −24 20
Right superior parietal lobule
26 −55 44
Right inferior parietal lobule
38 −68 39
Right superior occipital gyrus
38 −77 24
Right middle occipital gyrus
38 −86 3
Right precentral gyrus
45 −12 41
Right postcentral gyrus
53 −12 22
Right putamen
26 −1 13
Right caudate
15 24 3
Right inferior temporal gyrus
42 −24 −17
Right middle temporal gyrus
58 −28 −10
Right hippocampus
35 −14 −16
Right putamen
26 −1 13
Right caudate
22 26 3
*p < 0.005 FWE-corrected at the cluster level.
Frontiers in Neuroscience | www.frontiersin.org
9
July 2017 | Volume 11 | Article 426
Sihvonen et al.
Neural Basis of Acquired Amusia
FIGURE 5 | White matter VBM results of pooled analysis: amusia. Time (6 months > Acute) × Group interactions for white matter volume. (A) Non-amusic vs. non-recovered amusics; (B) Recovered vs. non-recovered amusics. Results are thresholded at a whole-brain uncorrected p < 0.005 at the voxel level (extent threshold: k > 100 voxels) using MNI coordinates. Only clusters surviving an FWE-corrected p < 0.05 threshold are reported and labeled (see also Table 3). Bar plots for GMV differences in 6 months—Acute in significant clusters (Table 3) are shown: bar = mean, error-bar = standard error of the mean. CAU, Caudate; HIP, hippocampus; HG, Heschl’s gyrus; INS, insula; ITG, inferior temporal gyrus; MOG, middle occipital gyrus; MTG, middle temporal gyrus; PCG, postcentral gyrus; PUT, putamen; PreCG, precentral gyrus; SOG, superior occipital gyrus; SPL, superior parietal lobule; STG, superior temporal gyrus.
DISCUSSION
In the longitudinal WMV analysis, significant Time (6 months > Acute) × Group interaction were found for rNA > rNRA and rRA > rNRA. Compared to both the rNAs and rRAs, the rNRAs showed greater WMV decrease in the right inferior temporal (ITG, fusiform gyrus) and occipital areas (SOG, MOG, IOG; Table 7, Figures 8A,B). Additionally, compared to the rNAs, the rNRAs showed WMV decreases in the right STG, fronto-parietal regions (IFG, PreCG, PCG, IPL, precuneus), and PHG (Table 7, Figure 8A). Compared to pitch amusia, the GMV change associated with rhythm amusia recovery was more anterior, locating in the anterior MTG and ITG. In contrast, recovered pitch amusia was associated with posterior superior temporal and inferior parietal GMV changes. Overall, rhythm amusia was associated with GMV decreases in right inferior temporal regions. In contrast, GMV decreases comprising the right STG/MTG and IPL were associated with pitch amusia. Specific WMV changes in rhythm amusia located in right inferior temporal occipital regions whereas in pitch amusia specific WMV changes were observed in the right MTG.
Frontiers in Neuroscience | www.frontiersin.org
The aim of the present study to extend and replicate our previous VLSM and VBM results (Sihvonen et al., 2016) and, using a larger pooled sample of stroke patients and therefore having a higher statistical power, to provide a more precise and detailed account of the neural basis of acquired amusia and its recovery after stroke. Using both the replication cohort (N = 43; see Supplementary Material) and the larger pooled sample (N = 90) of stroke patients, we were able to ascertain our previous results (Sihvonen et al., 2016) that (i) acquired amusia was associated with an acute stage lesion pattern in right temporal, insular, and striatal areas and that (ii) non-recovered amusia was linked to longitudinal GMV decrease in right temporal areas, located posteriorly for pitch amusia and more anteriorly for rhythm amusia. Importantly, compared to the previous study, the larger pooled sample also enabled us to carry out direct lesion comparisons to evaluate lesion patterns associated with amusia recovery. Furthermore, using the larger pooled sample yielded additional areas related to amusia, both in VLSM and
10
July 2017 | Volume 11 | Article 426
Sihvonen et al.
Neural Basis of Acquired Amusia
TABLE 4 | Gray matter volume decreases (6-month stage—acute stage) in pitch amusia: pooled analysis. 6 MONTHS > ACUTE Condition
Figure 6 panel
Area name
Coordinates
Cluster size
t-value
Non-amusic > Non-recovered amusic
A
Right middle temporal gyrus (BA 21, 39)
63 −38 −12
1,23,710
5.11**
3562
4.61*
Right heschl’s gyrus (BA 42) Right superior temporal gyrus (BA 22, 38, 39, 42) Right inferior temporal gyrus (BA 20) Right insula (BA 13, 44) Right inferior frontal gyrus (BA 44, 47)
B
61 −53 9 61 −26 −23 43 −1 −5 61 17 14
Right inferior parietal lobule (BA 40)
46 −63 43
Right middle occipital gyrus (BA 37)
61 −65 −13
Right putamen
Recovered amusic > Non-recovered amusic
43 −21 9
18 13 −7
Right caudate
9 12 9
Right thalamus
18 −30 13
Right amygdala
27 −7 −14
Right parahippocampal gyrus
22 −14 −25
Right hippocampus
16 −4 −14
Right superior temporal gyrus (BA 22,39)
48 −45 10
Right middle temporal gyrus (BA 21)
57 −47 4
Right inferior parietal lobule (BA 40)
51 −47 35
*p < 0.05 FWE-corrected at the cluster level. **p < 0.005 FWE-corrected at the cluster level. BA, Brodmann area.
VBM, providing a more comprehensive picture of the lesions and longitudinal structural changes associated with different recovery trajectories of acquired amusia. The main novel finding was that (i) more severe and persistent amusia was associated with an extensive pattern of acute stage lesions and longitudinal GMV/WMV changes in the right hemisphere, which included not only temporal, insular, and striatal areas but also frontal, parietal, and limbic areas, and, conversely, (ii) less severe and transient amusia was linked to lesions specifically in left frontal areas as well as GMV changes in right parietal areas, and (iii) compared to the non-recovered amusia, recovered amusia was related to less GMV decrease in the temporal lobe, located more posterosuperiorly in pitch amusia and more inferoanteriorly in rhythm amusia.
matter abnormalities specifically in right superior temporal and/or insular areas. Importantly, our novel VLSM and VBM results showed that the right STG/MTG has a crucial role also in amusia recovery as the NRAs had more lesions at the acute stage and also more GMV and WMV decrease from acute to 6-month stage compared to the RAs, suggesting that initial damage and further atrophy of these regions is a strong indicator for severe amusia that has a poor prognosis. Separate VBM analyses for pitch and rhythm amusia showed that recovered pitch amusia was related to smaller GMV decrease in the right posterior STG/MTG compared to non-recovered pitch amusia. In contrast, recovered rhythm-amusics showed less GMV decrease in the anterior MTG, ITG, and fusiform gyrus as well as less WMV in the ITG and fusiform gyrus than the rNRAs. These results provide crucial information for pinpointing the functional organization of the right temporal lobe for pitch and rhythm processing, and moreover, they are in line with previous observations where anterior temporal lesions have been associated with rhythm processing deficits (Kester et al., 1991; Liegeois-Chauvel et al., 1998) and posterior temporal structures to spectral processing (Warren et al., 2005; Jamison et al., 2006; for a meta-analysis, see Samson et al., 2011).
Temporal Areas Across the VLSM and VBM analyses, several lateral and medial temporal regions in the right hemisphere were found to be related to amusia and its recovery. In the acute stage VLSM, converging results from both continuous analyses of MBEA total score, Scale and Rhythm subtest scores and binary analyses comparing NRAs and NAs showed that severe non-recovered amusia was caused by lesions in the right STG, MTG, and insula. This is well in line with findings from neuroimaging studies of healthy subjects implicating superior temporal (Griffiths et al., 1998; Gutschalk et al., 2002; Patterson et al., 2002; Tramo et al., 2002; Hyde et al., 2008; Kumar et al., 2016) regions in pitch and/or melodic processing. Similarly, studies of both acquired amusia (LiegeoisChauvel et al., 1998; Ayotte et al., 2000; Kohlmetz et al., 2003; Terao et al., 2006; Särkämö et al., 2010b; Hochman and Abrams, 2014; Sihvonen et al., 2016) and congenital amusia (Hyde et al., 2007; Albouy et al., 2013) have reported lesions/structural gray
Frontiers in Neuroscience | www.frontiersin.org
Frontal and Parietal Regions Compared to our previous results, in addition to temporal areas, frontal, and parietal regions showed an association with amusia in the present study with higher statistical power. In the VLSM and VBM analyses, the NRAs had more lesions and more GMV decrease in the right IFG compared to both the NAs and the RAs. This pattern in NRAs extended also to the right MFG and PreCG when compared to the NAs. These results suggest that, in addition to the right
11
July 2017 | Volume 11 | Article 426
Sihvonen et al.
Neural Basis of Acquired Amusia
FIGURE 6 | Gray and white matter VBM results of pooled analysis: pitch amusia. Time (6 months > Acute) × Group interactions for gray matter volume. (A) Non-amusic vs. non-recovered amusics; (B) Non-amusic vs. recovered amusics, and Time (6 months > Acute) × Group interactions for white matter volume (C) Non-amusic vs. non-recovered amusics. Results are thresholded at a whole-brain uncorrected p < 0.005 at the voxel level (extent threshold: k > 100 voxels) using MNI coordinates. Only clusters surviving an FWE-corrected p < 0.05 threshold are reported and labeled (see also Tables 4, 5). Bar plots for GMV differences in 6 months—Acute in significant clusters (Tables 4, 5) are shown: bar = mean, error-bar = standard error of the mean. AMY, amygdala; CAU, Caudate; FG, fusiform gyrus; GP, globus pallidus; HG, Heschl’s gyrus; HIP, hippocampus; IFG, inferior frontal gyrus; INS, insula; IPL, inferior parietal lobule; ITG, inferior temporal gyrus; MFG, middle frontal gyrus; MOG, middle occipital gyrus; MTG, middle temporal gyrus; PCG, postcentral gyrus; PHG, parahippocampal gyrus; PreCG, precentral gyrus; PUT, putamen; STG, superior temporal gyrus; THA, thalamus.
2005; Tillmann et al., 2006; Bianco et al., 2016) in healthy subjects. Reduced activation and connectivity and gray and white matter abnormalities in the right IFG have also been reported in congenital amusia (Hyde et al., 2006, 2007, 2011; Albouy
STG/MTG, the right IFG-MFG-PreCG appears to be another crucial hub in acquired amusia as its lesions and atrophy are linked to initial severity and poor recovery. Previously, these areas have been implicated in the sequencing of auditory information and structural (syntactic) analysis of music (Koelsch,
Frontiers in Neuroscience | www.frontiersin.org
12
July 2017 | Volume 11 | Article 426
Sihvonen et al.
Neural Basis of Acquired Amusia
TABLE 5 | White matter volume decreases (6-month stage—acute stage) in pitch amusia: pooled analysis. 6 MONTHS > ACUTE Condition
Figure 6 panel
Non-amusic > Non-recovered amusic
C
Area name
Coordinates
Cluster size
t-value
Right middle temporal gyrus
59 −41 0
82,987
5.51*
Right superior temporal gyrus
46 −22 4
Right inferior temporal gyrus
46 −22 −22
Right fusiform gyrus
43 −26 −15
Right inferior frontal gyrus
56 2 21
Right inferior parietal lobule
33 −50 45
Right middle occipital gyrus
33 −78 20
Right inferior occipital gyrus
33 −85 −2
Right precentral gyrus
56 −4 23
Right postcentral gyrus
56 −14 19
Right thalamus
17 −12 16
Right putamen
26 −1 13
Right globus pallidum
20 3 −2
Right Caudate
15 24 3
*p < 0.005 FWE-corrected at the cluster level.
TABLE 6 | Gray matter volume decreases (6-month stage—acute stage) in rhythm amusia: pooled analysis. 6 MONTHS > ACUTE Condition
Figure 7 panel
Area name
Coordinates
Cluster size
t-value
Non-amusic > Non-recovered amusic
A
Right hippocampus (BA 28)
26 −14 −20
1,00,087
5.93**
Right heschl’s gyrus (BA 42)
47 −20 6
Right superior temporal gyrus (BA 13, 22, 38)
43 23 −31
4,029
3.49*
5,488
4.35**
Right middle temporal gyrus (BA 19, 21, 22, 37) Right inferior temporal gyrus (BA 20, 37)
Non-amusic > Recovered amusic
Recovered amusic > Non-recovered amusic
B
C
45 7 −40 54 −67 −13
Right insula (BA 22)
47 6 −6
Right inferior frontal gyrus (BA 47)
47 19 −8
Right inferior parietal lobule (BA 40)
62 −31 27
Right putamen
18 13 −7
Right caudate
9 12 9
Right thalamus
18 −30 13
Right amygdala
21 −7 −14
Right fusiform gyrus (BA 20, 36)
41 −18 −28
Right parahippocampal gyrus (BA 28)
22 −14 −25
Right inferior parietal lobule (BA 40)
59 −29 37
Right postcentral gyrus (BA 1, 2, 3)
59 −25 39
Right precentral gyrus (BA 4)
59 −23 44
Right parahippocampal gyrus (BA 19, 35)
36 −33 −11
Right hippocampus (BA 28)
22 −12 −20
Right fusiform gyrus (BA 20, 36, 37)
37 −44 −5
Right middle temporal gyrus (BA 37) Right inferior temporal gyrus (BA 20, 37)
41 13 −39 51 −40 −23
*p < 0.05 FWE-corrected at the cluster level. **p < 0.005 FWE-corrected at the cluster level. BA, Brodmann area.
in both language and music (Maess et al., 2001; Kunert et al., 2015) and, conversely, that its damage impairs both linguistic and musical syntactic processing (Patel et al., 2008; Sammler et al., 2011). Our results provide support for the role of the
et al., 2013). Interestingly, the left IFG emerged as the only lesion site in the VLSM contrast between the RAs and NAs. Along with its right hemisphere homolog, the left IFG (or Broca’s area) has been found to process syntactic information
Frontiers in Neuroscience | www.frontiersin.org
13
July 2017 | Volume 11 | Article 426
Sihvonen et al.
Neural Basis of Acquired Amusia
FIGURE 7 | Gray matter VBM results of pooled analysis: rhythm amusia. Time (6 months > Acute) × Group interactions for gray matter volume. (A) Non-amusic vs. non-recovered amusics; (B) Non-amusic vs. recovered amusics; (C) Recovered vs. non-recovered amusics. Results are thresholded at a whole-brain uncorrected p < 0.005 at the voxel level (extent threshold: k > 100 voxels) using MNI coordinates. Only clusters surviving an FWE-corrected p < 0.05 threshold are reported and labeled (see also Table 6). Bar plots for GMV differences in 6 months—Acute in significant clusters (Table 6) are shown: bar = mean, error-bar = standard error of the mean. AMY, Amygdala; CAU, caudate; FG, fusiform gyrus; HG, Heschl’s gyrus; HIP, hippocampus; IFG, inferior frontal gyrus; ITG, inferior temporal gyrus; INS, insula; IPL, inferior parietal lobule; ITG, inferior temporal gyrus; MTG, middle temporal gyrus; PCG, postcentral gyrus; PHG, parahippocampal gyrus; PreCG, precentral gyrus; PUT, putamen; STG, superior temporal gyrus.
left IFG in amusia, but suggest that its acute damage results in less severe and transient form of amusia (Kumar et al., 2016). VBM results also showed that compared to the NAs, both the NRAs and the RAs had more GMV/WMV decrease also in right parietal areas, especially in right IPL/SPL, suggesting that this region is generally associated with amusia, regardless
Frontiers in Neuroscience | www.frontiersin.org
of its recovery. Right parietal areas have been implicated in neuroimaging studies to be involved in the processing of more higher-level melodic features, such as tonality (Foster et al., 2013; Royal et al., 2016), as well as in tonal working memory and recognition (Jerde et al., 2011; Schulze et al., 2011; Albouy et al., 2017). Importantly, in the pitch domain, recovered
14
July 2017 | Volume 11 | Article 426
Sihvonen et al.
Neural Basis of Acquired Amusia
TABLE 7 | White matter volume decreases (6-month stage—acute stage) in rhythm amusia: pooled analysis. 6 MONTHS > ACUTE Condition
Figure 8 panel
Non-amusic > Non-recovered amusic
A
Area name
Coordinates
Cluster size
t-value
Right fusiform gyrus
43 −25 −17
68,278
5.65**
12,533
5.43**
3,252
3.81*
24,150
4.68**
Right superior temporal gyrus Right middle temporal gyrus
57 −45 5
Right inferior temporal gyrus
47 −11 −31
Right parahippocampal gyrus
34 −2 −25
Right inferior parietal lobule
57 −40 22
Right precuneus
35 −69 41
Right middle occipital gyrus
35 −67 33
Right inferior occipital gyrus
31 −84 −5
Right precentral gyrus
55 5 11
Right inferior frontal gyrus
52 4 19
Right postcentral gyrus
Recovered > Non-recovered amusic
B
56 −28 9
60 −5 19
Right globus pallidum
23 −3 0
Right putamen
28 −12 4
Right caudate
19 27 0
Right middle occipital gyrus
39 −80 23
Right inferior occipital gyrus
34 −85 −2
Right middle temporal gyrus
54 −29 −12
Right inferior temporal gyrus
44 −44 −9
Right fusiform gyrus
32 −50 −8
*p < 0.05 FWE-corrected at the cluster level. **p < 0.005 FWE-corrected at the cluster level.
pitch amusics showed more GMV in the right IPL than the pNRAs.
Brattico et al., 2011; Alluri et al., 2012; Burunat et al., 2014; Toiviainen et al., 2014). In contrast, structural deficits, indicated by volumetric and cortical thickness measures that have been reported in congenital amusia have thus far been limited to right superior temporal and inferior frontal areas (Hyde et al., 2006, 2007; Albouy et al., 2013). Our results support the strong right hemispheric basis for amusia, but suggest that in acquired amusia the lesion and atrophy pattern underlying the severity and persistence of the deficit might be more extensive and widespread. While the statistical power in the VLSM analyses in the current study was higher in the right hemisphere than in the left hemisphere, the observed longitudinal results do not appear to be due to a simple mass effect since the overall volume of the lesions was controlled for in the VBM analyses. However, future studies investigating acquired amusia in patients with left hemisphere damage would be of great interest. As stroke may have impact on other modalities, the effect of other cognitive deficits on MBEA performance should be also taken into consideration. On the other hand, given that the large-scale atrophy pattern extended from right prefrontal (IFG/MFG) all the way to right posterior (parietal/occipital) regions, which are not considered to be part of the music perception network, it is possible that this may reflect damage to the long-range white matter pathways, such as the inferior fronto-occipital fasciculus (IFOF). The IFOF is a ventral pathway that runs from its posterior terminations (inferior and middle occipital gyri, parietal lobe) through the external capsule, between the insula and putamen, and connects to multiple temporal (STG/MTG) and frontal (IFG/MFG) areas
Subcortical and Limbic Regions Finally, the pattern of acute lesions and the longitudinal GMV/WMV decreases observed for NRAs vs. NAs also encompassed right subcortical areas, both in the striatum (caudate, putamen) and in limbic areas (amygdala, hippocampus, parahippocampal gyrus). Together with the GMV decrease in PreCG, the striatal changes are most likely related to rhythmic deficits, as these regions have been strongly linked to rhythm processing in neuroimaging studies (Penhune et al., 1998; Grahn and Brett, 2009; Grahn and Rowe, 2009; Alluri et al., 2012). In line with the key role of rhythm in mediating the emotional valence and arousal induced by music, musical pulse, or rhythm has also been shown to engage amygdala and hippocampus (Alluri et al., 2012; Toiviainen et al., 2014), the latter playing a role also in auditory working memory (Burunat et al., 2014). Musical training has also been linked to increased hippocampal and amygdala volume (Oechslin et al., 2013; Dohn et al., 2015; Vaquero et al., 2016), providing converging support for our finding of decreased volume of these structures in non-recovered amusia. Converging evidence from neuroimaging studies in healthy subjects utilizing natural music stimuli suggest that music perception and analysis is a highly wide-spread process in the brain, engaging a large-scale network of bilateral temporal, frontal, parietal, and subcortical regions (Schmithorst, 2005;
Frontiers in Neuroscience | www.frontiersin.org
15
July 2017 | Volume 11 | Article 426
Sihvonen et al.
Neural Basis of Acquired Amusia
FIGURE 8 | White matter VBM results of pooled analysis: rhythm amusia. Time (6 months > Acute) × Group interactions for white matter volume. (A) Non-amusic vs. non-recovered amusics; (B) Recovered vs. non-recovered amusics. Results are thresholded at a whole-brain uncorrected p < 0.005 at the voxel level (extent threshold: k > 100 voxels) using MNI coordinates. Only clusters surviving an FWE-corrected p < 0.05 threshold are reported and labeled (see also Table 7). Bar plots for GMV differences in 6 months—Acute in significant clusters (Table 7) are shown: bar = mean, error-bar = standard error of the mean. CAU, Caudate; FG, fusiform gyrus; GP, globus pallidus; IPL, inferior parietal lobule; ITG, inferior temporal gyrus; MOG, middle occipital gyrus; MTG, middle temporal gyrus; PUT, putamen; SOG, superior occipital gyrus; STG, superior temporal gyrus.
(Catani et al., 2002; Hau et al., 2016), thereby covering most of the lesion/atrophy areas observed in our NRA patients. Thus, far using diffusion weighted MRI (DW-MRI), amusia has been linked only to the right arcuate fasciculus (Loui et al., 2009), a dorsal pathway connecting the IFG and STG. However, this finding has been recently challenged using a larger sample of congenital amusics and multiple algorithms (Chen et al., 2015) and the crucial white matter connections affected in congenital amusia remain unclear (for a review, see Peretz, 2016). In future, more research on the roles of the ventral and dorsal pathways in amusia is clearly needed. Furthermore, although the data presented here sheds more light on the recovery mechanisms in acquired amusia, an interesting idea would be to use machine learning methods to predict, by means of lesion data, not
Frontiers in Neuroscience | www.frontiersin.org
only which patients will become amusics, but also which one will recover (Rondina et al., 2016). Further research is needed, especially studies using multimodal MRI data.
AUTHOR CONTRIBUTIONS AR, SS, and TS designed research; AS and TS performed research; AS, PR, and TS analyzed data; AS, TS, PR, AR, and SS wrote the paper.
FUNDING This work was supported by Academy of Finland program (grants no. 1257077, 1277693), Tyks Research Funding (grant no.
16
July 2017 | Volume 11 | Article 426
Sihvonen et al.
Neural Basis of Acquired Amusia
13944), Finnish Brain Research and Rehabilitation Foundation, Ella and Georg Ehrnrooth Foundation, Signe and Ane Gyllenberg Foundation, Maire Taponen Foundation, Finnish Cultural Foundation, National Doctoral Programme of Psychology, Jenny and Antti Wihuri Foundation, the Formación de Profesorado Universitario program (AP2010-4170) and Generalitat de Catalunya (2014 SGR1413).
Finland and Helsinki metropolitan area for their collaboration. We thank professor Mari Tervaniemi and professor Riitta Parkkola, professor Taina Autti and doctor Heli Silvennoinen, Ph.D. Jani Saunavaara, M.A. Vera Leo, and radiographerers Ulla Anttalainen (†), Riku Luoto, Pentti Pölönen and Tuija Vahtera. We would also like to thank the patients and their families for their participation.
ACKNOWLEDGMENTS
SUPPLEMENTARY MATERIAL
We thank the staffs of the HUCH Department of Neurology and Tyks Department of Clinical Neurosciences, and other rehabilitation hospitals in the Hospital District of Southwest
The Supplementary Material for this article can be found online at: http://journal.frontiersin.org/article/10.3389/fnins. 2017.00426/full#supplementary-material
REFERENCES
Dohn, A., Garza-Villarreal, E. A., Chakravarty, M. M., Hansen, M., Lerch, J. P., and Vuust, P. (2015). Gray- and white-matter anatomy of absolute pitch possessors. Cereb. Cortex 25, 1379–1388. doi: 10.1093/cercor/bht334 Dovern, A., Fink, G. R., Saliger, J., Karbe, H., Koch, I., and Weiss, P. H. (2011). Apraxia impairs intentional retrieval of incidentally acquired motor knowledge. J. Neurosci. 31, 8102–8108. doi: 10.1523/JNEUROSCI.6585-10.2011 Foster, N. E., Halpern, A. R., and Zatorre, R. J. (2013). Common parietal activation in musical mental transformations across pitch and time. Neuroimage 75, 27–35. doi: 10.1016/j.neuroimage.2013.02.044 Grahn, J. A., and Brett, M. (2009). Impairment of beat-based rhythm discrimination in Parkinson’s disease. Cortex 45, 54–61. doi: 10.1016/j.cortex.2008.01.005 Grahn, J. A., and Rowe, J. B. (2009). Feeling the beat: premotor and striatal interactions in musicians and nonmusicians during beat perception. J. Neurosci. 29, 7540–7548. doi: 10.1523/JNEUROSCI.2018-08.2009 Griffiths, T. D., Büchel, C., Frackowiak, R. S., and Patterson, R. D. (1998). Analysis of temporal structure in sound by the human brain. Nat. Neurosci. 1, 422–427. doi: 10.1038/1637 Gutschalk, A., Patterson, R. D., Rupp, A., Uppenkamp, S., and Scherg, M. (2002). Sustained magnetic fields reveal separate sites for sound level and temporal regularity in human auditory cortex. Neuroimage 15, 207–216. doi: 10.1006/nimg.2001.0949 Hau, J., Sarubbo, S., Perchey, G., Crivello, F., Zago, L., Mellet, E., et al. (2016). Cortical terminations of the inferior fronto-occipital and uncinate fasciculi: anatomical stem-based virtual dissection. Front. Neuroanat. 10:58. doi: 10.3389/fnana.2016.00058 Henry, M., and McAuley, J. (2010). On the prevalence of congenital amusia. Music Percept. 27, 413–418. doi: 10.1525/mp.2010.27.5.413 Hirel, C., Nighoghossian, N., Leveque, Y., Hannoun, S., Fornoni, L., Daligault, S., et al. (2017). Verbal and musical short-term memory: variety of auditory disorders after stroke. Brain Cogn. 113, 10–22. doi: 10.1016/j.bandc.2017.01.003 Hochman, M. S., and Abrams, K. J. (2014). Amusia for pitch caused by right middle cerebral artery infarct. J. Stroke Cerebrovasc. Dis. 23, 164–165. doi: 10.1016/j.jstrokecerebrovasdis.2012.06.016 Hyde, K. L., Lerch, J. P., Zatorre, R. J., Griffiths, T. D., Evans, A. C., and Peretz, I. (2007). Cortical thickness in congenital amusia: when less is better than more. J. Neurosci. 27, 13028–13032. doi: 10.1523/JNEUROSCI.3039-07.2007 Hyde, K. L., Peretz, I., and Zatorre, R. J. (2008). Evidence for the role of the right auditory cortex in fine pitch resolution. Neuropsychologia 46, 632–639. doi: 10.1016/j.neuropsychologia.2007.09.004 Hyde, K. L., Zatorre, R. J., and Peretz, I. (2011). Functional MRI evidence of an abnormal neural network for pitch processing in congenital amusia. Cereb. Cortex 21, 292–299. doi: 10.1093/cercor/bhq094 Hyde, K. L., Zatorre, R. J., Griffiths, T. D., Lerch, J. P., and Peretz, I. (2006). Morphometry of the amusic brain: a two-site study. Brain 129, 2562–2570. doi: 10.1093/brain/awl204 Jamison, H. L., Watkins, K. E., Bishop, D. V., and Matthews, P. M. (2006). Hemispheric specialization for processing auditory nonspeech stimuli. Cereb. Cortex 16, 1266–1275. doi: 10.1093/cercor/bhj068
Albouy, P., Mattout, J., Bouet, R., Maby, E., Sanchez, G., Aguera, P. E., et al. (2013). Impaired pitch perception and memory in congenital amusia: the deficit starts in the auditory cortex. Brain 136, 1639–1661. doi: 10.1093/brain/awt082 Albouy, P., Weiss, A., Baillet, S., and Zatorre, R. J. (2017). Selective entrainment of theta oscillations in the dorsal stream causally enhances auditory working memory performance. Neuron 94, 193–206.e5. doi: 10.1016/j.neuron.2017.03.015 Alluri, V., Toiviainen, P., Jääskeläinen, I. P., Glerean, E., Sams, M., and Brattico, E. (2012). Large-scale brain networks emerge from dynamic processing of musical timbre, key and rhythm. Neuroimage 59, 3677–3689. doi: 10.1016/j.neuroimage.2011.11.019 Andersen, S. M., Rapcsak, S. Z., and Beeson, P. M. (2010). Cost function masking during normalization of brains with focal lesions: still a necessity? Neuroimage 53, 78–84. doi: 10.1016/j.neuroimage.2010.06.003 Ashburner, J., and Friston, K. J. (2000). Voxel-based morphometry–the methods. Neuroimage 11, 805–821. doi: 10.1006/nimg.2000.0582 Ashburner, J., and Friston, K. J. (2005). Unified segmentation. Neuroimage 26, 839–851. doi: 10.1016/j.neuroimage.2005.02.018 Ayotte, J., Peretz, I., Rousseau, I., Bard, C., and Bojanowski, M. (2000). Patterns of music agnosia associated with middle cerebral artery infarcts. Brain 123, 1926–1938. doi: 10.1093/brain/123.9.1926 Bates, E., Wilson, S. M., Saygin, A. P., Dick, F., Sereno, M. I., Knight, R. T., et al. (2003). Voxel-based lesion-symptom mapping. Nat. Neurosci. 6, 448–450. doi: 10.1038/nn1050 Bianco, R., Novembre, G., Keller, P. E., Kim, S. G., Scharf, F., Friederici, A. D., et al. (2016). Neural networks for harmonic structure in music perception and action. Neuroimage 142, 454–464. doi: 10.1016/j.neuroimage.2016.08.025 Brattico, E., Alluri, V., Bogert, B., Jacobsen, T., Vartiainen, N., Nieminen, S., et al. (2011). A functional MRI study of happy and sad emotions in music with and without lyrics. Front. Psychol. 2:308. doi: 10.3389/fpsyg.2011.00308 Brett, M., Leff, A. P., Rorden, C., and Ashburner, J. (2001). Spatial normalization of brain images with focal lesions using cost function masking. Neuroimage 14, 486–500. doi: 10.1006/nimg.2001.0845 Burunat, I., Alluri, V., Toiviainen, P., Numminen, J., and Brattico, E. (2014). Dynamics of brain activity underlying working memory for music in a naturalistic condition. Cortex 57, 254–269. doi: 10.1016/j.cortex.2014.04.012 Catani, M., Howard, R. J., Pajevic, S., and Jones, D. K. (2002). Virtual in vivo interactive dissection of white matter fasciculi in the human brain. Neuroimage 17, 77–94. doi: 10.1006/nimg.2002.1136 Chen, J. L., Kumar, S., Williamson, V. J., Scholz, J., Griffiths, T. D., and Stewart, L. (2015). Detection of the arcuate fasciculus in congenital amusia depends on the tractography algorithm. Front. Psychol. 6:9. doi: 10.3389/fpsyg.2015. 00009 Crinion, J., Ashburner, J., Leff, A., Brett, M., Price, C., and Friston, K. (2007). Spatial normalization of lesioned brains: performance evaluation and impact on fMRI analyses. Neuroimage 37, 866–875. doi: 10.1016/j.neuroimage.2007. 04.065
Frontiers in Neuroscience | www.frontiersin.org
17
July 2017 | Volume 11 | Article 426
Sihvonen et al.
Neural Basis of Acquired Amusia
Rorden, C., and Brett, M. (2000). Stereotaxic display of brain lesions. Behav. Neurol. 12, 191–200. doi: 10.1155/2000/421719 Rorden, C., and Karnath, H. O. (2004). Using human brain lesions to infer function: a relic from a past era in the fMRI age? Nat. Rev. Neurosci. 5, 813–819. doi: 10.1038/nrn1521 Rosslau, K., Steinwede, D., Schröder, C., Herholz, S. C., Lappe, C., Dobel, C., et al. (2015). Clinical investigations of receptive and expressive musical functions after stroke. Front. Psychol. 6:768. doi: 10.3389/fpsyg.2015.00768 Royal, I., Vuvan, D. T., Zendel, B. R., Robitaille, N., Schonwiesner, M., and Peretz, I. (2016). Activation in the right inferior parietal lobule reflects the representation of musical structure beyond simple pitch discrimination. PLoS ONE 11:e0155291. doi: 10.1371/journal.pone.0155291 Sammler, D., Koelsch, S., and Friederici, A. D. (2011). Are left fronto-temporal brain areas a prerequisite for normal music-syntactic processing? Cortex 47, 659–673. doi: 10.1016/j.cortex.2010.04.007 Samson, F., Zeffiro, T. A., Toussaint, A., and Belin, P. (2011). Stimulus complexity and categorical effects in human auditory cortex: an activation likelihood estimation meta-analysis. Front. Psychol. 1:241. doi: 10.3389/fpsyg.2010.00241 Särkämö, T., Pihko, E., Laitinen, S., Forsblom, A., Soinila, S., Mikkonen, M., et al. (2010a). Music and speech listening enhance the recovery of early sensory processing after stroke. J. Cogn. Neurosci. 22, 2716–2727. doi: 10.1162/jocn.2009.21376 Särkämö, T., Ripollés, P., Vepsäläinen, H., Autti, T., Silvennoinen, H. M., Salli, E., et al. (2014). Structural changes induced by daily music listening in the recovering brain after middle cerebral artery stroke: a voxel-based morphometry study. Front. Hum. Neurosci. 8:245. doi: 10.3389/fnhum.2014.00245 Särkämö, T., Tervaniemi, M., Laitinen, S., Forsblom, A., Soinila, S., Mikkonen, M., et al. (2008). Music listening enhances cognitive recovery and mood after middle cerebral artery stroke. Brain 131, 866–876. doi: 10.1093/brain/awn013 Särkämö, T., Tervaniemi, M., Soinila, S., Autti, T., Silvennoinen, H. M., Laine, M., et al. (2009). Amusia and cognitive deficits after stroke: is there a relationship? Ann. N.Y. Acad. Sci. 1169, 441–445. doi: 10.1111/j.1749-6632.2009. 04765.x Särkämö, T., Tervaniemi, M., Soinila, S., Autti, T., Silvennoinen, H. M., Laine, M., et al. (2010b). Auditory and cognitive deficits associated with acquired amusia after stroke: a magnetoencephalography and neuropsychological follow-up study. PLoS ONE 5:e15157. doi: 10.1371/journal.pone.0015157 Schmithorst, V. J. (2005). Separate cortical networks involved in music perception: preliminary functional MRI evidence for modularity of music processing. Neuroimage 25, 444–451. doi: 10.1016/j.neuroimage.2004. 12.006 Schulze, K., Zysset, S., Mueller, K., Friederici, A. D., and Koelsch, S. (2011). Neuroarchitecture of verbal and tonal working memory in nonmusicians and musicians. Hum. Brain Mapp. 32, 771–783. doi: 10.1002/hbm.21060 Schuppert, M., Münte, T. F., Wieringa, B. M., and Altenmüller, E. (2000). Receptive amusia: evidence for cross-hemispheric neural networks underlying music processing strategies. Brain 123(Pt. 3), 546–559. doi: 10.1093/brain/123. 3.546 Sihvonen, A. J., Ripollés, P., Leo, V., Rodríguez-Fornells, A., Soinila, S., and Särkämö, T. (2016). Neural basis of acquired amusia and its recovery after stroke. J. Neurosci. 36, 8872–8881. doi: 10.1523/JNEUROSCI.0709-16.2016 Stewart, L. (2008). Fractionating the musical mind: insights from congenital amusia. Curr. Opin. Neurobiol. 18, 127–130. doi: 10.1016/j.conb.2008. 07.008 Stewart, L., von Kriegstein, K., Warren, J. D., and Griffiths, T. D. (2006). Music and the brain: disorders of musical listening. Brain 129, 2533–2553. doi: 10.1093/brain/awl171 Terao, Y., Mizuno, T., Shindoh, M., Sakurai, Y., Ugawa, Y., Kobayashi, S., et al. (2006). Vocal amusia in a professional tango singer due to a right superior temporal cortex infarction. Neuropsychologia 44, 479–488. doi: 10.1016/j.neuropsychologia.2005.05.013 Tillmann, B., Albouy, P., and Caclin, A. (2015). Congenital amusias. Handb. Clin. Neurol. 129, 589–605. doi: 10.1016/B978-0-444-62630-1.00033-0 Tillmann, B., Koelsch, S., Escoffier, N., Bigand, E., Lalitte, P., Friederici, A. D., et al. (2006). Cognitive priming in sung and instrumental music: activation of inferior frontal cortex. Neuroimage 31, 1771–1782. doi: 10.1016/j.neuroimage.2006.02.028
Jerde, T. A., Childs, S. K., Handy, S. T., Nagode, J. C., and Pardo, J. V. (2011). Dissociable systems of working memory for rhythm and melody. Neuroimage 57, 1572–1579. doi: 10.1016/j.neuroimage.2011.05.061 Kalmus, H., and Fry, D. B. (1980). On tune deafness (dysmelodia): frequency, development, genetics and musical background. Ann. Hum. Genet. 43, 369–382. doi: 10.1111/j.1469-1809.1980.tb01571.x Kester, D. B., Saykin, A. J., Sperling, M. R., O’Connor, M. J., Robinson, L. J., and Gur, R. C. (1991). Acute effect of anterior temporal lobectomy on musical processing. Neuropsychologia 29, 703–708. doi: 10.1016/0028-3932(91)90104-G Koelsch, S. (2005). Neural substrates of processing syntax and semantics in music. Curr. Opin. Neurobiol. 15, 207–212. doi: 10.1016/j.conb.2005.03.005 Koelsch, S. (2014). Brain correlates of music-evoked emotions. Nat. Rev. Neurosci. 15, 170–180. doi: 10.1038/nrn3666 Kohlmetz, C., Muller, S. V., Nager, W., Münte, T. F., and Altenmüller, E. (2003). Selective loss of timbre perception for keyboard and percussion instruments following a right temporal lesion. Neurocase 9, 86–93. doi: 10.1076/neur.9.1.86.14372 Kumar, S., Joseph, S., Gander, P. E., Barascud, N., Halpern, A. R., and Griffiths, T. D. (2016). A brain system for auditory working memory. J. Neurosci. 36, 4492–4505. doi: 10.1523/JNEUROSCI.4341-14.2016 Kunert, R., Willems, R. M., Casasanto, D., Patel, A. D., and Hagoort, P. (2015). Music and language syntax interact in broca’s area: an fMRI study. PLoS ONE 10:e0141069. doi: 10.1371/journal.pone.0141069 Liegeois-Chauvel, C., Peretz, I., Babai, M., Laguitton, V., and Chauvel, P. (1998). Contribution of different cortical areas in the temporal lobes to music processing. Brain 121(Pt 10), 1853–1867. doi: 10.1093/brain/121.10.1853 Loui, P., Alsop, D., and Schlaug, G. (2009). Tone deafness: a new disconnection syndrome? J. Neurosci. 29, 10215–10220. doi: 10.1523/JNEUROSCI.1701-09.2009 Maess, B., Koelsch, S., Gunter, T. C., and Friederici, A. D. (2001). Musical syntax is processed in Broca’s area: an MEG study. Nat. Neurosci. 4, 540–545. doi: 10.1038/87502 Mandell, J., Schulze, K., and Schlaug, G. (2007). Congenital amusia: an auditory-motor feedback disorder? Restor. Neurol. Neurosci. 25, 323–334. Available online at: https://pdfs.semanticscholar.org/7d83/ 5662b25c24366413a42a0b51ae1eb13b3106.pdf Marin, M. M., Gingras, B., and Stewart, L. (2012). Perception of musical timbre in congenital amusia: categorization, discrimination and short-term memory. Neuropsychologia 50, 367–378. doi: 10.1016/j.neuropsychologia.2011.12.006 Mirman, D., Chen, Q., Zhang, Y., Wang, Z., Faseyitan, O. K., Coslett, H. B., et al. (2015). Neural organization of spoken language revealed by lesion-symptom mapping. Nat. Commun. 6:6762. doi: 10.1038/ncomms7762 Oechslin, M. S., Descloux, C., Croquelois, A., Chanal, J., Van De Ville, D., Lazeyras, F., et al. (2013). Hippocampal volume predicts fluid intelligence in musically trained people. Hippocampus 23, 552–558. doi: 10.1002/hipo.22120 Omigie, D., Müllensiefen, D., and Stewart, L. (2012). The experience of music in congenital amusia. Music Percept. 30, 1–18. doi: 10.1525/mp.2012.30.1.1 Patel, A. D., Iversen, J. R., Wassenaar, M., and Hagoort, P. (2008). Musical syntactic processing in agrammatic Broca’s aphasia. Aphasiology 22, 776–789. doi: 10.1080/02687030701803804 Patterson, R. D., Uppenkamp, S., Johnsrude, I. S., and Griffiths, T. D. (2002). The processing of temporal pitch and melody information in auditory cortex. Neuron 36, 767–776. doi: 10.1016/S0896-6273(02)01060-7 Penhune, V. B., Zattore, R. J., and Evans, A. C. (1998). Cerebellar contributions to motor timing: a PET study of auditory and visual rhythm reproduction. J. Cogn. Neurosci. 10, 752–765. doi: 10.1162/089892998563149 Peretz, I. (2016). Neurobiology of congenital amusia. Trends Cogn. Sci. 20, 857–867. doi: 10.1016/j.tics.2016.09.002 Peretz, I., Champod, A. S., and Hyde, K. (2003). Varieties of musical disorders. The montreal battery of evaluation of amusia. Ann. N.Y. Acad. Sci. 999, 58–75. doi: 10.1196/annals.1284.006 Ripollés, P., Marco-Pallares, J., de Diego-Balaguer, R., Miro, J., Falip, M., Juncadella, M., et al. (2012). Analysis of automated methods for spatial normalization of lesioned brains. Neuroimage 60, 1296–1306. doi: 10.1016/j.neuroimage.2012.01.094 Rondina, J. M., Filippone, M., Girolami, M., and Ward, N. S. (2016). Decoding post-stroke motor function from structural brain imaging. Neuroimage Clin. 12, 372–380. doi: 10.1016/j.nicl.2016.07.014
Frontiers in Neuroscience | www.frontiersin.org
18
July 2017 | Volume 11 | Article 426
Sihvonen et al.
Neural Basis of Acquired Amusia
Warren, J. D., Jennings, A. R., and Griffiths, T. D. (2005). Analysis of the spectral envelope of sounds by the human brain. Neuroimage 24, 1052–1057. doi: 10.1016/j.neuroimage.2004.10.031 Whiteford, K. L., and Oxenham, A. J. (2017). Auditory deficits in amusia extend beyond poor pitch perception. Neuropsychologia 99, 213–224. doi: 10.1016/j.neuropsychologia.2017.03.018 Zatorre, R. J., and Salimpoor, V. N. (2013). From perception to pleasure: music and its neural substrates. Proc. Natl. Acad. Sci. U.S.A. 110(Suppl. 2), 10430–10437. doi: 10.1073/pnas.1301228110
Tillmann, B., Leveque, Y., Fornoni, L., Albouy, P., and Caclin, A. (2016). Impaired short-term memory for pitch in congenital amusia. Brain Res. 1640, 251–263. doi: 10.1016/j.brainres.2015.10.035 Timpert, D. C., Weiss, P. H., Vossel, S., Dovern, A., and Fink, G. R. (2015). Apraxia and spatial inattention dissociate in left hemisphere stroke. Cortex 71, 349–358. doi: 10.1016/j.cortex.2015.07.023 Toiviainen, P., Alluri, V., Brattico, E., Wallentin, M., and Vuust, P. (2014). Capturing the musical brain with Lasso: dynamic decoding of musical features from fMRI data. Neuroimage 88, 170–180. doi: 10.1016/j.neuroimage.2013.11.017 Tramo, M. J., Shah, G. D., and Braida, L. D. (2002). Functional role of auditory cortex in frequency processing and pitch perception. J. Neurophysiol. 87, 122–139. doi: 10.1152/jn.00104.1999 Tzourio-Mazoyer, N., Landeau, B., Papathanassiou, D., Crivello, F., Etard, O., Delcroix, N., et al. (2002). Automated anatomical labeling of activations in SPM using a macroscopic anatomical parcellation of the MNI MRI single-subject brain. Neuroimage 15, 273–289. doi: 10.1006/nimg.2001.0978 Vaquero, L., Hartmann, K., Ripollés, P., Rojo, N., Sierpowska, J., Francois, C., et al. (2016). Structural neuroplasticity in expert pianists depends on the age of musical training onset. Neuroimage 1, 106–119. doi: 10.1016/j.neuroimage.2015.11.008
Frontiers in Neuroscience | www.frontiersin.org
Conflict of Interest Statement: The authors declare that the research was conducted in the absence of any commercial or financial relationships that could be construed as a potential conflict of interest. Copyright © 2017 Sihvonen, Ripollés, Rodríguez-Fornells, Soinila and Särkämö. This is an open-access article distributed under the terms of the Creative Commons Attribution License (CC BY). The use, distribution or reproduction in other forums is permitted, provided the original author(s) or licensor are credited and that the original publication in this journal is cited, in accordance with accepted academic practice. No use, distribution or reproduction is permitted which does not comply with these terms.
19
July 2017 | Volume 11 | Article 426