ORIGINAL RESEARCH published: 12 August 2015 doi: 10.3389/fmicb.2015.00789
Rhizosphere bacterial communities of dominant steppe plants shift in response to a gradient of simulated nitrogen deposition An Yang 1 , Nana Liu 1, 2 , Qiuying Tian 1 , Wenming Bai 1*, Mark Williams 3 , Qibing Wang 1 , Linghao Li 1 and Wen-Hao Zhang 1, 4* 1
State Key Laboratory of Vegetation and Environmental Change, Institute of Botany, Chinese Academy of Sciences, Beijing, China, 2 University of Chinese Academy of Sciences, Beijing, China, 3 Department of Horticulture, Virginia Polytechnic Institute and State University, Blacksburg, VA, USA, 4 Research Network of Global Change Biology, Beijing Institutes of Life Science, Chinese Academy of Sciences, Beijing, China Edited by: Jean-Baptiste Ramond, University of Pretoria, South Africa Reviewed by: Kristen M. DeAngelis, University of Massachusetts Amherst, USA Jose Mariano Igual, Instituto de Recursos Naturales y Agrobiología de Salamanca - Consejo Superior de Investigaciones Científicas, Spain *Correspondence: Wenming Bai and Wen-Hao Zhang, State Key Laboratory of Vegetation and Environmental Change, Institute of Botany, Chinese Academy of Sciences, Beijing 100093, China
[email protected];
[email protected] Specialty section: This article was submitted to Terrestrial Microbiology, a section of the journal Frontiers in Microbiology Received: 06 June 2015 Accepted: 20 July 2015 Published: 12 August 2015 Citation: Yang A, Liu N, Tian Q, Bai W, Williams M, Wang Q, Li L and Zhang W-H (2015) Rhizosphere bacterial communities of dominant steppe plants shift in response to a gradient of simulated nitrogen deposition. Front. Microbiol. 6:789. doi: 10.3389/fmicb.2015.00789
We evaluated effects of 9-year simulated nitrogen (N) deposition on microbial composition and diversity in the rhizosphere of two dominant temperate grassland species: grass Stipa krylovii and forb Artemisia frigida. Microbiomes in S. krylovii and A. frigida rhizosphere differed, but changed consistently along the N gradient. These changes were correlated to N-induced shifts to plant community. Hence, as plant biomass changed, so did bacterial rhizosphere communities, a result consistent with the role that N fertilizer has been shown to play in altering plant-microbial mutualisms. A total of 23 bacterial phyla were detected in the two rhizospheric soils by pyrosequencing, with Proteobacteria, Acidobacteria, and Bacteroidetes dominating the sequences of all samples. Bacterioidetes and Proteobacteria tended to increase, while Acidobacteria declined with increase in N addition rates. TM7 increased >5-fold in the high N addition rates, especially in S. krylovii rhizosphere. Nitrogen addition also decreased diversity of OTUs (operational taxonomic units), Shannon and Chao1 indices of rhizospheric microbes regardless of plant species. These results suggest that there were both similar but also specific changes in microbial communities of temperate steppes due to N deposition. These findings would contribute to our mechanistic understanding of impacts of N deposition on grassland ecosystem by linking changes in plant traits to their rhizospheric microbes-mediated processes. Keywords: nitrogen deposition, microbial diversity, rhizosphere, Illumina Miseq, temperate steppe, Artemisia frigida, Stipa kerlovii
Introduction Nitrogen (N), an essential mineral nutrient to plant growth, is one of the most limiting factors in many terrestrial ecosystems (Vitousek et al., 2002; Scheible et al., 2004; Asakawa and Kimura, 2008). However, elevated levels of N deposition are changing N inputs and impacting many ecological processes (Sala et al., 2000; Gilliam, 2006). Many ecosystems have developed under tight nutrient cycling and low amounts of available nutrients. In these systems, elaborate plant-microbial mutualisms have developed and are the foundation of ecosystem function (Reynolds et al., 2003).
Frontiers in Microbiology | www.frontiersin.org
1
August 2015 | Volume 6 | Article 789
Yang et al.
Nitrogen fertilization and rhizospheric microbial communities
Materials and Methods
Nitrogen deposition can disrupt these plant-microbial interactions, which may feedback to alter microbial communities and ecosystem function (Sala et al., 2000; Gilliam, 2006; Martinelli et al., 2006). Human industrial activities have led to a doubling, on average, of N deposition into terrestrial ecosystems and these inputs are expected to increase in the future (Galloway et al., 2004, 2008; Bodirsky et al., 2014). In China, N deposition has significantly increased over the last three decades, and in some regions are 5X greater than previous decades (Liu et al., 2013). Consequently, the impacts of N input due to deposition of atmospheric N on terrestrial ecosystems warrant further study (Galloway et al., 2004, 2008). Grassland ecosystems are highly sensitive to N deposition, where long-term N addition has been shown to significantly reduce plant species richness (Stevens et al., 2004; Clark and Tilman, 2008). The semi-arid grasslands in northern China, which are a part of the Eurasian steppe, are exposed to enhanced N deposition rates (Zhang et al., 2008; Liu et al., 2013), and experienced reductions in plant species richness (Bai et al., 2010; Song et al., 2011; Fang et al., 2012; Tian et al., 2015). Several mechanisms have been proposed to explain the decline in species richness by N deposition (Suding et al., 2005; Harpole and Tilman, 2007; Bobbink et al., 2010), and among them are changes in soil microbial activity and biodiversity (Chen et al., 2014; Dean et al., 2014). Nitrogen deposition to a variety of terrestrial ecosystems has also been shown to profoundly affect soil microbial communities (Ramirez et al., 2010, 2012; He et al., 2013; Liu et al., 2014b; Zhang et al., 2014), however, these studies have not emphasized the involvement of root-zone and rhizosphere microbes; rather they have mainly focused on microbes in soils generally. The rhizosphere niche is an important interface for plant-microbes interactions and key to the success of both plants and microbes (Bakker et al., 2013). Microbe communities in the rhizosphere soils differ from those in bulk soils (Berg and Smalla, 2009), thus deserving specific attention for understanding ecosystem responses to N deposition. It is conceivable that microbial communities in the rhizosphere of different plant species may respond more strongly and perhaps, differently, to N deposition. Recently, Dean et al. (2014) found that N deposition affected host-associated plant root-associated fungi, however, there was no broader description of fungal or rhizosphere bacterial communities. In the present study, we found that plant community shifted from co-dominance by a monocot grass, Stipa krylovii, and a dicot forb, Artemisia frigida, to exclusive dominance by a monocot grass in an Inner Mongolia steppe after 9-year of N addition. To test whether the microbial communities colonizing S. krylovii and A. frigida rhizosphere niche respond, and respond in similar or different ways to N addition, we used the high-throughput Illumina Miseq sequencing platform to characterize the rhizosphere microbial communities of the two dominant plant species under varying simulated N deposition rates. The following question was specifically addressed: Whether the rhizosphere microbial communities would be associated with plant host and its response to N deposition rate?
Frontiers in Microbiology | www.frontiersin.org
Study Site The experiment was conducted in Duolun county (42◦ 02′ N, 116◦ 17′ E, 1324 m a.s.l.), Inner Mongolia, China. The area is located in a semiarid temperate steppe where the mean annual temperature is 2.1◦ C and long-term annual precipitation is 382.2 mm (Yang et al., 2011; Fang et al., 2012). The soil in the area is chestnut (Chinese classification) and Haplic Calcisols (FAO classification). The soil bulk density is 1.31 g cm−3 and pH is about 6.84 (Fang et al., 2012). The dominant species in this typical temperature steppe are A. frigida, S. krylovii, Cleistogenes squarrosa, Allium bidentatum, Potentilla acaulis, Leymus chinensiss, Salsola collina, Carex korshinskyi, Melilotoides ruthenica, and Agropyron cristatum (Niu et al., 2008; Fang et al., 2012).
Experimental Design In the experimental area, 64 plots of 15 × 10 m separated by 4-m-wide buffer strips were established in an 8 × 8 Latin square experimental design. Nitrogen was added as urea (N, 46%) at the midpoint of the growing season (July) every year since 2003. There were eight levels of N fertilization including a control, 0 (N0), 1 (N1), 2 (N2), 4 (N4), 8 (N8), 16 (N16), 32 (N32), and 64 (N64) g N m−2 year−1 with ambient N deposition of 1.6 g N m−2 year−1 (Zhang et al., 2008). In the present study, the rhizosphere soil samples were collected from 32 plots with four levels of N fertilization, ambient (N0), 2 (N2), 8 (N8), and 16 (N16) g N m−2 year−1 . The rhizospheric soils from at least two individual plant roots of the two dominant species (S. krylovii, A. frigida) in each plot were sampled in August 2012 by collecting soils that were adhered to roots after vigorously shaking roots removed from field by a spade as described by Smalla et al. (2001). The rhizospheric soils were sampled from the eight plots under the four N addition levels, and the final three soil samples used for sequencing were obtained by randomly mixing the samples from 3, 3, and 2 plots, respectively. These ensure that the rhizospheric soil samples covered the eight replicates for N addition. Aboveground biomass in one quadrat (1 × 1 m) at each plot was clipped and determined since August 2004 as described by Fang et al. (2012).
Sequencing and Data Analysis The total genomic DNA was extracted from 0.5 g rhizosphere soils using the SoilGen DNA Kit (CWbiotech Corporation, China) according to the manufacturer’s instructions. PCR amplifications were conducted with the 515f/806r (GTG CCAGCMGCCGCGGTAA/GGACTACHVGGGTWTCTAAT) primer set that amplified the V4 region of the 16S rRNA gene (Peiffer et al., 2013). The primer set was selected as it exhibits few biases and should yield accurate taxonomic information. The reverse primer contained a 6-bp error-correcting barcode unique to each sample. The PCR reaction was carried out in R High-Fidelity PCR 30 µL reactions with 15 µL of Phusion Master Mix (New England Biolabs); 0.2 µM of forward and reverse primers, and about 10 ng template DNA. Thermal cycling
2
August 2015 | Volume 6 | Article 789
Yang et al.
Nitrogen fertilization and rhizospheric microbial communities
was consisted of initial denaturation at 98◦ C for 1 min, then 30 cycles of denaturation at 98◦ C for 10 s, annealing at 50◦ C for 30 s, elongation at 72◦ C for 60 s and finally 72◦ C for 5 min. PCR products were mixed in equal density ratios. Then, mixture PCR products were purified with GeneJET Gel Extraction Kit (Thermo Scientific). Sequencing libraries were generated R Ultra DNA Library Prep Kit for Illumina using NEB Next (NEB, USA) following manufacturer’s recommendations and index codes were added. The library quality was assessed on the Qubit @ 2.0 Fluorometer (Thermo Scientific) and Agilent Bioanalyzer 2100 system. At last, the library was sequenced on an Illumina MiSeq platform and 300 bp paired-end reads were generated. Pairs of reads from the original DNA fragments were merged by using FLASH-a very fast and accurate software tool which was designed to merge pairs of reads when the original DNA fragments were shorter than twice the length of reads (Magoc and Salzberg, 2011). Sequencing reads were assigned to each sample according to the unique barcode of each sample. Sequences were analyzed with the QIIME software package (Quantitative Insights Into Microbial Ecology) and UPARSE pipeline (Caporaso et al., 2010; Edgar, 2013). First, the reads were filtered by QIIME quality filters. Default settings for Illumina processing in QIIME were used. Then we used UPARSE pipeline to pick operational taxonomic units (OTUs) by making OTU table. After removal of chimera, sequences were assigned to OTUs at 97% similarity. We picked a representative sequence for each OTU and used the version 2.2 RDP classifier to assign taxonomic data to each representative sequence with default 0.8 as confidence threshold (Wang et al., 2007). Singleton OTUs that appeared in only one sample were removed because they could be potential sequencing errors. In order to compute alpha diversity, we rarified the OTU table and calculated three metrics: Chao1 metric estimated the species richness, the observed species metric was simply the count of unique OTUs found in the sample, and Shannon index. Rarefaction curves were generated based on these three metrics. QIIME calculated unweighted unifrac, which was used to do Principal Coordinate Analysis (PCA).
relative abundance of phyla were done before proceeding with ANOVA and post-hoc test. The assumptions of normality and homogeneity of variance were checked prior to conducting the statistical tests.
Results
™
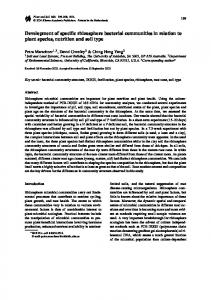
Nitrogen Addition Reduced and Enhanced Aboveground Biomass (AGB) of Forbs and Grasses Nitrogen addition for 9 years had contrasting effects on AGB of grasses and forbs, such that AGB of grasses and forbs was significantly (P < 0.05) increased and reduced by N addition, respectively (Figure 1A). The steppe community was co-dominated by grass S. krylovii and forb A. frigida in the control plot without N addition. The AGB of S. krylovii was enhanced by the N addition, while the same treatment led to a decrease in AGB of A. frigida (P < 0.05) (Figure 1B).
A
B
Sequence Accession Number The data were deposited in the National Center for Biotechnology Information Sequence Reads Archive with accession number SRS977347.
Statistical Analysis Considering that the N addition and plant host in the same plot may not be completely independent, we used the linear mixed models to analyze the effects of N addition on the rhizoshpere microbes at four levels with N treatment as the fixed effect and plant host as random effects. For each species, we conducted separate ANOVAs (Dunnett’s test) to determine the difference in the aboveground biomass (AGB), microbial diversity and relative abundance of phyla between N0 and different levels of N addition (SPSS 16.0). It was regarded as significant differences when P-value was less than 0.05. Square root transformation of the OTUs data and arcsine square root transformation of
Frontiers in Microbiology | www.frontiersin.org
FIGURE 1 | Effect of N addition on aboveground biomass of grasses and forbs (A), and S. krylovii and A. frigida (B). Aboveground biomass was determined in quadrats (1 × 1 m). N0, N2, N8, and N16 represent N addition rate of 0, 2, 8, 16 g ha−1 yr−1 . Data are means ± s.e. (n = 8). Asterisks on the top of columns indicate significant difference at P < 0.05 between N0 and different rates of N addition for each species.
3
August 2015 | Volume 6 | Article 789
Yang et al.
Nitrogen fertilization and rhizospheric microbial communities
Sequencing and Analysis of Rhizospheric Microbial Diversity
samples. The two-dimensional figure showed that the microbial community compositions in both S. krylovii and A. frigida rhizosphere niche with different N addition rates were distributed separately among each other, exhibiting differences in the microbial community structure. These results suggest that the S. krylovii and A. frigida rhizosphere microbiome had different composition and that the composition changed along the Ngradient.
We obtained a total of 1,931,731 clean reads after filtered by QIIME quality filters with default settings (Table A1). One sample from N0 plots was later excluded from analysis because of the low quality of the sequence reads. Rarefaction analysis was performed on each soil sample and none of the rarefaction curves reached the plateau phase, suggesting that soils were not sampled to saturation (Figure 2). Linear mixed model analysis indicated that OTU number, Chao1, and Shannon indices of rhizosphere microbes of both S. krylovii and A. frigida were significantly affected by the N addition (Figure 3 and Table 1). In control plot without N addition, the number of OTUs in the rhizosphere of S. krylovii and A. frigida was 6036 and 5957, respectively (Figure 3A). Nitrogen addition led to similar effects on microbial diversity in the rhizosphere of the two species. As N addition rate increased, the OTU number in both the S. krylovii and A. frigida rhizospheric niche decreased (Figure 3A). For example, the OTU number in the S. krylovii rhizosphere was decreased from 6036 to 5698, 5282, and 4583 in response to N addition rate of 2, 8, and 16 g N m−2 yr−1 . Similarly, the OTU number in the A. frigida rhizosphere niche decreased from 5957 to 5700, 5010, and 4567 in response to the same N addition rates (Figure 3A). In addition to the number of OTUs, changes in microbial diversity using the Shannon index and the total species richness estimated by the Chao1 index in the two rhizospheric soil samples were also compared among plots treated with different rates of N addition. Shannon and Chao1 indices in the two rhizospheric soils also showed similar trends with increases in N addition rates, such that N addition reduced Shannon and Chao1 indices in the rhizosphere of S. krylovii and A. frigida (Figures 3B,C). Principal component analysis was used to detect variation in the community composition. As shown in Figure 4, the two principal components accounted for 16.62% of the total microbial community variations among the individual
A
B
C
FIGURE 3 | Estimated number of observed (A) OTU counts, (B) Shannon index, (C) Chao1 index of S. krylovii and A. frigida rhizosphere microbiome across all the N-supplied plots. Data are means ± s.e. (n = 3). Asterisks on the top of columns indicate significant difference at P < 0.05 between N0 and different rates of N addition for each species.
FIGURE 2 | Rarefaction curves of all samples were generated for microbial OTUs which contained unique sequences and were defined at 97% sequence similarities.
Frontiers in Microbiology | www.frontiersin.org
4
August 2015 | Volume 6 | Article 789
Yang et al.
Nitrogen fertilization and rhizospheric microbial communities
TABLE 1 | F-value and P-value of analysis of variance for the effects of nitrogen addition, species and their interaction (nitrogen × species) on OTU, Shannon, Chao1 indices and the relative abundance of the phyla. Fixed factors
Nitrogen
d.f.
Species
Nitrogen × Species
3
1
3
OTU
F
252.74
7.99
3.18
P