open access
www.bioinformation.net
Software
Volume 9(17)
RNA-SSPT: RNA Secondary Structure Prediction Tools Freed Ahmad, Shahid Mahboob, Tahsin Gulzar, Salah U din, Tanzeela Hanif, Hifza Ahmad & Muhammad Afzal* Department of Bioinformatics and Biotechnology, G C University, Faisalabad, Pakistan; Muhammad Afzal - Email:
[email protected]; *Corresponding author
Received September 16, 2013; Accepted September 16, 2013; Published October 00, 2013 Abstract: The prediction of RNA structure is useful for understanding evolution for both in silico and in vitro studies. Physical methods like NMR studies to predict RNA secondary structure are expensive and difficult. Computational RNA secondary structure prediction is easier. Comparative sequence analysis provides the best solution. But secondary structure prediction of a single RNA sequence is challenging. RNA-SSPT is a tool that computationally predicts secondary structure of a single RNA sequence. Most of the RNA secondary structure prediction tools do not allow pseudoknots in the structure or are unable to locate them. Nussinov dynamic programming algorithm has been implemented in RNA-SSPT. The current studies shows only energetically most favorable secondary structure is required and the algorithm modification is also available that produces base pairs to lower the total free energy of the secondary structure. For visualization of RNA secondary structure, NAVIEW in C language is used and modified in C# for tool requirement. RNA-SSPT is built in C# using Dot Net 2.0 in Microsoft Visual Studio 2005 Professional edition. The accuracy of RNA-SSPT is tested in terms of Sensitivity and Positive Predicted Value. It is a tool which serves both secondary structure prediction and secondary structure visualization purposes.
Key words: RNA secondary structure prediction, C#, Nussinov algorithm, dot net
Background: RNA is not just an intermediate between genes and protein as messenger RNA (mRNA) which is often described as a linear, unstructured sequence, uninteresting but also for the protein amino acid that it encodes. However, many non-coding RNAs exist which adopt sophisticated three-dimensional structures, and even some of these catalyze biochemical reactions [1].
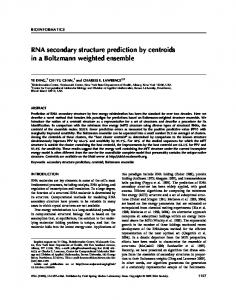
contacts are generally stronger than tertiary structure contacts and the formation of secondary structure occurs on a faster timescale than tertiary structure [4]. Therefore, RNA secondary structure can generally be predicted without knowledge of tertiary structure. Figure 1 explains the hierarchy of RNA structure [5]. RNA secondary structure consists of different structural elements. Part of RNA where no base pairs are found remains single stranded. When more than one base pair appears in the form of a group of contiguous base pairs, the resulting double stranded secondary structure is described as a stem. Bases that are attached with stems but do not base pair form loops. Simplest is the hairpin loop which consists of two complementary sequences joined by some non-pairing bases. An internal loop appears between two stems and may be symmetric or asymmetric (bulge). Another common secondary
RNA folds hierarchically [2, 3]. At the first level of organization is the primary structure, which is the sequence of nucleotides. The next level is secondary structure, the base-pairing according to the Watson-Crick complementarity; A binds with U, G binds with C; but also the less stable combination G with U, called wobble base-pair. Tertiary structure is the threedimensional arrangement of atoms and the quaternary structure is the interaction with other molecules, which are often either proteins or other RNA strands. Secondary structure ISSN 0973-2063 (online) 0973-8894 (print) Bioinformation 9(17): 000-000 (2013)
1
© 2013 Biomedical Informatics
BIOINFORMATION
open access
structure element is known as a multi-branch loop. It is a more complex structure that consists of several stem-loop type structures [6].
G, C and U) and the second line shows the dot-parenthesis expression.
Some other secondary structure elements like pseudoknots, kissing hairpins and loop-bulge interactions are also present due to complementary base pairing. These elements are important in tertiary structure formation and are usually very difficult to predict. Most of the RNA secondary structure prediction tools do not allow pseudoknots in the structure and unable to locate them.
Today, there are many RNA secondary structure prediction tools available but most of these are either web-based or run only in UNIX environment. Table 1 (see supplementary material) summarizes some well-known RNA secondary structure prediction tools. Only a few are available for Microsoft Windows as [10] “RNAstructure” [11, 12] but the output drawing is not very impressive.
The first method devised to predict RNA secondary structure was comparative sequence analysis [7]. This method infers base-pairs by determining canonical pairs that are common among multiple homologous sequences. Specific pairs are confirmed by the existence of compensating base-pair changes, where, for example, a GC pair in one sequence is replaced by an AU pair in another sequence. Comparative analysis is quite forceful when a number of homologous sequences are available. Over 97% of base-pairs predicted for ribosomal RNA were demonstrated in subsequent crystal structures. Comparative analysis has also been used to infer tertiary structure contacts. Comparative analysis, however, requires multiple sequences, can be time consuming and requires significant insights [8].
So, the need arises to develop the software tool, specific for Microsoft windows users, as there are many tools available for UNIX or other operating system users, with some graphical enhancements. Thus the aim and objectives for developing RNA-SSPT are: (i) To predict RNA secondary structure by just entering a single RNA sequence or from fasta file; (ii) To provide desktop software tool facility to a scientist in any version of Microsoft Windows (Windows XP or later version); (iii) To bring .NET technologies and C# language [13] in the field of bioinformatics; (iv) Software in which there is [12] facility to draw an already predicted structure that is in dotparenthesis format; (v) To find pseudoknots using Nussinov algorithm; (vi) Software that also calculates the GC content in the sequence and percentage of each nitrogenous base. (vii) A better drawing environment than other renowned secondary structure prediction tools; (viii) To have user friendly interface so that every task should be performed on single click environment.
To predict the secondary structure of a single sequence, the most popular approach is the dynamic programming. Two algorithms have mostly been used to predict [1] secondary structure from single sequence. These are Nussinov maximum base pairing algorithm and Zuker free energy minimization algorithm. Both are based on dynamic programming. Dynamic programming is an algorithmic technique that organizes computations to avoid re-computing values that are already known, which can often save a great deal of time [9]. Problems having the overlapping sub-problems property [1] are almost always solved using dynamic programming, a catch-all term for any algorithm in which the definition of a function is extended as the computation proceeds. This is generally accomplished by constructing a solution “bottom up” (e.g., progressing from simpler to more complex cases), the goal being to solve each sub-problem before it is needed by any other sub-problem [10]. Now free energy minimization approach is mostly used for [9] Wagner DB, predicting secondary structure with greater success [9, 1]. Because RNA structure determination is often experimentally difficult despite tremendous advances in RNA crystallography, nuclear magnetic resonance spectroscopy, and chemical modification, RNA structure prediction serves as an important tool for generating hypotheses about structure-function relationships in RNA. RNA structure prediction can be useful for interpreting or designing mutagenesis experiments, identifying conserved structural features and designing siRNA strategies [3]. RNA secondary structure can be described in many formats like dot-parenthesis format, .ct file format and RNAML (RNA Markup Language) format etc. but most common and simple is dot-parenthesis format which shows bases that forms base-pair as nested parenthesis and loops, and other bases as dots. In .dp file format, the first line describes the bases in alphabets (e.g. A, ISSN 0973-2063 (online) 0973-8894 (print) Bioinformation 9 (17): 000-000 (2013)
Figure1: RNA structure: (a) primary structure, which is the nucleotide sequence of the RNA; (b) The secondary structure, which is the folded RNA that forms upon intra-strand base pairing. (c) The tertiary structure, which is the threedimensional RNA that forms upon higher-order interactions among the base-paired regions (P1, P2, etc.) (Lehman, N., 2010). 2
© 2013 Biomedical Informatics
BIOINFORMATION
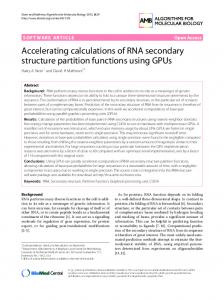
open access of length 0 or 1 have no base pairs, so B(i, i) = B(i, i − 1) = 0 (by convention, the i, i − 1 cells represent zero length sequences; the recursion must never access an empty matrix cell) then worked outwards on larger and larger subsequences, until reached the upper right corner, as shown in the bottom of Figure 2.1. This corner is B(1,N), the score of the optimal structure for the complete sequence from i = 1 to j = N. Then, from that point, recovered the optimal structure by tracing back the optimal path that got us into the upper corner, one step in the structure at a time. Simple energy minimization Maximizing the number of base pairs as described above does not lead to good structure predictions. Better predictions can be obtained by minimizing the free energy for an RNA sequence. Reasonable values for e at 37oC are −3, −2 and −1 kcal/mol for base pairs C − G, A − U and G − U, respectively. Using this we generalize the Nussinov algorithm such that the free energy of a base pair is considered. In the algorithm e(i, j) is now used rather than the simple +1. Function e(i, j) generate energy values based on the base pairing found. Since the free energy of a base pair is negative the algorithm search for the structures with overall minimal energy. Thus the recursion formula is [17, 18] (Please see supplementary material for equation and explanation).
Figure 2: Nussinov algorithm steps: a. the four cases examined by the dynamic programming recursion; b. The dynamic programming algorithm in operation. (Eddy S.R. 2004) Methodology: The software developed for the prediction of RNA secondary structure was solely based on the information of single input RNA sequence. The development of software involved following steps: Algorithm Used Nussinov dynamic programming algorithm was used for predicting RNA secondary structure in the development of RNA-SSPT. For visualization of RNA secondary structure from dot-Parenthesis expression to secondary structure, NAView.c program [14] was converted into NAView.cs. Some help was taken from Naview.java in the VARNA tool (a java based RNA secondary structure display tool) by [15]. NAView.cs takes input in the dot-parenthesis format and calculates the coordinates of each base of input sequence. Nussinov algorithm implementation Base pair maximization is the simplest approach to predict the secondary structure of RNA. Testing and scoring each possible structure is numerically impossible so dynamic programming must be used for an efficient solution. In 1978, Nussinov [16] published a method to do so. The basic mathematical recursive function for the matrix fill, of an RNA string containing N nucleotides is given below: (Please see supplementary material for equation). In the above described manner, a two dimensional array is filled recursively. Then this matrix was traced back to find the best optimal folding containing maximum base pairs. Figure 2(b) shows the matrix B(i, j) for a sequence GGGAAAUCC after initialization, after the recursive fill, and after an optimal structure with three base pairs has been traced back.
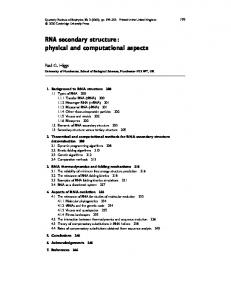
Figure 3: Sequence Diagram of RNA_SSPT Tools Used for Software Development: (i) Microsoft Visual Studio 2005 Professional Edition (ii) Microsoft .Net version 2.0 (iii) Microsoft Visual C#
To run this recursion efficiently, the scores B(i, j) were tabulated in a triangular matrix. Initialized on the diagonal; subsequences ISSN 0973-2063 (online) 0973-8894 (print) Bioinformation 9 (17): 000-000 (2013)
3
© 2013 Biomedical Informatics
BIOINFORMATION
open access
Sequence Diagram: A sequence diagram is a kind of interaction diagram in UML, which shows how processes operate with one another and in what order. It is a construct of a Message Sequence Chart. Sequence Diagram of RNA-SSPT is shown in (Figure 3).
sequence can converted to RNA by using “TranscribetoRNA”. Sensitivity and Positive Predicted Values can also be calculated. Accuracy Results: Accuracy calculation results of different RNA sequences of table 2 are given in the table 3.
Interface Design: Interface was designed in Microsoft Visual Studio 2005 using “System.Windows.Forms” class. Menu strip was dragged and dropped onto main form from tool box. Icon and Front image of main menu was developed in Macromedia Flash 8.0. Remaining coding was done in Microsoft Visual C#.
Comparison of pseudoknots: STRAND ID # PDB_00908 also contains pseudoknots. Its pseudoknots were calculated by RNA-SSPT and compared with the actually known pseudoknoted secondary structure. The result of this comparison is shown in Figure 4.
Accuracy Testing: The accuracy of RNA-SSPT was tested by the sensitivity and Positive predictive value [8]. Sensitivity is the percentage of known base pairs correctly predicted:
Sensitivity =
Comparison of graphical outputs: Comparison of graphical outputs of both RNA-SSPT and RNAstructure 5.1, which is also a windows-based RNA secondary structure prediction and analysis tool, for the same RNA sequence “GGGAACCACAUUUCAACA” is shown in Figure 5.
# of predicted pairs in predicted structure × 100 Total # of pairs in the known structure
Discussion: RNA-SSPT is a user-friendly RNA secondary structure prediction tool which accepts RNA input in different forms either by keyboard input or by opening text files or fasta files. If the user has DNA sequence, the transcription option is available which converts DNA into RNA. It also predicts pseudoknots by reusing the same nussinov algorithm in a unique way. It compares the results of RNA-SSPT either in pseudoknot free secondary structure form or in pseudoknotted structure with known secondary structures in the database.
Positive predictive value is the percentage of predicted base pairs that are in the known structure: # of predicted pairs in known structure Positive predicted value= × 100 Total # of pairs in the known structure Known Structures: STRAND [19] database provides a wide collection of known RNA secondary structures drawn from public databases, searchable and downloadable in a common format. Six different types of RNA sequences were taken for the STRAND database. The detail about those sequences is given in Table 2 (see supplementary material). These six sequences were used to calculate the accuracy of RNA-SSPT.
RNA-SSPT is developed to detect the maximum occurring of base pairs in a single RNA sequence. Different types of RNA sequences of known secondary structure, taken from STRAND database, are used to test the accuracy of RNA-SSPT. The software performed quite well for these RNA data sets and showed good results for “Positive Predictive Value”. The sensitivity of RNA-SSPT is much higher which confirmed that base pair maximization approach must not be used solely to predict the exact secondary structure of a given single RNA sequence.
Pseudoknot Prediction: Pseudoknots in secondary structure of STRAND ID # PDB_00908 were also predicted with RNA-SSPT. For this, the pseudoknots were removed from the actual secondary structure and dots were used in their place. Then predicted them with RNA-SSPT and compared with actual secondary structure. Drawing Comparison: “RNAstructure” is a windows-based software package for RNA secondary structure prediction and analysis. The drawings of RNA secondary structures of both RNA-SSPT and RANstructure 5.1 for same secondary structures were also compared to check whose result is graphically better Table 3 (see supplementary material). These were used to test the accuracy of RNA-SSPT. PDB (www.pdb.org) is Protein Data Bank and Rfam [19, 20] is database for RNA families.
The results produced by RNA-SSPT were encouraging, there are several areas where the program could be improved and work could be continued in many directions. The algorithm implemented, is not very efficient in correct prediction of secondary structures for larger RNA sequences. The Zuker Free Energy minimization dynamic programming algorithm [20, 21] can be implemented in RNA-SSPT to make it globally acceptable. As most of the applications of Zuker algorithm works only on UNIX operating systems or are web-based, the tool can make its place as being user friendly and windowsbased.
Facilities Provided: RNA-SSPT is a user friendly software, providing the user to input RNA sequence, and facilitating to open sequence in any text file or in a fast file. It enables the user to graphically draw RNA secondary structure by just entering its sequence and its known secondary structure in dot-parenthesis format. It calculates the sequence information like GC content etc. DNA
The algorithm [13, 14] used for calculating coordinates of nucleotides is old but still used in most of RNA secondary structure prediction and drawing tools. RNA-SSPT also implements it, but there are some new vector based [21, 22] and planer drawing [22] algorithms available which can be used in RNA-SSPT to make it better than most of secondary structure tools.
ISSN 0973-2063 (online) 0973-8894 (print) Bioinformation 9 (17): 000-000 (2013)
4
© 2013 Biomedical Informatics
BIOINFORMATION
open access Acknowledgement: All the work was done and supported by department of Bioinformatics and Biotechnology, G C University, Faisalabad, Pakistan.
The salient features of present software are; the software is easy to use and it has friendly graphical user interface. This software is fast and works in a single click. All parts of RNA-SSPT work properly and give effective output. It also checks input and prompts user to enter valid sequence or secondary structure for comparison. Overall the predictive part of RNA-SSPT is error free.
References: [1] Mathews et al. Proc Natl Acad Sci USA. 2004 101: 7287 DOI:10.1073/pnas.0401799101 [2] Tinoco JR & Bustamante C, J Mol Biol. 1999 293, 271 [3] Schroeders J, Journal of virology. 2009 83: 6326 [4] Woodson SA, Cell Mol Life Sci. 2000 57: 796 [5] Lehman N, Wiley Interdisciplinary Reviews – RNA. 2010 1: 202 [6] http://www.ncbi.nlm.nih.gov/bookshelf/br.fcgi?book=m boc4&part=A1119 [7] Pace NR et al. The RNA World. 1999 pp. 113-141. [8] Mathews DH, Predicting RNA secondary structure by free energy minimization: Theoretical Chemistry Accounts: Theory, Computation, and Modeling (Theoretica Chimica Acta) Springer Berlin / Heidelberg, 2006 116: 160 DOI:10.1007/s00214-005-0027-7 [9] http://www.mathematicajournal.com/issue/v5i4/columns/wagner/ [10] Mathews DH et al. Cold Spring Harb Perspect Biol. 2010 1: 15 DOI: 10.1101/cshperspect.a003665 [11] Reuter & Mathews, BMC Bioinformatics. 2010 11: 129 [12] http://www.microsoft.com/net/overview.aspx [13] Bruccoleri R & Heinrich G, Computer Applications in the Biosciences 4, pages 167–173. 1988 DOI: 10.1093/bioinformatics/4.1.167 [14] Darty K et al. Bioinformatics. 2009 25: 1974 [15] Nussinov R et al. SIAM J Appl Math. 1978 35: 62 [16] EDDY SR, Nature Biotechnology. 2004 22: 1457 [17] Nussinov R & Jacobson AB, Proc Nati Acad Sci. 1980 77: 6309 [18] Andronescu et al. J BMC Bioinformatics. 2008 9: 340 [19] Griffiths-Jones S et al. Nucleic Acids Res. 2003 31: 439 [20] Zuker M & Stiegler P, Nucleic Acids Research. 1981 9:133 [21] Han K et al. Bioinformatics. 1999 15: 286 [22] Auber et al. Journal of Graph Algorithms and Applications. 2006 10: 329
Figure 4: Comparison of pseudoknots.
Figure 5: Comparison of graphical outputs. In background, the output of RNAstructure and front matter is the output of RNASSPT.
Edited by P Kangueane Citation: Ahmad et al. Bioinformation 9(17): 000-000 (2013) License statement: This is an open-access article, which permits unrestricted use, distribution, and reproduction in any medium, for non-commercial purposes, provided the original author and source are credited
ISSN 0973-2063 (online) 0973-8894 (print) Bioinformation 9 (17): 000-000 (2013)
5
© 2013 Biomedical Informatics
BIOINFORMATION
open access
Supplementary material: Methodology: Nussinov algorithm implementation The basic mathematical recursive function for the matrix fill is
In the above described manner, a two dimensional array is filled recursively. Then this matrix was traced back to find the best optimal folding containing maximum base pairs. Figure 2(b), shows the matrix B(i, j) for a sequence GGGAAAUCC after initialization, after the recursive fill, and after an optimal structure with three base pairs has been traced back. To run this recursion efficiently, the scores B(i, j) were tabulated in a triangular matrix. Initialized on the diagonal; subsequences of length 0 or 1 have no base pairs, so B(i, i) = B(i, i − 1) = 0 (by convention, the i, i − 1 cells represent zero length sequences; the recursion must never access an empty matrix cell) then worked outwards on larger and larger subsequences, until reached the upper right corner, as shown in the bottom of Figure 2.1. This corner is B(1,N), the score of the optimal structure for the complete sequence from i = 1 to j = N. Then, from that point, recovered the optimal structure by tracing back the optimal path that got us into the upper corner, one step in the structure at a time. Simple energy minimization:
This formula was implemented in the same manner as the base pair maximization. Table 1: Some already available RAN Tools Program URL RNAstructure http://rna.urmc.rochester.edu/ RNAstructure.html Sfold UNAFold/Mfold
http://sfold.wadsworth.org/ http://mfold.bioinfo.rpi.edu/
Vienna RNA Package
http://www.tbi.univie.ac.at/RNA/
Table 2: Summary of Accuracy Calculation Results Type of sequence Sensitivity Cis Regulatory 118.8 Hairpin Ribozyme 100 Group I Intron 117.9 Group II Intron 107.7 Small Nuclear RNA 100 Viral & Page 100 Average 107.4
Features JAVA/Windows, Graphical User Interface; Command Line Interface; C++ Class Library Web server Web server; Command Line Interface Web server; Command Line Interface; C Function Library
Positive Predictive Value 90.6 60.2 75.4 92.3 45.8 92.3 75.6
Table 3: Different RNA types with known secondary structures Type of RNA sequence Sequence Length STRAND Database ID
External Source
Cis Regulatory Hairpin Ribozyme Group I Intron Group II Intron Small Nuclear RNA Viral & Page
Rfam ID # RFA_00799 PDB ID # 1M5K PDB ID # 1ZZN PDB ID # 1KXK PDB ID # 2OZB PDB ID # 1R7W
101 226 222 70 66 34
ISSN 0973-2063 (online) 0973-8894 (print) Bioinformation 9 (17): 000-000 (2013)
RFA_00799 PDB_00555 PDB_00908 PDB_00136 PDB_01199 PDB_00203
6
© 2013 Biomedical Informatics