International Journal of Computer and Electrical Engineering
Robot Task Planning on Multiple Environments Paulo Pinheiro1*, Jacques Wainer2, Eleri Cardozo1 1 School 2
of Electrical and Computer Engineering, University of Campinas, SP, 13083-970, Brazil. Institute of Computing, University of Campinas, SP, 13083-852, Brazil.
* Corresponding author. Email:
[email protected] Manuscript submitted June 9, 2014; accepted October 20, 2014. doi: 10. 17706/ijcee.2014.v6.863 Abstract: This paper presents a hierarchical planning approach to solving the global localization problem for mobile robots using a compaction map method. This approach uses architectural design features such as walls and doors to break the environment into rooms and cluster them by similarity constraints. Each group of similar rooms is mixed into a single, compact representative map. Lighter POMDP plans are generated only for these compact maps and not for the whole environment, decreasing size of the set of possible states. In the higher layer of the planner, the robots use the compact maps to define which group of rooms they are located in. In the lower layer, the specific room of a representative map is isolated and its probability distribution is used to find out the precise localization. We demonstrate the hierarchical approach and the new map compaction with experiments on both V-REP Simulator and a Pioneer 3DX robot. This approach allows the robot to perform both the localization and tasking in a large-scale environment while keeping the accuracy. Key words: Mobile robot, localization, task planning, POMDP.
1. Introduction Localization for mobile robots is one of the most explored areas in robotics due its importance for the autonomous mobile robots. In cases where the robot's pose may be uncertain or unknown, the autonomy is directly related to the ability of the robot to locate itself and planning for actions is one of tools can be used to improve this skill. In this paper, one of our concerns is to solve the localization problem using planning. If the robot's pose is unknown, but the robot is in a partial or well known environment, a sequence of planned actions can lead the robot to maximize the useful observations and therefore to find out its pose more quickly. These plans are functions made of the probability distributions of the robot's pose, actions and observations, and only depend on the environment and the robot's features, thus they can be precomputed. We use a Partially Observed Markov Decision Process (POMDP) to model the plans. We are considering that the robot can act towards its goals at the same time it acts to locate itself. We will mix thelocalization plan with the goal plan at execution time. The robot will be able toexecute both mission task and localization reaching its goal faster. Let's suppose the robot's main task is to move out to a specific point on the environment and the robot does not know its location. The planner defines a set of actions that is a trade-off between the localization optimal path (precomputed by the POMDP planner) and the tasking path in order to decrease the total number steps
444
Volume 6, Number 6, December 2014
International Journal of Computer and Electrical Engineering
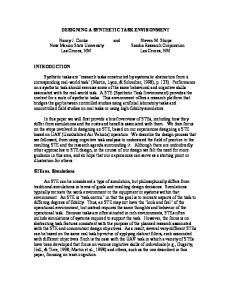
performed as shown in Fig. 1. Light and precise plans for large-scale environments is also a requirement. Solving a POMDP localization plan can be quite expensive for large-scale environments due the number of states and transition functions. We will show a compressing map approach, where the original large-scale map can be broken into smaller maps, and similar rooms can be condensed creating new representative compacting the map, as shown in Fig. 2. From the original map (Fig. 2a), the representative rooms can represent one or more similar rooms using a small number of states s. These new representative rooms are connected into a topological graph map and POMDP plans are generated only for each new representative maps (Fig. 2c), instead of for the whole environment (Fig. 2b). Summing up, our contributions on this paper are: (i) A hierarchical planning model for localization and tasking simultaneously; (ii) A model for decomposing maps into a smaller map, and (iii) An approach for clustering similar rooms in order to generate a condensed map representation.
Fig. 1. (a) The Pioneer 3DX robot at our lab. (b) Optimal path just for localization. (c) The optimal path just for the task. (d) Simultaneously localization and tasking path is shorter than the sequential combination of the path (b) and the path (c).
Fig. 2. (a) The original map with 3308 states is broken up into rooms. (b) Similar rooms are grouped. For each group, a new representative roomis created. (c) The representative rooms create the graph with 1824 states distributed in 6 different plans.
2. Related Works Many works [1]-[5] have describe approaches where the location is found with no planning of actions at all, but with random actions and not considering a final tasking. In this line, some studies used Monte Carlo Localization process for solving global localization problems where particle filters are used to update the
445
Volume 6, Number 6, December 2014
International Journal of Computer and Electrical Engineering
localization belief. An advantage of this method is the Bayes filter computational complexity that can be reduced by using a representation of the belief made by a set of samples [2]. Planning for localization can be found in many other works. Toda et al. [6] introduced a multilayer approach of planning where it was possible to use a preplanning, on-line planning and adaptive planning to solve localization and mapping problem. Works such as in [7]-[9] described ways to perform the localization using triangulation of natural or artificial landmarks. In our work we use planning based on observations, actions and belief probability. Some works applied Markov Localization Process to planning actions for localization. In Fox et al. [10], the method defined an optimal sensing action sequence based on the increase of localization probability entropy and the sensing cost. Occupancy grid within cells sized similar to ours represents the environment. However, this representation cannot be efficiently applied on large-scale environment and even on partially observable maps. Bayesian networks have also been used to find solution for the robot localization problems. In Asoh et al. [11], Bayesian networks were applied for the localization problem using local information but no action planning. Zhou and Sakane [12] proposed a general hierarchical approach to solve sensor planning for the global localization. They use a topological map in the higher layer with a Bayesian network to find actions strategies, and particle filter in the lower layer for a more precise localization. In Fox et al. [10] the Markov Localization method seems to be more accurate than in Zhou and Sakane [12] since the process takes place on an occupancy grid map. However, it solves problems for large-scale environments. In that work, they initially decompose the environment map into large cells and clustering these cells based on their geometrical features. Our process also uses a multi-level approach, saving some differences, i) We use architectural features, such as doors and walls to decompose and to cluster similar rooms, and ii) We apply POMDP to estimate the gross and the precise localization in a grid representation. Our work proposes a hierarchical multi-level localization approach to handle with large-scale environments as in Zhou and Sakane [12], keeping the precision found in Fox et al. [10], and solving the localization problem in a task oriented way.
3. Architecture of System The architecture of the system is composed of the Map Compactionand theMulti-Level planning, as shown in Fig. 3. We describe the system approach in the general steps: 1) The original map is decomposed into rooms; 2) The rooms are grouped based on the architectural features similarity (walls measure, number of doors, windows, vertices...); 3) Each group of rooms creates a compact and representative map by the overlaying process; 4) Creating a graph to connect all representative rooms; 5) Applying a multi-level POMDP planning process for localization and tasking, the robots use the plans in the higher layer with the compact representative rooms to find out the group they are into; 6) Then, it accesses the lower layer to infer the precise pose with 10 cm of accuracy. The difference between both layers is the probability distribution. In the lower layer, the representative map is more likely the original room map where the robot is in, due the decrease of probability distribution entropy. The task is used at the execution time in both layers. The POMDP time complexity of an exhaustive search to depth d is O Ad S d K d [13], where A is the number of actions, S is the number of possible states, and K is the number of available observations. The representative maps can drastically decrease the set of possible states S, and since plans are generated individually, it's possible to generate inexpensive and light POMDP plans.
446
Volume 6, Number 6, December 2014
International Journal of Computer and Electrical Engineering
4. Splitting and Clustering of Similar Rooms A house or an office can be divided into rooms or small regular spaces. A room is, by definition, the space that can be occupied or where something can be done. These rooms can be classified by type (bedrooms, bathrooms, hallways...) or by some architectural design features (measure, number of door/windows, etc.) [14]. In general, indoor environments can be divided into rooms using architectural features and these can be classified and grouped using some criteria [15].
Fig. 3. Processes and outputs of the system. This work takes full advantage on the symmetric patterns and repetition of indoor environments. However, it is not restricted to it. We do not assume that rooms are exactly equal, in fact we allow for (relatively small) differences among the rooms. To define what a room is, we have to bring out the concept of breakout point. A breakout point is anywhere between one room and another in which the robot can pass through. For this work our algorithm considers doors as breakout points. Thus, a room is any space holding at least one door. The Fig. 4a shows all breakout points of the map. The algorithm automatically gets rid of all rooms that have no doors. The follow step is to define the similarity of rooms, applying the clustering algorithm. The Fig. 4b shows the result. The decomposing and clustering algorithms works based on the number of vertices v, size range s, and number of doors d of each room. See the Algorithm 1. Algorithm 1: Clustering Algorithm function CREATECLUSTERS (Map map) while noMoreDoors do breakOutPointList←getAllBreakout(); end while for all breakOutPointList do function DEFINEROOM (BreakoutPoint d) points←AllPoint (d.start, d.end); room←newRoom(d.start, points, d.end); roomsList.add(room); end function end for for all roomsList do function CLUSTERING(RoomList roomsList) Clustering(v, s, d); end function end for end function
447
Volume 6, Number 6, December 2014
International Journal of Computer and Electrical Engineering
5. Overlaying Similar Rooms In the previous step, the rooms were grouped into clusters by similarity. A room is represented by a grid G where each cell has a type: k = {empty cell, wall cell, window cell, door cell}. To create a representative room for each group, we overlap the map of the room's group. When two or more cells of the same type are overlapped, we have a perfectly overlay. It means, in the new representative room grid, the cell ci will be that kind k of cell with probability 1. A non-perfectly overlay occurs when two or more different types of cell are overlapped. In this case, the cell ci has the probability in somewhere between 0.1 and 0.9 of being k.
Fig. 4. (a) The input map and its breakout points. (b) Similar rooms grouped by number of vertices, size and doors; 6 groups were found. Assuming t is the number of rooms in a group, the weight for each cell overlapped will be 1/t. To define the probability for all perfectly overlapped and non-perfectly overlapped features the planner model uses
P(kc ) n (1/ t ) , where P(kc ) is the probability of having that kind of feature at the cell c, and n is the number of layers that is perfectly overlapped. See Algorithm 2. Algorithm 2: Algorithm of Probability Variety Calculation Function CALCULATINGP(NewRoom R) t←getNumberLayers(); weight←1/t for all Cells c in R do for all Kind k do k ← get_k(); n←getNumberPerfectlyOverlapped(k); P(kc)=n×(1/t) R.setP(c, k, P(kc)) ⊲ Probability cell c for k end for end for end function
5.1. Rotation and Mirroring There is more than one way to overlap similar rooms. Depending on the vertices used to be the join referential, we can find a different overlaying setups, therefore different probability variation of P(k). In order to maximize the perfectly overlaps, the algorithm applies rotation and mirroring over the rooms to fit its cells over the same type cells of other rooms. Whenever the rotation or mirroring technique is used, a flag is set into the plan. This flag will determine when the observations and actions made by the robot can have a rotated or mirrored representation on the
448
Volume 6, Number 6, December 2014
International Journal of Computer and Electrical Engineering
planning model. Rotate and mirroring functions are applied until reach the maximum match value f of the elements, as described in the Algorithm 3. At the end of the process, each group has a representative room map full filled of overlapped information represented by different probabilities, and a graphical representation: a gray scale, for the different degrees of non-perfectly overlaps; black, for the perfect overlaps; and white color, for free cells. In our map, we can find 6 groups of similar rooms, as shown in Fig. 5. Algorithm 3: Overlaying Algorithm function OVERLAYING ELEMENTS(Group G) L←getTheLagerst(G); ⊲ Organizing using the largest room as an initial base; for all Elements e in G do fittingvalue f; f←Overlay(e, L); while (Rotation and Mirroring) is over do f←ApliesRotationMirroring(e, L); return MAX(f, orientation, composition) ⊲ return optimal f; end while R←UpdateNewRoom (composition); ⊲ Updating the new room with the new composition; setFlagPlanner(orientation); ⊲ Setting direction flag; end for CalculatingP(R) ⊲ See Algorithm 2 end function
Fig. 5. Representative rooms built from the similar rooms overlapping. All groups are made by two elements overlapped, but the group (c) that is made by only one element. After the mirroring and rotation processes, all groups have elements where the overlapping is clean, with no conflict at all, but the group shown in Fig. 5a. In this group, both overlapped rooms have same features and size, but the doors positions are different. Thus, the new representative room has uncertain differences, where the probability distribution is different of 1 at the doors position. In this group we have two elements, t=2, and in these cells we have different features overlapped (wall-on-door and door-on-wall), so we have, ndoor =1 and nwall =1 for these set of cells; thus P(bdoor ) n (1/ t ) , P(bdoor ) 1/ 2 , and P(bwall ) n (1/ t ) 1/ 2 . The belief probability for these cells (doors, in gray scale) in Fig. 5a is 0.5 for the wall and 0.5 for the door.
5.2. Connection Graph Applying breakout points it’s possible to connect all representative rooms in a connection graph as shown in Fig. 6. The graph will be used to define where the robot is about to go when it finds a breakout point and
449
Volume 6, Number 6, December 2014
International Journal of Computer and Electrical Engineering
when select a new plan. The Table 1 shows the comparative between the original map and the new compact representation for number of states on the grid and number of plans precomputed. Also, we can have a sight about the biggest or smallest plan loaded on memory.
Fig. 6. Graph of the representative rooms. Table 1. Comparing the Original to the Compact Representation Features Number of States Number of Plans Largest Plan on Memory Smallest Plan on Memory
Original Map 7104 1
Compact Rep. 4320 6
7104
1201
7104
192
6. Combining Vectors for Localization and Task Planning For each representative room in the previous step, a POMDP (Partially Observable Markov Decision Process) plan is created. A POMDP model is a tuple , where S is a finite set of states, A is a finite set of actions, T is a Markovian transition probability, R is a reward function, W is a finite set of observations and O is a table of observations probabilities [16]. It is possible to model a localization problem as POMDP where policies show optimal sequences of actions to be performed in order to find the robot pose, using the localization technique mentioned [17]. At execution time, given its current belief state regarding its pose, the plan will define which action will optimally locate it. But at execution time the robot may also consider its current task, and combine the actions defined by the localization plan and the ones defined for achieving its task given that the robot is in its most likely pose. If the robot is only mildly uncertain regarding its pose, the task action should have a higher influence. This composition is achieved by the vector result of both actions. Example 1 (map 33): A robot is in a 33 size environment, made up of 1×1 size cells, as shown in Fig. 7a. The environment has an obstacle and 8 free cells. The robot is at the start point and must reach the task point marked by X as a final task. The robot does not know its pose. Step 1: Calculating L : The best action to find the robot’s pose is calculated using the POMDP planner.
450
Volume 6, Number 6, December 2014
International Journal of Computer and Electrical Engineering
This action is the same for all cells since the planner considers the probability distribution of the entire map. Thus, the localization vector is the same for all cells and each cell contains the vector L indicating the action that can max out the robot's localization, as shown in Fig. 7b. Step 2: Calculating G : Let's suppose the probability distribution indicates the robot is at the lower right cell (3,3). The tasking vector points towards the goal ( G ), as shown in Fig. 8a. Step 3: Resizing L : The size of the vector L must be inversely proportional to the localization probability, P(l ) , in other words, L (1 P(l )) . If the robot is uncertain about its pose, for example, P(l ) =0.1 , then L =0.9 . If the robot is quite sure about its pose, for example, P(l ) =0.9 , then the vector
L =0.1 . The lower the certainty about the position, the greater the influence of the localization vector L .
The greater certainty about its pose, the lower the localization vector influence on it.
Fig. 7. (a) Original map. (b) Localization vectors.
Fig. 8. Definition and scaling vectors. Step 4: Resizing
: The next step is to resize the goal vector
, calculated as
. When the
robot is uncertain, the goal vector has less influence. If P(l) is high, the robot has a good estimative of its location, being ready to go to the goal. Summarizing, if P(l) is a quite low, will be low. Otherwise, if P(l) is high,
is low and
will be high and
is high, as shown in Fig. 8b.
Step 5: Combining vectors finally, we combine the vectors, as shown in Fig. 8c. The resulting vector defines the action to be done. It may happen a vector cancel out each other. In this case, the tasking vector turns null and the localization process has the preference. Once again, this vector combination approach is not required if we desire to resolve only the localization problem [18]. However, if we have a final task to get done concurrently with a localization problem, it will be required.
7. Experiments We set up three experiments using the map introduced earlier. The map is made up of 10 rooms, a big hallway and the final task is reaching this hall. The Pioneer 3DX is equipped with a laser rage sensor covering about 180°view. The robot can perform four different actions: go forward, go backward, turn left and turn right. We have used the V-REP Pro Simulator [19].
7.1. Experiment 1–A Good Opening Plan In the first experiment, we will force the robot to pick out the correct plan as the initial/opening plan. The
451
Volume 6, Number 6, December 2014
International Journal of Computer and Electrical Engineering
correct plan is the plan that matches the room where the robot is. In this experiment the robot is located at the lower left room of the map as shown in Fig. 9a. The first moves allow the robot to recognize in the higher layer which group of rooms it is in, and whether it has been using the correct plan or not. Finding its group, the breakout point is the way to go, as shown in Fig. 9b. The belief probability distribution comes up just at the points where these breakout points can be found on the map: lower left room's door and lower right room's door. At the breakout point, the robot loads the other room's plan according to graph of connections, as shown in Fig. 9c. Knowing the group it is in, the robot finds its room and its pose, using the lower layer of the hierarchy, and finally gets the task done, as shown in Fig. 9d.
Fig. 9. Experiment 1. V-REP scenery | Robot position on the map | Representative room (plan) has been used for each time.
7.2. Experiment 2–A Good Opening Plan into a Mirrored Room In this experiment, the robot is in a mirrored room in relation to the plan (representative room) has been created for it, as shown in Fig. 10a. Before to get rid of the presumably incorrect plan, the robot uses the mirroring information and validates the plan. Only plans for rooms built by mirroring process are capable to have mirrored data. Having its location in the higher layer of the hierarchy, the robot moves to the breakout point as shown in Fig. 10b. As shown in Fig. 10c, the robot loads the plan of the current representative room. The robot finds its pose
452
Volume 6, Number 6, December 2014
International Journal of Computer and Electrical Engineering
in the lower level using the new plan, the gray probability area and its observation, and then it ends up the task, as the Fig. 10d shows.
Fig. 10. Experiment 2. V-REP scenery | Robot position on the map | Representative room (plan) has been used for each time.
7.3. Experiment 3–A Bad Opening Plan Now let's assume the initial plan is based on luck, not on heuristics, and the robot is not a lucky one. This experiment will force a sequence of bad plans. That would be the worst-case scenario on choosing plans. The robot is located in a room on the top left of the map, but we force it to use a plan generated by other cluster of rooms, as shown in Fig. 11a. In the higher level, a set of moves allows the robot to infer the observations and the probability distribution do not correspond to that plan. Then the robot loads a new plan (purposely other bad plan), as in Fig. 11b. Likewise, the actions and observations of the POMDP plan do not meet the actual observations. The robot already knows a lot of useful information based on its probability distribution that it becomes impractical to force again bad plans. Thus, if we try to do so, the disposal is promptly done. The Fig. 11c shows that the robot selects the correct plan corresponding to the current room finding its pose and getting the final task done, as the Fig. 11d shows.
453
Volume 6, Number 6, December 2014
International Journal of Computer and Electrical Engineering
Fig. 11. Experiment 3. V-REP scenery | Robot position on the map | Representative room (plan) has been used for each time.
8. Conclusion In this paper, we proposed a method to compact map information to be used on planning for mobile robots localization on large-scale environments. In this process, the original environment map is decomposed into rooms, and then similar rooms are grouped based on architectural design similarity creating a representative room for each group. Plans both tasking and localizationoriented are created just for the representative rooms and not for the whole environment, having the precision of a POMDP model for large-scale environments, but lighter. The experiments showed the proposed model is efficient for both localization and tasking process in an indoor environment even when a bad sequence of plans has set. We did not discuss how to optimize the selection of initial plans. Furthermore, we must consider use the probability distribution to infer which plan should be chosen as an opening plan. Also, we should check the impact on the localization planning, adding to the model not only walls and doors, but other design features, such as windows, floor textures, and using other structures besides doors to divide large rooms without intermediary doors.
Acknowledgment This work was supported by the CNPq/MCT/FINEP under Grant 385024/2013-4.
454
Volume 6, Number 6, December 2014
International Journal of Computer and Electrical Engineering
References [1] Thrun, S. (1998). Bayesian landmark learning for mobile robot localization. Machine Learning, 33(1), 41–76. [2] Thrun, S., Fox, D., Burgard, W., & Dellaert, F. (2001). Robust monte carlo localization for mobile robots. Artificial Intelligence, 128, 99–141. [3] Borenstein, J., Everett, H. R., & Feng, L. (1996). Navigating mobile robots: Systems and techniques. Natick, MA, USA: A. K. Peters, Ltd. [4] Castellanos, J., Neira, J., & Tardos, J. (2001). Multisensor fusion for simultaneous localization and map building. IEEE Transactions on Robotics and Automation, 17, 908–914. [5] Gutmann, J. S., & Fox, D. (2002). An experimental comparison of localization methods continued. Proceedings of IEEE/RSJ International Conference on Intelligent Robots and Systems, Vol. 1 (pp. 454–459). [6] Toda, Y., Kubota, N., & Baba, N. (2011). Intelligent planning based on multi-resolution map for simultaneous localization and mapping. Proceedings of IEEE Workshop on Robotic Intelligence in Informationally Structured Space (pp. 144–150). [7] Pradalier, C., & Sekhavat, S. (2002). Concurrent matching, localization and map building using invariant features. Proceedings of IEEE/RSJ International Conference Intelligent Robots and Systems, Vol. 1 (pp. 514–520). [8] Guo, Y., & Xu, X. (2006). Color landmark design for mobile robot localization. Proceedings of Computational Engineering in Systems Applications, IMACS Multiconference, Vol. 2 (pp. 1868–1874). [9] Sert, H., Kokosy, A., & Perruquetti, W. (2011). A single landmark based localization algorithm for non-holonomic mobile robots. Proceedings of IEEE International Conference on Robotics and Automation (pp. 293–298). [10] Fox, D., Burgard, W., & Thrun, S. (1998). Active Markov localization for mobile robots. Robotics and Autonomous Systems, 25, 195-207. [11] Asoh, H., Motomura, Y., Hara, I., Akaho, S., Hayamizu, S., and Matsui, T. (1996). Combining probabilistic map and dialog for robust life-long office navigation. Proceedings of the IEEE/RSJ International Conference on Intelligent Robots and Systems, Vol. 2 (pp. 807-812). [12] Zhouand, H., & Sakane, S. (2005). Sensor planning or mobile robot localization-a hierarchical approach using bayesian network and particle filter. Proceedings of IEEE/RSJ International Conference on Intelligent Robots and Systems (pp. 350–356). [13] Thrun, S., Burgard, W., & Fox, D. (2005). Probabilistic Robotics (Intelligent Robotics and Autonomous Agents). The MIT Press. [14] Unwin, S. (2000). An Architecture Notebook: Wall (1st ed.). Routledge. [15] Unwin, S. (2007). Doorway (1st ed.). Routledge, London. [16] Theocharous, G., Murphy, K., & Pack, L. (2004). Representing hierarchical POMDPS and DBNS for multi-scale robot localization. Proceedings of International Conference on Robotics and Automation, Vol. 1 (pp. 1045–1051). [17] Pinheiro, P., & Wainer, J. (2013). A mixed map representation approach for mobile robot localization planning. Proceedings of International Conference on Informatics in Control Automation and Robotics, Vol. 2 (pp. 401–408). [18] Pinheiro, P., & Wainer, J. (2010). Planning for multi-robot localization. Proceedings of Brazilian Symposium on Artificial Intelligence (pp. 183-192). [19] Rohmer, M. F. E., & Signgh, S. P. N. (2013). V-rep: a versatile and scalable robot simulation framework. Proceedings of the IEEE/RSJ Int. Conference on Intelligent Robots and Systems, (pp. 1321–1326).
455
Volume 6, Number 6, December 2014
International Journal of Computer and Electrical Engineering
Paulo Pinheiro is from Brazil. He received his PhD degree in 2013 in computer science from University of Campinas (BRA) / University of Minnesota (USA), in a sandwich doctorate program. At the University of Minnesota, Dr. Paulo had worked on detection and estimation theory for mobile robot localization. Most of his works were developed at the Multiple Autonomous Robotic Systems (MARS) Laboratory. In his current research at University of Campinas, he is developing mobile robot solutions for low-cost powered robotic wheelchair. Jacques Wainer is from Brazil. He is an associate professor in computer science at State University of Campinas, Brazil. He has finished his PhD degree in 1991 at the Computer Science Department, Pennsylvania State University. He has published several works on artificial intelligence and machine learning in the last decade and he has been working on planning for mobile robot localization.
Eleri Cardozo is from Brazil. He is a professor at the State University of Campinas. In 1987, he received his PhD degree in electrical and computer engineering at the Carnegie Mellon University. He has wide experience in robotics, computer networks, distributed systems and software engineering. Currently, Dr. Cardozo is developing research on assistive robotics and solutions for autonomous or semi-autonomous powered wheelchairs focusing on navigation problems to be used by patients with neurological disorders.
456
Volume 6, Number 6, December 2014