2015 IEEE/RSJ International Conference on Intelligent Robots and Systems (IROS) Congress Center Hamburg Sept 28 - Oct 2, 2015. Hamburg, Germany
Robust Real time Material Classification Algorithm Using Soft Three Axis Tactile Sensor: Evaluation of the Algorithm Damith Suresh Chathuranga1 , Zhongkui Wang1 , Yohan Noh2 , Thrishantha Nanayakkara2 and Shinichi Hirai1 Abstract— Materials and textures identification is a desired ability for robots. Developing such systems require tactile sensors that have enough sensitivity and spatial resolution, and the computational intelligence to meaningfully interpret sensor data. This paper introduces a texture classification algorithm utilizing support vector machine (SVM) classifier. Data taken from a novel three axis tactile sensor that utilize magnetic flux measurements for transduction was used to obtain the three dimensional tactile data. Frobenius norm calculated from the covariance matrix of the above data and the mean values of the three dimensional sensor data were used as features. Palpation velocity and small vertical load variances had minimum influence on the proposed algorithm. We have compared this algorithm with two other classification methods. They are: classify using the feature spatial period that is calculated from principal frequencies of the textures/material, and classify using neural network classifier with special properties of each material’s tactile signals as features. For eight classes of material, the proposed algorithm performed faster and more accurately than the comparators when the scanning velocity and the vertical load varied.
I. INTRODUCTION Biological tactile system is complex. It has hundreds of sensors under a square centimeter of the skin that detect different stimuli. These detect pressure, vibrations, pain, and temperature modalities [1]. Even though tactile sensors are distributed all over the body, humans mostly use their fingers to explore the environment and acquire tactile information. Data from these sensors taken at different internal impedence levels [2] fused with vision and audition information are used to comprehend the surrounding environment. Two main activities benefited from tactile sensing are: humans interpreting tactile signals and using prior experience to classify materials and textures only by touching the surfaces, and grasp objects by applying just enough grip force to hold objects without slipping. Both tasks are important for a robot if it were to operate autonomously in unstructured environments. In attempt to develop artificial systems with the same capabilities as the human hands and fingers, researchers have mimicked human anatomy. Researchers have concluded that in order to work accurately, the artificial tactile systems should have spatial resolution of about 1 mm and sensitivity to detect vibrations This research was supported in part by JSPS Grant-in-Aid for Scientific Research 15H02230. 1 D. S. Chathuranga, Z. Wang and S. Hirai are with the Department of Robotics, School of Engineering, Ritsumeikan University, Shiga, Japan. Email:
[email protected],
[email protected],
[email protected] 2 Y. Noh, and T. Nanayakkara is with Departmet of Informatics, King’s College London, UK. Email:
[email protected],
[email protected]
978-1-4799-9993-4/15/$31.00 ©2015 IEEE
of 500 Hz [3]. Few artificial tactile systems, in the form of tactile fingertips were introduced in the past for robot applications. These fingertips were used in texture classification and object manipulation tasks [4], [5], [6], [7]. These sensors were covered by a soft overlay and contained verity of sensing elements, including strain gauges, polyvinylidene fluoride (PVDF) films, micro electromechanical (MEMS) force sensors and accelerometers. Though these sensors lacked the above mentioned spatial resolution or sensitivity, these had the ability to detect forces and vibrations and were able to discriminate textures and materials using verity of techniques. Detailed surveys of tactile sensors used for robotic applications can be found in [3], [8], [9] and [10]. Concurrent to tactile sensor development, computational intelligence needed for material and texture recognition was also developed. Frequency analysis techniques such as fast Fourier transform (FFT) was used in many applications to differentiate textures. Tactile sensor signals were converted into frequency domain data to find the principal frequency of a material sample and then spatial frequency was calculated and textures were differentiated using these spatial frequencies [11]. Another system used a piezo-electric microphone as a sensing element, with sound waves segment by FFT and a supervised learning vector quantization technique to classify 18 materials [12]. Similarly, FFT was utilized to identify the first five major frequencies, which were subsequently used in a classification algorithm called majority voting [5]. Another study used a force sensor covered by an elastic layer and it slid over 10 material samples and the sensor data was used to calculate features (mean, variance, kurtosis, and spectral properties) for a neural network classifier [13]. Similarly, spectral properties were again used to discriminate among three materials by [6]. Although many researchers have converted temporal data to frequency data and analyzed the latter, the main limitations of these methods are its ability to identify only materials with periodic textures and the need of the palpation velocity to be constant and known. Apart from spectral properties, other features such as random Gaussian variables, with mean and variance were also used as classifier features [14]. A dynamic friction model was utilized to calculate surface properties such as static and kinetic frictional parameters, surface viscosity, and texture. These features were subsequently used in several supervised learning algorithms, such as Bayes classifiers, basis function networks and the k-NN method [15]. In almost all of these, force and speed had to be fixed and movements had to be pre-programmed. All except studies from Fishel [16] and Jamali [5] used a single exploration to gather the tactile
2093
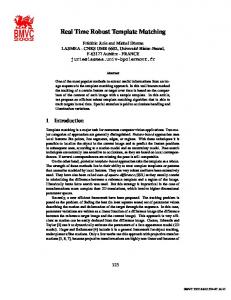
Fig. 2.
(a)
Experimental setup
h µ0 dS q→ − → 4π | h +− r0 |3 Z
Bz = µ0 Hz =
(b) Fig. 1. (a) Tactile sensor, (b) Coordinate system used for the calculation of the change in magnetic flux near RLS. The RLS sensors are perpendicular to each other, resulting in x, y, z orthogonal coordinates.Xb ,Yb , Zb are base coordinates and Xm ,Ym , Zm are magnet coordinates
data. Fishel [16] used multiple explorations and a hypothesistesting approach to eliminate improbable candidates that eventually increased the accuracy of classification. This paper proposes a new algorithm to classify textures, based on three dimensional tactile data obtained by a three axis soft tactile sensor. The covariation between the tactile data of the three dimensions was used as the features classifications algorithm. Support Vector Machine (SVM) was used as the classifier. This study describes experiments showing that this classification method is robust and applicable to any system that could detect tactile data in three dimensions. Additionally, it shows that this classification method is a simple but effective method by comparing with previously proposed classification algorithms by Muhammad [11], and Boissieu [13].
(1)
where Hz , µ0 and q are the z components of magnetic field intensity, permeability in free space, and magnetic charge − density, respectively[18]. The vector → r0 is the position of → − RLS relative to the base coordinates and h is the vector from magnet coordinates to base coordinates. The integration is performed over the surface S of the magnet. Tactile forces applied to sensor will cause the magnet to change its position (dx, dy, dz) from the base coordinates. The magnet surface is fixed at h0 = 3 mm, and the constant q is set at 1.15 wb/mm2 . The RLS outputs a voltage proportional to the change in magnetic flux, indicating that the voltage read out from the RLS is an indication of deformations due to external forces. These RLSs are connected to the computer via an AD converter to measure their voltages. B. Characteristics of the sensor The sensitivity of the sensor depends on the stiffness of the soft material. By changing the stiffness, the sensitivity is changed. The Young’s modulus of the soft material was 1.0 MPa. The maximum force that can be measured with an error less than 5% of the full scale value was 3.0 N. Using a vibration table the sensor was subjected to vibrations of up to 600 Hz. It was sensitive enough to sense vibrations up to and over 600 Hz. Calculations that used the principle of undamped natural frequency of a mass-spring system indicated that natural frequency of the sensor was approximately 970 Hz, which is above the sensor functioning region. C. Hardware setup
II. METHODOLOGY A. Soft tactile sensor The tactile sensor (Fig.1 (a)) used in these experiments was initially proposed in [17] was made from a cylindrical soft material (Smooth-on Dragon Skin 30) centered on a Niobium cylindrical magnet with a diameter of 2 mm. Outside this soft layer were three Honeywell SS495A ratiomatric linear sensors (RLS) perpendicular to each other. When an external force was applied to the soft silicon material, the material deformed, displacing the magnet inside and causing the magnetic flux to change near the RLS. The change in magnetic flux around a cylindrical magnet at point (x, y, z) ∈ (Xm ,Ym , Zm ) (Fig.1 (b)) can be expressed as:
The experimental setup is shown in Fig.2. The system consists of a soft tactile sensor rigidly fixed to the vertical linear stage of the XY table (Suruga Seiki KXL06100-C2F) via a Tech Gihan (USL 06-H5-50N-C) force sensor. The vertically moveable linear stage is fixed to a horizontal linear stage. Both stages allow the tactile sensor to move in the x and z directions. The linear stages are capable of moving up to a speed of 50 mm/s. The force sensor is capable of measuring the forces in three dimensions. The force sensor has an amplifier of its own and the processed signal is sent to a National Instruments NI9205 analog to digital converter. The linear stages, and the AD converters are connected to a computer and controlled through LabView software. The
2094
Fig. 3. Eight textures and materials were used in the classification experiment.
Data retrieval and the linear stage motion are synchronized by the software. The sampling rate of the AD converter was 1000 Hz. The experimental data were collected and later stage processed using MatLab software. The computer used included an Intel Core I5-2400 3.10 GHz system with 4 GB internal memory running Windows 7(64 bit).
are a function of the geometry of the sensor, the geometry of the material (texture), the stiffness of the sensor material and the static and dynamic frictional coefficients of the material and the silicon sensor surface. Initially, we assumed that these deformations in the x, y, and z directions of the sensor are related to each other. Figure. 4 shows the relationship between the x, y, and z directional tactile sensor data of the eight material samples. The relationship among the tactile signals in the three dimensions can be represented by the covariance matrix. The figure shows the Gaussian ellipsoids drawn to values of the average covariance matrix data of the eight materials. The average values were calculated from 10 data sets (10 trials) for each material classes. For a given vertical load and palpation velocity, the sensor data were separated in space, indicating that analyzing tactile sensor data in three perpendicular directions could assist in developing a feature to classify materials. During each palpation test, the tactile sensor produces three sets of voltages, corresponding to the x, y, and z directions. This sensor signal Vs can be represented by three column vectors, X, Y, Z:
D. Data collection For the classification experiments, eight textured objects were selected (Fig.3) to validate the system and to show that it could be used to classify common materials and textures. These objects included samples with visible textures, such as fabrics, Duct tape and leather; and objects with invisible (micro-sized) texture, such as aluminum, hard board, and rubber. These materials and textures were fixed to the base. The tactile sensor was moved on the material surface following the path shown in Fig. 2. The contact depth of the soft tactile sensor was controlled by the motion of the z directional linear stage, and the palpation velocity was controlled by the x directional linear stage. Initially the z linear stage was lowered until the necessary vertical force was applied. Then the sensor was moved using the x stage. After the stage moved the programmed stroke length, it was returned to its initial position via the same route. The total motion can be considered a single palpation motion of a finger. The data from the force and tactile sensors were collected. In these experiments, 120 sample data sets for each material class were recorded. From these samples, 100 randomly chosen data sets were used for training purposes and the remainder for testing and validation. Data were recorded from 30 locations on the material surface. The initial contact force was set at 0.1 N and the scanning velocity at 15 mm/s, for reasons stated in the following section. For the classifier calculations, only the data relevant to the forward palpitation AB portion (Fig.2) were used. III. CLASSIFICATION METHOD A. Classification Features If a tactile sensor was used to explore the surface of a material by palpation, the soft silicon element of the sensor would deform with the sensor motion. These deformations
Vs = [ X
Y
Z ]
Each of these vectors consists of voltage scalars xi , yi , and zi : x1 y1 z1 .. .. .. X = . , Y = . , Z = . xn
yn
zn
Then, the covariance matrix MCov is given by ∑ XX MCov = ∑ YX ∑ ZX
∑ XY ∑ YY ∑ ZY
∑ XZ ∑ YZ ∑ ZZ
(2)
where, for any column vector A, B with same size, we define: ¯ ¯ j − b), ∑ AB = ∑ (ai − a)(b
(3)
i, j
with a, ¯ b¯ being the means of the scalar values of vector A and B. The next step in feature generation was a simplification of the covariance matrix by calculating the Frobenius norm of the matrix. The Frobenius norm ||D|| of the covariance matrix MCov can be calculated as ||D||F =
q
Trace((MCov )T MCov )
(4)
The Frobenius Norm is one of the classification features. Apart from the Frobenius norm, incorporating the mean value Mmean of the sensor signals in three dimensions had increased classification accuracy.
2095
Mmean = [ x¯ y¯ z¯ ]
(5)
Fig. 4. Gaussian ellipsoids of the data obtained for the nine materials and textures. The centers of the ellipsoids are the mean tactile sensor values in the x, y and z directions and the length of the semi-principal axis is the covariance values of the signal S
Fig. 5. Effects on Frobenious distance when the palpation velocity and applied vertical force changes. Applied vertical load: (a) 0.1 N (b) 0.2 N (c) 0.3 N
B. Robustness of Features Most of the features used for material classification in previous studies were based on the spacio-temporal changes in the sensing element. Therefore these features used were heavily influenced by: 1) palpation velocity 2) contact depth or the applied vertical force, and 3) orientation of the x and y directions of the sensor relative to the direction of palpation (Fig.1(a)) Thus to understand the robustness of the proposed feature, the significans of the palpation velocity and the applied vertical force to the value of the proposed feature was evaluated. 1) Effect of scanning velocity: In this experiment, three textures, aluminium, Denim and plastic; were explored using the vertical loads of 0.1 N, 0.2 N and 0.3 N and velocities of 5, 10, 15, 20 and 25 mm/s. The force sensor data and accelerometer data were recorded for each scan. Ten trials were conducted and the mean Frobenius norm and standard deviation of the norms were calculated, using equation (4) with tactile sensor data. Figure 5 shows the results. For most trials, the Frobenius distance changed insignificantly for velocities of 10 mm/s , 15 mm/s, and 20 mm/s for a given material at all values of applied vertical force. Therefore, this classification feature could be used in a robot with varying exploration velocities, ranging from 10 to 20 mm/s. An n way analysis of Variances
(n-ANOVA) study proved that the velocity was insignificant to the Frobeniuos norm within the given velocities. This robustness will be helpful for robot system to distinguish materials and objects moving relative to a hand and causing discrepancies in palpation velocity. 2) Effects of vertically applied force: Figure 5 shows the change in Frobenious norm as the applied vertical force was changed from 0.1 N, 0.2 N to 0.3 N. The lowest Frobenius distance was at the smallest applied force (0.1 N). In almost all cases, the Frobenius norm increased as the applied load increased. However, an ANOVA analysis showed that for lower vertical loads such as 0.1 N and 0.2 N, the vertical loads were insignificant for variations in the Frobenious norm of each material. Therefore, to obtain greater accuracy with varying velocities, a smaller force such as 0.1 N or 0.2 N would be suitable for classification tasks. C. Classification Algorithm Support Vector Machine (SVM) has been reported to be a better binary classification method than regularized least squares (RLS) and regularized extreme learning machine (RELM), exchanging computational complexity with classification accuracy [19]. Therefore, we utilized SVM as the classifier, with a Gaussian Radial Basis Function kernel that has a scaling factor, σ of 1.0. As SVM is a binary classifier, we devised our material classification algorithm according to Algorithm 1. From the moment the tactile sensor started to collect tactile data
2096
relevant to the exploration stage (AB portion of Fig.2), it calculated the covariance matrix of the obtained signal and then the Frobenius distance of the matrix from the available sensor data. Next, the algorithm chose Frobenious distance and mean of two material data sets from the training sample space and classified the Frobenius distance and mean of the unknown material using SVM. This was continued for all 28 combinations of pairs that could be made from the eight materials. The SVM outputs were recorded, and the largest 50% of the materials that had been selected as the possible unknown material were kept as candidate materials. Next, the same classification step was performed with the next set of tactile sensor data, but instead of training the SVM with all eight types of material, the training set was selected from the candidate solution set. After the palpation, the 50% of the remaining materials with the highest count was selected. In the third or final iteration, the candidate material with the highest frequency was chosen. Algorithm 1 Proposed SVM based algorithm 1: C ← material class set 2: Ck ← material class set after k − th iteration Ck ⊂ C, For the first iteration k = 1, C1 = C 3: nk ← # of mat. classes in candidate set after k-th iteration 4: m ← # of permutations for selecting 2 materials from nk 5: for k = 1, 2, 3 do 6: for i = 1, 2, ...m do 7: Vs ← read tactile sensor data of unknown mat. 8: calculate MCov , ||D||F and MMean 9: Select c1 ← randomly select one class from Ck 10: Select c2 ← select another class from c2 6= c1 11: Retrieve MCov , ||D||F and MMean of c1 , c2 ← for training SVM 12: Train SVM 13: Classify Unknown material using SVM 14: Count total count of classification result 15: end for 16: if k < 3 then 17: Creat Ck+1 ← 50% candidate mat. with max. tot. cnt. 18: else 19: Select Class with max frequency as classification 20: end if 21: end for
D. Comparison of Existing and New Algorithms To evaluate the performance of the above algorithm, it was compared with two other material classification algorithms: 1) the spacial period method [11] and 2) the neural network based classification method [13]. 1) Spacial period based classifier: The tactile sensor signal from the direction of the motion x was converted to the frequency domain using the FFT, with the tallest peak of the frequency distribution selected as the principal frequency, f p , of the material or texture. By inputting f p and palpation
Fig. 6. Parentage of each class being correctly classified by the three algorithms.
velocity V into the following equation, the spatial period λ was calculated. This λ was considered unique to each material. λ=
V fp
(6)
The mean special period λ¯ and variance σλ2 were calculated for all the classes. For an unknown class, λ was calculated and the material or texture closest to the properties (λ¯ , σλ2 of each class) was considered the candidate material or texture. This algorithm (Fig.6) was 36% accurate in classifying materials. The average calculation time per classification was about 8 µs. 2) Neural network based classifier: To use the neural network, the following features were calculated from the tactile data signal Vs . 1. Friction coefficient µU q xi2 + y2i (7) µU = zi 2. X signal variance σX2 3. X signal directional kurtosis. These features were input into a two-layer feedforward neural network (having sigmoid hidden neurons and linear output neuron) and the neural network was trained with 900 samples. The algorithm was 81% accurate in classifying textures and materials (Fig.6). The average training and calculation time per test was about 0.88 s. IV. DISCUSSION The proposed three axis soft tactile sensor has the ability to detect forces as well as vibration modalities. The sensor has a non-linear response to applied forces due to its inversely proportional relationship with the distance between the magnet and RLS (equation 1). This had no effect in the proposed algorithm as only the variation of the sensor data between the three axes, x, y, and z was considered for feature generation. Therefore this algorithm can be utilized in any
2097
TABLE I B ENCHMARK VALUES OF THE THREE CLASSIFICATION ALGORITHMS Benchmark criterion Accuracy Number of features used Time per classification Effect of palpation velocity Effect of contact force
Proposed classifier 89% 2 280 µs minimum minimum
Spatial period based classifier 36% 1 8 µs high high
type of tactile sensing system that produces tactile data in three perpendicular axes. The Frobenious norm of the covariance matrix and the mean values of the tactile data obtained from the three axes provide sufficient information to classify materials and textures. The eight material samples included those with textures that could be detected by a human observer and others without any textures detectable by humans. Nevertheless, the proposed system had the ability to detect subtle changes in the tactile sensor data due to differences in frictional coefficients. Thus, this proposed system has the capability to distinguish textures as well as different materials, further strengthening the robustness of the classification features. The experiments performed to validate the classification features showed that the classification feature is nonresponsive to changes in palpation velocity. Similarly, lower applied forces had no effect to the classification features resulting in a robust classification feature useful for robotic applications. The proposed classification algorithm was executed within 280 µs, making its application to a real time classification system possible. Calculations of Forbenious distance and mean, binary SVM did not consume resources, with an SVM execution time being 8 µs. Additionally the limited number of material classes contributed to the fast computation. Future research should include improvements in the algorithm and the effect on the algorithm of increasing the number of classes of material. The algorithms selected for comparison had fast computational ability, with each using a single palpation for computations. The results obtained from these comparative experiments are summarized in table I. Each algorithm classified materials with different accuracies. Figure 6 shows that materials with spatial frequencies such as Denim, Duct tape and Nylon were classified correctly by the spatial period based algorithm while materials with invisible textures such as Aluminium, Plastic and rubber were misclassified. The other two methods had no visible relationship with type of materials texture and classification accuracy. These observations indicate that the proposed new classification feature is a robust system, providing a simple yet powerful classification algorithm useful for robotic tactile systems. R EFERENCES [1] R. S. Johansson and J. R. Flanagan, “Coding and use of tactile signals from the fingertips in object manipulation tasks”, Nature Reviews Neuroscience, vol.10, no.5, pp. 345-359, 2009.
Neural network based classifier 81% 3 880 µs high high
[2] N. Sornkarn, T. Nanayakkara, M. Howard, “Internal Impedance Control Helps Information Gain in Embodied Perception?, IEEE International Conference on Robotics and Automation, pp. 6685-6690, 2014. [3] R. S. Dahiya, G. Metta, M. Valle and G. Sandini, “Tactile sensingfrom humans to humanoids”, IEEE Transactions on Robotics, vol.26, no.1, pp. 1-20, 2010. [4] N. Wettles, V. J. Santos, R. S. Johansson, G. E. Leob, “Biomimetic Tactile Sensor Array”, Advance Robotics, vol.22, pp. 829-849, 2008. [5] N. Jamali and C. Sammut, “Majority voting: material classification by tactile sensing using surface texture”, IEEE Transactions on Robotics, vol.27, no.3, pp. 508-521, 2011. [6] C. M. Oddo, M. Controzzi, L. Beccai, C. Cipriani and M. C. Carrozza, “Roughness encoding for discrimination of surfaces in artificial activetouch”, IEEE Transactions on Robotics, vol.27, no.3, pp. 522-533, 2011. [7] D. S. Chathuranga, V. A. Ho and S. Hirai, “Investigation of a biomimetic fingertip’s ability to discriminate fabrics based on surface textures”, IEEE/ASME International Conference on Advance Intelligent Mechatronics, pp. 1667-1674 , 2013. [8] H. Yousef, M. Boukallel, and K. Althoefer, “Tactile sensing for dexterous in-hand manipulation in robotics - A review”, Sensors and Actuators A:Physical, vol.162, no.2, pp. 171-187, 2011. [9] R. S. Dahiya, P. Mittendorfer, M. Valle, G. Cheng, V. J. Lumelsky, “Directions Toward Effective Utilization of Tactile Skin: A Review”, IEEE Sensors Journal, vol.13, no.11, pp. 4121-4138, 2013. [10] S. Stassi, V. Cauda, G. Canavese, and C. F. Pirri, “Flexible Tactile Sensing Based on Piezoresistive Composites: A Review”, Sensors, vol.14, no.3, pp. 5296-5332, 2014. [11] H. B. Muhammad, C. Recchiuto, C. M. Oddo, L. Beccai, C. J. Anthony, M. J. Adams, M. C. Carrozza, and M. C. L. Ward, “A Capacitive tactile sensor array for surface texture discrimination”, Microelectronic Engineering, vol.88, no.8, pp. 1811-1813, 2011. [12] W. W. M. Cuevas, J. Guerrero and S. M. Gutierrez, “A first approach to tactile texture recognition”,IEEE Int. Conf. on Syst. Man and Cybernetics, vol.5, pp. 4246-4250, 1998. [13] F. Boissieu. C. Godin, B. Guilhamat, D. David, C. Serviere and D. Baudois, “Tactile texture recognition with a 3-axial force MEMS integrated artificial finger”, Proc. Robot. Syst. Science, pp. 49-56, 2009. [14] S. H. Kim, J. Engel, C. Liu and D. L. Jones, “Texture classification using a polymer-based MEMS tactile sensor”, Journal of Micromech. Microeng., vol.15, No.5, pp. 912-920, 2005. [15] H. Liu, X. Song, J. Bimbo, L. Seneviratne, and K. Althoefer, “Surface material recognition through haptic exploration using an intelligent contact sensing finger”, IEEE/RSJ International Conference on Intelligent Robots and Systems, pp. 52-57, 2012. [16] J. A. Fishel and G. E. Loeb, “Bayesian exploration for intelligent identification of textures”, Frontiers in Neurorobotics, vol.4, pp. 1-20, 2012. [17] D. S. Chathuranga, Z. Wang, Y. Noh, T. Nanayakkara and S. Hirai, “Disposable Soft 3 Axis Force Sensor for Biomedical Applications”, The 37th Annual International Conference of the IEEE Engineering in Medicine and Biology Society (EMBS), 2015. [18] S. Takenawa, “A soft three-axis tactile sensor based on electromagnetic induction”, IEEE International Conference on Mechatronics, pp. 1-6 , 2009. [19] S. Decherchi, P. Gastaldo, R.S. Dahiya, M. Valle, R. Zunino, “TactileData Classification of Contact Materials Using Computational Intelligence”, IEEE Transactions on Robotics, vol.27, no.3, pp. 635-639, 2011.
2098