carbon, mercury, and sulfur-34 ; and ionic charge balances from analyses of the ...... 13.5. 28. Gypsum Creek, W yo. 10.6. 6.12. 0.8. 16.5. 3.7. 6.4. 0.8. 7.3. 2.0. 8.2. 6.7. 0.6. 2.1. -. 12.7 ...... http://nadp.sws.uiuc.edu/ads/2003/CO97.pdf (accessed.
Rocky Mountain Snowpack Chemistry at Selected Sites, 2003
By George P. Ingersoll, M. Alisa Mast, Leora Nanus, David J. Manthorne, Heather H. Handran, Douglas M. Hulstrand, and Jesse Winterringer
In Cooperation with the National Park Service and the U.S. Department of Agriculture Forest Service
Open-File Report 2005–1332
U.S. Department of the Interior U.S. Geological Survey
Form Approved OMB No. 0704-0188
Report Documentation Page
Public reporting burden for the collection of information is estimated to average 1 hour per response, including the time for reviewing instructions, searching existing data sources, gathering and maintaining the data needed, and completing and reviewing the collection of information. Send comments regarding this burden estimate or any other aspect of this collection of information, including suggestions for reducing this burden, to Washington Headquarters Services, Directorate for Information Operations and Reports, 1215 Jefferson Davis Highway, Suite 1204, Arlington VA 22202-4302. Respondents should be aware that notwithstanding any other provision of law, no person shall be subject to a penalty for failing to comply with a collection of information if it does not display a currently valid OMB control number.
1. REPORT DATE
2. REPORT TYPE
2005
N/A
3. DATES COVERED
-
4. TITLE AND SUBTITLE
5a. CONTRACT NUMBER
Rocky Mountain Snowpack Chemistry at Selected Sites, 2003
5b. GRANT NUMBER 5c. PROGRAM ELEMENT NUMBER
6. AUTHOR(S)
5d. PROJECT NUMBER 5e. TASK NUMBER 5f. WORK UNIT NUMBER
7. PERFORMING ORGANIZATION NAME(S) AND ADDRESS(ES)
U.S. Department of the Interior 1849 C Street NW Washington, DC 20240 9. SPONSORING/MONITORING AGENCY NAME(S) AND ADDRESS(ES)
8. PERFORMING ORGANIZATION REPORT NUMBER
10. SPONSOR/MONITOR’S ACRONYM(S) 11. SPONSOR/MONITOR’S REPORT NUMBER(S)
12. DISTRIBUTION/AVAILABILITY STATEMENT
Approved for public release, distribution unlimited 13. SUPPLEMENTARY NOTES
The original document contains color images. 14. ABSTRACT 15. SUBJECT TERMS 16. SECURITY CLASSIFICATION OF: a. REPORT
b. ABSTRACT
c. THIS PAGE
unclassified
unclassified
unclassified
17. LIMITATION OF ABSTRACT
18. NUMBER OF PAGES
SAR
21
19a. NAME OF RESPONSIBLE PERSON
Standard Form 298 (Rev. 8-98) Prescribed by ANSI Std Z39-18
U.S. Department of the Interior Gale A. Norton, Secretary U.S. Geological Survey P. Patrick Leahy, Acting Director
U.S. Geological Survey, Reston, Virginia: 2005
For sale by U.S. Geological Survey, Information Services Box 25286, Denver Federal Center Denver, CO 80225 For more information about the USGS and its products: Telephone: 1-888-ASK-USGS World Wide Web: http://www.usgs.gov/
Any use of trade, product, or firm names in this publication is for descriptive purposes only and does not imply endorsement by the U.S. Government.
Although this report is in the public domain, it contains copyrighted materials that are noted in the text. Permission to reproduce those items must be secured from the individual copyright owners.
iii
Contents Abstract............................................................................................................................................................1 Introduction ....................................................................................................................................................1 Purpose and Scope ..............................................................................................................................2 Study Area .............................................................................................................................................2 Acknowledgments.................................................................................................................................2 Study Methods.......................................................................................................................................2 Data Collection.......................................................................................................................................2 Analytical Methods...............................................................................................................................2 Quality Assurance.................................................................................................................................2 Snowpack Chemistry ....................................................................................................................................3 Water Content........................................................................................................................................3 Chemistry................................................................................................................................................3 Summary and Conclusions . .......................................................................................................................16 References Cited..........................................................................................................................................16
Figures 2–6.
1. Photograph showing snowpit being prepared for sampling.....................................................3 Maps showing: 2. Relative ammonium ion concentrations in snowpacks, 2003..................................................11 3. Relative nitrate ion concentrations in snowpacks, 2003..........................................................12 4. Relative sulfate ion concentrations in snowpacks, 2003.........................................................13 5. Relative total mercury concentrations in snowpacks, 2003....................................................14 6. Relative stable sulfur isotope ratios in snowpacks, 2003.........................................................15
Tables
1. Quality-assurance replicate sample results for ammonium, sulfate, nitrate, mercury, and sulfur-34..................................................................................................................4 2. Quality-assurance laboratory- and field-blank results for ammonium, sulfate, nitrate and mercury....................................................................................................................................5 3. Alkalinity and laboratory pH; concentrations of major ions, dissolved organic carbon, mercury, and sulfur-34 ; and ionic charge balances from analyses of the 2003 snowpack samples from Colorado, Idaho, Montana, New Mexico, and Wyoming..................................................................................................................................6
iv
Conversion Factors SI to Inch/Pound Multiply
centimeter (cm) millimeter (mm) meter (m) kilometer (km) meter (m) square meter (m ) hectare (ha) square meter (m2) hectare (ha) square kilometer (km2) 2
cubic meter (m3) liter (L) cubic meter (m3)
By
To obtain
Length 0.3937
inch (in.) inch (in.) foot (ft) mile (mi) yard (yd)
0.03937 3.281 0.6214 1.094 Area 0.0002471
acre acre square foot (ft2) square mile (mi2) square mile (mi2)
2.471 10.76 0.003861 0.3861 Volume 6.290
barrel (petroleum, 1 barrel = 42 gal) ounce, fluid (fl. oz) cubic foot (ft3)
33.82 35.31
To convert microequivalents per liter (µeq/L) to milligrams per liter for major ions, divide microequivalents by factors indicated for each ion: To obtain milligrams per liter
For
Divide by
hydrogen (H )
1000
+
calcium (Ca )
49.90
2+
magnesium (Mg )
82.26
potassium (K )
25.57
2+
+
sodium (Na )
43.50
+
ammonium (NH )
55.44
–2
sulfate (SO4 )
20.83
nitrate (NO )
16.13
chloride (Cl )
28.21
+ 4
– 3 –
Temperature in degrees Celsius (°C) may be converted to degrees Fahrenheit (°F) as follows: °F=(1.8×°C)+32 Vertical coordinate system is referenced to the North American Vertical Datum of 1988 (NAVD88). Horizontal coordinate information is referenced to the North American Datum of 1983 (NAD83).
Rocky Mountain Snowpack Chemistry at Selected Sites, 2003 By George P. Ingersoll, M. Alisa Mast, Leora Nanus, David J. Manthorne, Heather H. Handran, Douglas M. Hulstrand, and Jesse Winterringer
Abstract Chemical composition of the Rocky Mountain snowpack during water year 2003 was determined from samples collected at 74 sites extending from New Mexico to Montana. Snow samples were collected near the end of the 2003 snowfall season from a snowpack that was below average in every sampled basin but one, based on March 1 snow-water equivalent data. Significant snowfall during March increased snow-water equivalent values to near-average or greater in some basins, but for most of the basins below-average snowwater equivalent values on April 1 indicated that the regionwide drought continued. Regional patterns in the concentrations of major ions including ammonium, nitrate, sulfate, mercury, and the stable sulfur-34 isotope (δ34S) differed from the previous year, 2002, which was affected by more severe drought conditions. At sites reported during both water years 2002–03, snowpack ammonium concentrations for 2003 were higher than concentrations in 2002 at most sites in the region. Nitrate concentrations were lower in 2003 than in 2002 at nearly all network sites, particularly at sites in Colorado and New Mexico. Sulfate increased across the region at about one-half of the sites reported for both years, whereas mercury concentrations decreased at slightly more than one-half of the sites in 2003. Ratios of d34S exhibited a similar regional pattern as observed in 2002 with ratios generally increasing northward from New Mexico and southern Colorado to northern Colorado, Wyoming, Idaho, and Montana.
Introduction Snowfall that accumulates in seasonal snowpacks provides about 50 to 70 percent of the annual precipitation in headwater basins of the Rocky Mountains (Western Regional Climate Center, 2004). As these snowpacks accumulate during the winter and spring, chemicals deposited from the atmosphere are stored until snowmelt begins in spring. Because snowmelt supplies most of the runoff in mountain
lakes, streams, and wetlands, monitoring the water quality of snow is important for quantifying atmospheric deposition to these systems. In the Rocky Mountain region, population growth, water use, and energy development are increasingly affecting the quantity and quality of water resources at higher elevations. Alpine and subalpine environments in the region are sensitive to changes in chemical composition of the water because thin soils and dilute water bodies in these mountain ecosystems typically have limited capacity to buffer acidity that may be deposited with airborne contaminants such as nitrogen and sulfur. Atmospheric input of mercury to these sensitive areas may affect aquatic and wildlife populations. Human health also may be at risk because mercury has been associated with fishconsumption advisories for surface-water bodies in the study area (U.S. Environmental Protection Agency, 2001; 2004a). Although several watershed-scale studies have investigated atmospheric deposition in small headwater basins in the Rocky Mountains (Turk and Campbell, 1987; Caine and Thurman, 1990; Baron, 1992; Reuss and others, 1993; Campbell and others, 1995; Williams and others, 1996; and Burns, 2002), regional-scale atmospheric deposition data are sparse (Nanus and others, 2003). The National Atmospheric Deposition Program (NADP) provides nationwide estimates of atmospheric deposition (Nilles, 2000; National Atmospheric Deposition Program, 2004). Coverage for high-elevation areas [greater than 2,400 m] in the Rocky Mountains, however, is limited. Although 12 NADP sites monitor atmospheric deposition above 2,400 m in Colorado, few sites are operated in high-elevation areas of Idaho, Montana, Wyoming, and New Mexico, where snowpacks also persist with negligible melt through the snowfall season. These high-elevation snowpacks are important because they may accumulate 2 to 3 times the annual precipitation measured at lower elevations where regular monitoring is more easily accomplished and more common.
� Rocky Mountain Snowpack Chemistry at Selected Sites, 2003
Purpose and Scope
Study Methods
To gain a better understanding of atmospheric deposition at high elevation in the Rocky Mountains, the U.S. Geological Survey (USGS), in cooperation with the National Park Service, U.S. Department of Agriculture (USDA) Forest Service, and other organizations established a network of a minimum of 50 snow-sampling sites in the Rocky Mountain region. Sites in the network have been sampled annually since 1993. This report presents the snowpack chemistry for the network for 2003, and for comparison to previous years (Ingersoll and others, 2003, 2004; Mast and others, 2001; Turk and others, 2001).
The USGS has developed methods for measuring physical and chemical properties of seasonal snowpacks. Detailed descriptions of sample-collection and analytical methods are reported in previous publications (Ingersoll and others, 2002; Mast and others, 2001; Turk and others, 2001).
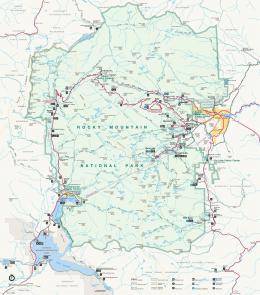
Study Area Snow-sampling sites in Montana, Idaho, Wyoming, Colorado, and New Mexico generally are located near the Continental Divide in national forests or national parks. Sampling sites were chosen at locations with limited human activity or emissions from local (residential, commercial, or industrial) activities to enable detection of regional emissions that may affect atmospheric deposition hundreds of kilometers downwind. Sites were located at least 30 m from plowed roadways to minimize contamination from vehicular traffic. As latitude increases along the Continental Divide, the elevation at which seasonal snowpacks develop generally decreases. Colorado and New Mexico sites range in elevation from about 2,700 to 3,400 m; sites in Idaho, Wyoming, and Montana typically are lower at about 1,800 to 2,700 m. At these elevations, snowpacks accumulate throughout the winter, and substantial snowmelt does not occur until spring runoff begins in March, April, or May. As evidenced by SNOTEL data, snowpit observations, and summertime visits, the seasonal snowpacks melt entirely each summer at sites in the network so resampling snowfall from previous years is avoided.
Acknowledgments The authors are grateful for the cooperation from numerous individuals from many organizations including National Park Service and the U.S. Department of Agriculture Forest Service. The authors also thank the many individuals for their assistance with logistical support, field work, and analytical processing, including Stan Bones, Cindy Bosco, Jay Dorr, Dan Fagre, Ben Glass, Bob Hammer, Mary Hektner, Karen Holzer, Nan Ingersoll, Cyndi Kester, Craig McClure, Lisa McKeon, Rick Neam, Gary Nelson, Ted Porwoll, Blaze Reardon, Don Rosenberry, Orville Rosenberry, John Sacklin, Mark Story, and Terry Svalberg. Special thanks also is given to the following ski areas for their generous logistical support: The Big Mountain, Big Sky, Loveland, Showdown, Snow Bowl, Taos Ski Valley, and Teton Village.
Data Collection Snowpack samples were collected at 74 sites in 2003 including 50 long-term sampling sites in the network that have been sampled annually since 1993. An additional 24 sites were added after 1993 to expand the geographical coverage of the network in Colorado, Idaho, and Montana. Where feasible, snow-sampling sites were collocated with snowpack-telemetry (SNOTEL) instrument sites where measurements of snowwater equivalence were recorded daily by the USDA, Natural Resources Conservation Service (Natural Resources Conservation Service, 2004). Sampling occurred from late February to early April prior to maximum annual snow depth. Samples were collected from snowpits (fig. 1) in small clearings in forests where uniform snow cover appeared to be free of human disturbance, excessive tree litter, or animal activity. A single depth-integrated, composite snow sample was collected from each snowpit.
Analytical Methods Concentrations of major ions and trace constituents were determined from snow melted in 8-L Teflon bags in USGS laboratories in Boulder and Lakewood, Colorado. Method detection limits were 1.0 µeq/L for alkalinity, 0.2 to 1.7 µeq/L for major ions (ammonium, 0.5; calcium, 1.7; magnesium, 0.7; sodium, 0.9; potassium, 0.8; , 0.5; chloride, 0.5; sulfate, 0.3; nitrate, 0.2), 0.15 milligrams per liter (mg/L) for dissolved organic carbon, and 0.4 ng/L for mercury. Analytical laboratory methods and quality-assurance procedures for analyses of major-ion and mercury concentrations, and stable sulfur isotope ratios are described in Ingersoll and others (2002), Mast and others (2001), and Turk and others (2001). Further information including interlaboratory comparisons of USGS standard reference samples can be found at http://bqs.usgs.gov/srs#contacts.
Quality Assurance Quality-assurance samples included laboratory blanks, field blanks, and field replicates composed about 20 percent of sample processing depending upon constituent. Four laboratory blanks were analyzed to test sample-processing equipment and deionized water (DI) for contamination. Eight field blanks were collected at snow-sampling sites by rinsing sampling tools with DI water into Teflon bags after collecting
Snowpack Chemistry � tions (National Atmospheric Deposition Program, 2001). For example, at the Buffalo Pass snow-sampling site, located near the NADP site CO97, cation-anion ratios in snowmelt were similar to those in wetfall collected during winter and spring at the NADP site (National Atmospheric Deposition Program, 2005). Cation-anion ratios from 10 other NADP sites around the region located near snow-sampling sites also were similar to those of snowmelt. One explanation for the excess cations in the ionic balances (table 3) is that organic acids were not included in the calculation for snowpack- or NADP-wetfall chemistry. Organic acids such as acetate and formate have been detected in snow in the region in earlier work, with mean concentrations of 1.2 µeq/L and 0.6 µeq/L (Turk and others, 2001).
Snowpack Chemistry Water Content
Figure 1. Snowpit being prepared for sampling.
snow samples. Major-constituent concentrations in laboratory and field blanks were less than or equal to 1 µeq/L except for calcium at Grand Mesa, Colorado, which was 1.5 µeq/L. Total mercury concentrations in blanks ranged from 0.0), chloride, nitrate, and sulfate) by the total cations and anions in solution. Ion balances calculated for the 2003 snow chemistry all were positive with a mean of +21.3 percent, indicating an excess of measured cations over anions in solution. This effect is inversely proportional to total cation plus anion concentrations in solution in these very dilute waters and is strongly influenced by small changes in concentrations near detection limits. Ionic balances calculated for precipitation chemistry of comparable ionic strength in a separate network operated by the NADP yielded similar devia-
When snow samples were collected during February, March, and April, snowpack water contents, referred to as “snow-water equivalent (SWE),” were below 30-year averages for 1971–2000 throughout most of the Rocky Mountain region (as measured at SNOTEL sites representative of basins where snow-sampling sites were located). Snow depth at sampling sites ranged from 67 to 375 cm; SWE ranged from about 19.5 to 128.8 cm. The majority of measured SWE values ranged from 20 to 80 cm. Snow depths at most sites in 2003 were greater than snow depths in 2002; however, the 2002 snowfall year was affected by more severe drought conditions. On March 1, 2003, the SWE at SNOTEL sites was below average in every basin sampled in the region except one. By April 1, 2003, SWE increased to the 30-year average or greater in few basins, but the drought persisted at many sampling sites. Compared to 30-year averages, SWE accumulations on April 1, 2003, were 80–111 percent in Montana, 88–98 percent in Idaho, 88–105 percent in Wyoming, 74–110 percent in Colorado, and 89–118 percent in New Mexico (National Resources Conservation Service, 2004).
Chemistry Chemical data for 2003 (alkalinities, laboratory pH, concentrations of major ions, dissolved organic carbon, total mercury, stable sulfur isotope ratios, and ionic charge balances) are presented in table 3. Snow-sampling sites shown alphabetically by State in table 3 also are referenced by their site numbers in figures 2–6. Site numbers appear in parentheses directly after the first mention of site names in the following text. Snowpack ammonium concentrations for 2003 were higher than concentrations in 2002 at most sites in the
� Rocky Mountain Snowpack Chemistry at Selected Sites, 2003 Table 1. Quality-assurance replicate sample results for ammonium, sulfate, nitrate, in microequivalents per liter; mercury, in nanograms per liter; and sulfur-34 (del-34S). Ammonium Sampling site
Sample
Replicate
Sulfate
Difference
1
Percent difference2
Sample
Replicate
Difference1
Percent difference2
Apgar Lookout
6.9
7.7
0.8
10.8
4.4
4.4
0.0
0.0
Cameron Pass
4.2
4.5
0.3
8.1
6.0
4.9
-1.1
-18.5
Granite Pass
2.3
1.8
-0.5
-21.7
1.6
1.6
0.0
0.0
Green Ridge Snowpit
4.1
3.5
-0.6
-14.4
4.0
4.6
0.6
16.2
Gypsum Creek
7.2
7.3
0.1
1.5
10.0
6.5
-3.5
-35.3
Hopewell
5.4
5.8
0.4
6.3
7.3
7.2
-0.1
-1.5
Lake Irene Forest
4.6
4.3
-0.3
-5.5
6.9
6.1
-0.8
-11.0
Lake Irene Meadow
4.9
4.0
-0.9
-17.1
5.5
4.7
-0.8
-15.5
Rabbit Ears 1 vs 2
8.2
6.4
-1.8
-22.4
8.6
8.1
-0.5
-5.6
Red Mountain Pass
2.5
2.3
-0.2
-8.7
3.2
4.5
1.3
41.1
Snow Bowl
2.7
2.7
0.0
0.0
2.4
2.7
0.3
9.5
Nitrate Sampling site
Sample
Replicate
Mercury
Difference
1
Percent difference2
Sample
Replicate
Difference1
Percent difference2
Apgar Lookout
6.9
7.1
0.2
2.2
1.3
1.4
0.1
7.7
Cameron Pass
8.9
8.6
-0.3
-3.0
2.2
1.5
-0.7
-31.8
2.4
2.1
-0.3
-10.5
3.3
6.8
3.5
106.1
10.7
12.6
1.9
17.6
1.6
1.6
0.0
0.0
6.7
6.6
-0.1
-1.2
2.2
2.0
-0.2
-9.1
Hopewell
12.1
11.8
-0.3
-2.5
2.6
2.3
-0.3
-11.5
Lake Irene Forest
10.2
9.6
-0.6
-5.3
4.1
5.0
0.9
22.0
9.8
8.7
-1.1
-11.8
1.7
1.0
-0.7
-41.2
Rabbit Ears 1 vs 2
12.3
12.0
-0.3
-2.4
2.8
1.7
-1.1
-39.3
Red Mountain Pass
6.0
8.6
2.6
43.0
0.7
6.4
5.7
814.3
Snow Bowl
3.3
3.5
0.2
7.4
2.4
3.6
1.2
50.0
Granite Pass Green Ridge Snowpit Gypsum Creek
Lake Irene Meadow
Sulfur-34 Sampling site
Sample
Replicate
Apgar Lookout
no data
no data
Cameron Pass
no data
no data
Granite Pass
no data
no data
Green Ridge Snowpit
no data
no data
Gypsum Creek
no data
no data
Hopewell
no data
no data
Lake Irene Forest
no data
no data
Lake Irene Meadow
no data
no data
Rabbit Ears 1 vs 2
7.4
7.3
Red Mountain Pass
no data
no data
Snow Bowl
no data
no data
Difference = replicate – sample. Percent difference = [(replicate – sample)/sample] × 100.
1 2
Snowpack Chemistry � Table 2. Quality-assurance laboratory- and field-blank results for ammonium, sulfate, nitrate, in microequivalents per liter and mercury, in nanograms per liter. Site name
Sample type
Ammonium
Sulfate
Nitrate
Mercury
0.7
0.0
0.0