Appl Microbiol Biotechnol (2002) 58:330–337 DOI 10.1007/s00253-001-0904-5
O R I G I N A L PA P E R
T. Schweder · H.Y. Lin · B. Jürgen · A. Breitenstein S. Riemschneider · V. Khalameyzer · A. Gupta K. Büttner · P. Neubauer
Role of the general stress response during strong overexpression of a heterologous gene in Escherichia coli Received: 16 August 2001 / Revised: 7 November 2001 / Accepted: 11 November 2001 / Published online: 8 January 2002 © Springer-Verlag 2002
Abstract The strong overexpression of heterologous genes in Escherichia coli often leads to inhibition of cell growth, ribosome destruction, loss of culturability, and induction of stress responses, such as a heat shock-like response. Here we demonstrate that the general stress response, which is connected to the stress response regulator σS (σ38, rpoS gene product), is suppressed during strong overproduction of a heterologous α-glucosidase. The mRNA levels of the rpoS and osmY stress genes drastically decrease after induction of the strong overexpression system. It is shown that an rpoS mutation causes a significant loss of cell viability after induction of the expression system. Furthermore, it is demonstrated that an E. coli clpP mutant, which could be suggested to improve heterologous protein production, is not a good production host if a tac-promoter is used to control the expression of the recombinant gene. Data from this study suggest that the overexpression of the α-glucosidase was greatly decreased by sigma factor competition in the clpP mutant, due to the increased σS level in this mutant background.
Introduction Recombinant processes are mostly based on the use of strong expression systems that are regulated at the level of transcription. Strong inducible promoters are used, such as T. Schweder · B. Jürgen · K. Büttner Institute of Microbiology, Ernst-Moritz-Arndt-University, 17487 Greifswald, Germany H.Y. Lin · A. Breitenstein · S. Riemschneider V. Khalameyzer · A. Gupta · P. Neubauer (✉) Institute of Biotechnology, Martin-Luther-University Halle-Wittenberg, 06099 Halle, Germany e-mail:
[email protected] Tel.: +358-8-5532384, Fax: +358-8-5532304 A. Breitenstein · P. Neubauer Department of Process and Environmental Engineering, University of Oulu, P.O. Box 4300, 900 14 Oulu, Finland
PlacUV5 and its derivatives, λPL, λPR, and the promoter of the T7 RNA polymerase (Neubauer and Winter 2001). Commonly such systems only produce the recombinant product transiently during a short time interval after induction. Although this is sufficient in some cases to obtain a large amount of the product, mistranslation, aborted translation, aggregation, and product degradation are consequences, which often exacerbate the down-stream process. It has been demonstrated that the strong competitive effect of product synthesis on the synthesis of the housekeeping host proteins leads to malfunction of the protein synthetic machinery, to a change in the central carbon metabolism (Dong et al. 1995; George et al. 1992), to DNA relaxation, and cell death (Lin et al. 2001a). It has been shown that during overproduction of recombinant proteins the concentration of ribosomal components is reduced (e.g., the ribosomal proteins S1, S6, S8, L7, L9, L12, and L16-S rRNA) (Dong et al. 1995; Jürgen et al. 2000; Rinas 1996; Vind et al. 1993). Other vegetative proteins such as Tig, TufA/B, and Tsf were also decreased. Furthermore, it has been known for many years that overexpression of a recombinant gene can induce a heat shock-like response (Bahl et al. 1987; Dong et al. 1995; Ito et al. 1986; Parsell and Sauer 1989) that enhances proteolytic activities (Goff and Goldberg 1985; Kosinski and Bailey 1991, 1992; Kosinski et al. 1992) and levels of the DnaK, GrpE, and GroEL chaperones (Dong et al. 1995; Gill et al. 2000, 2001; Jürgen et al. 2000; Rinas 1996; Snow and Hipkiss 1987). In contrast to the heat shock-like response, there are few data on the effect of the overproduction of recombinant proteins on other stress responses and vice versa. Usually, bioprocesses for the production of recombinant proteins are based on nutrient-limited fed-batch fermentation strategies. It has been demonstrated that in fedbatch fermentations without the production of a recombinant product the general stress response connected to the alternative sigma factor σS and the stringent response are induced (Andersson et al. 1996; Teich et al. 1998, 1999). We demonstrate that the general stress response of Escherichia coli is not induced but suppressed by strong
331
overproduction of a recombinant model protein. Moreover, our data suggest that the failure to respond properly with the general stress response causes a dramatic loss of viability of the recombinant cells.
Materials and methods Strains and plasmids E. coli K-12 strain RB791 (F¯, INrrnD-rrnE1, λ¯, lacIqL8) was used in all experiments. The strain was kindly provided from the E. coli Stock Center (New Haven, USA). The strain was transformed with the plasmids pKK177glucC (4,675 bp, Amp; Kopetzki et al. 1989), and pUBS520 (5,363 bp, Km; Brinkmann et al. 1989). The plasmid pKK177glucC contains the gene of the α-glucosidase (glucP1) from Saccharomyces cerevisiae under control of a Ptac promoter and a strong ribosome-binding site. The plasmid pUBS520 was used in connection with pKK177glucC to increase the level of the minor dnaY tRNA (AGA/AGG), as the glucP1 gene contains a high level of AGG/AGA codons. E. coli RB791 pKK177glucC pUBS520 is further called recombinant wild-type strain. The E. coli strains RB791P (RB791, clpP::cm) and RB791PS (RB791, clpP::cm, rpoS::tet) were constructed by P1 transduction of E. coli RB791 (Miller 1992; Schweder et al. 1996). These strains were also transformed with the plasmids pKK177glucC and pUBS520. Cultivation medium and growth conditions Glucose/ammonia-based mineral salt medium with the following composition was used in all cultivations (in g l–1): Na2SO4 2.0, (NH4)2SO4 2.468, NH4Cl 0.5, K2HPO4 14.6, NaH2PO4·2 H2O 4.0, (NH4)2-H-citrate 1.0, and thiamine 0.1. The medium also contained 1 M MgSO4 (2 ml l–1) and 2 ml l–1 of trace component solution (Holme et al. 1970). The initial glucose concentration was 5 g l–1 in all fermentation experiments, but 10 g l–1 in shake flask cultivations and in the fermentations for purification of the RNA polymerases. The pH was set at 7.0 before sterilization by addition of NaOH, and adjusted before the start of fermentation with ammonia (25%). The feed solution for the fed-batch experiments contained (in g kg–1): glucose 200, Na2SO4 2.0, (NH4)2SO4 2.0, NH4Cl 0.5, K2HPO4 14.6, NaH2PO4·2H2O 4.0, (NH4)2-H-citrate 1.0, and trace component solution 10 ml kg–1. Additionally 2.75 ml l–1 MgSO4 (1 M) was added during the fed-batch cultivations twice during the feeding to avoid precipitation. For pre-cultivation, a single colony from a selective plate was inoculated into a shake flask containing nutrient broth (NBII, Difco). The fermentation inoculum was obtained from a second 1-l flask containing mineral salt medium, which was inoculated with the first pre-culture. Both pre-cultures were harvested in the exponential growth phase after cultivation for approximately 8–12 h at 37 °C on a rotary shaker at 160 rpm. The fed-batch cultivations were carried out in a 6-l Biostat ED bioreactor (B. Braun Biotech) with an initial culture volume of 4 l at a temperature of 35 °C. Air flow (0.002–2 vvm) and stirrer speed (200–800 rpm) were controlled in a cascade mode during the batch phase to keep the dissolved oxygen tension above 20%. Feed at a constant rate was started with a feed flow rate of 53.2 g h–1 shortly before the glucose was exhausted, at an optical cell density (OD500) of about 8. At the feeding start, air flow and stirrer speed were set to 2 vvm and 800 rpm, respectively, and kept constant to the end of the fermentation. Induction was performed by addition of 1 mM isopropyl-β-D-thiogalactopyranoside (IPTG) 3 h after the start of feeding. Appropriate antibiotics for initial selection pressure were added to all agar plates, and at the start of all shake flask and fermenter cultivations (appropriate concentrations: ampicillin 100 mg l–1, kanamycin 10 mg l–1, chloramphenicol 35 mg l–1, tetracycline 10 mg l–1).
Analytical methods Growth and colony-forming units Growth of the cultures was followed by measuring the optical cell density at 500 nm (OD500), by microscopy with a cell counting chamber (0.02-µm depth), and by analysis of the cell dry weight (CDW). To determine CDW, 1.5-ml cell suspensions were centrifuged in pre-weighed tubes, washed once with 0.9% (w/v) NaCl solution, and dried to constancy at 60 °C for at least 15 h. On average a dry cell content of 1 mg ml–1 resulted in an OD500 of 4.0 and a cell number of 1.88×10⁹ ml–1. The relationship between dividing and non-dividing cells was calculated from microscopic analysis and the number of colony forming units on NB plates. Plasmid stability was followed with the replica plating method. Cells growing on NB plates were stamped or picked to plates containing the corresponding antibiotics.
α-Glucosidase analysis The concentration of α-glucosidase in relation to the total cellular protein was calculated from 10% SDS-PAGE gels by analysis of the total cellular extracts as described earlier (Lin and Neubauer 2000). Quantification was carried out with the Phoretix software (Phoretix, England) after scanning the gels (ScanJet 3300 C, Hewlett Packard, HP precision Scan LT, resolution 1200 DPI). The area of the bands containing the recombinant product was determined and amounts were calculated by means of calibration curves with standard amounts of pure α-glucosidase, which were run on the same gel (Lin and Neubauer 2000). Analysis of σS and σ70 The concentration of σS (σ38, rpoS gene product) was analyzed by Western blotting according to Lange and Hengge-Aronis (1994) with slight modifications as described recently (Teich et al. 1999). The vegetative sigma factor σ70 (rpoD gene product) was analyzed with the same method with polyclonal antibodies kindly donated by A. Ishihama (Mishima, Japan). The bands were verified by N-terminal sequencing. mRNA analysis Cells corresponding to 0.5–1.0 mg dry weight were harvested into 400 µl of ice-cold “killing-buffer” (20 mM NaN3, 20 mM TrisHCl, pH 7.5, 5 mM MgCl2) and centrifuged (3 min, 18,000 ×g). The supernatant was removed and the pellets were frozen at –20 °C for further analysis. Total cellular RNA was isolated with the High Pure RNA isolation kit (Boehringer Mannheim), according to the manufacturer’s instructions. The isolated RNA was diluted with 10×SSC (1.5 M NaCl, 0.15 M Na-citrate, pH 7) and transferred in different dilutions to a positively charged nylon membrane by slot blotting, followed by hybridization with digoxigenin-labeled RNA probes, according to the manufacturer’s instructions (Boehringer Mannheim). These RNA probes were synthesized in vitro with T7 RNA polymerase from PCR products containing a T7 promoter sequence. The following primers were used for synthesizing the appropriate PCR products: ● ● ● ●
5′CAGTGATAACGATTTGGCCG and 5′CTAATACGACTCACTATAGGGAGAGTTGCGTATGTTGAGAAGCG for rpoS, 5′GATCCTCGAAGACCAATCCG and 5′CTAATACGACTCACTATAGGGAGAGAATCTGGTAAACCAGGACG for glucP1, 5′TGCTGGCTGTAATGTTGACC and 5′CTAATACGACTCACTATAGGGAGACCTGGCTTTCAACGAAACCG for osmY, 5′GACCGAGGTTGAGATTGATGG and 5′CTAATACGACTCACTATAGGGAGACGCGCTGAACTTTGATACGC for rpoA.
The hybridization signals on the filters were quantified with the Lumi-Imager from Boehringer Mannheim. Every sample was add-
332 ed to the filter in six different concentrations, and only the signals in the linear range were evaluated. The signals were normalized to the amount of total RNA in the samples. For graphic presentation of the mRNA levels in this study, the sample shortly before the point of induction was set to one. All the other mRNA levels were calculated according to the biomass-specific value of this sample. Purification of RNA polymerase Purification of E. coli RNA polymerase was carried out at 4 °C according to Burgess and Jendrisak (1975) with slight modifications. Therefore, cells cultivated in 8 l of mineral salt medium with 10 g l–1 of glucose were harvested on ice in the exponential growth phase at an OD500 of 10, by centrifugation without washing, and stored at –20 °C until use. For lysis, cells were suspended in 250 ml grinding buffer (Burgess and Jendrisak 1975) and disrupted using a French pressure cell (40 K cell, 2,000 psi). After centrifugation the crude extract was precipitated with polyethylenimine (Sigma), which was added to a final concentration of 5% for 10 min under stirring and centrifuged at 10,000 ×g for 20 min. The supernatant was discarded and the pellet was resuspended in TGED buffer (Burgess and Jendrisak 1975) containing 0.5 M NaCl and centrifuged at 15,000 ×g for 20 min. The pellet was resuspended in TGED buffer with 1 M NaCl and centrifuged for 15,000 ×g for 20 min. The last step was repeated three times, supernatants were collected and precipitated overnight with ammonium sulfate, giving a 55% saturation. After centrifugation for 1 h at 15,000 ×g the pellet was resuspended in a small volume of TGED buffer containing 0.15 M NaCl and dialyzed against this buffer. This solution was applied to a DNA agarose column (10-ml column volume, Amersham Pharmacia) recently equilibrated with TGED buffer containing 0.15 M NaCl. Polymerase was eluted with a TGED buffer gradient from 0.15 to 1 M NaCl. Fractions containing RNA polymerase activity were identified by in vitro transcription. Assay mixtures contained (in 0.25 ml): 0.04 M Tris, pH 7.9, 0.01 M MgCl2, 0.1 mM EDTA, 0.1 mM dithiothreitol, 0.15 M KCl, 0.5 mg ml–1 bovine serum albumin, 1 mM each of ATP, GTP, CTP, and UTP (10 Ci of 3H per mole), 0.15 mg ml–1 of calf thymus DNA, and 25 µl of the protein fractions. Assays were incubated at 37°C for 20 min, chilled on ice, and precipitated with 3 ml of 5% trichloroacetic acid. After 30 min, the precipitate was collected on a filter disc and washed twice with 3 ml 2% trichloroacetic acid and once with 3 ml absolute ethanol. Filters were dried, and after addition of scintillation liquid, measured in a Liquid Scintillation Counter TriCarb 2100TR (Packard Instruments). The active fractions were pooled and concentrated to a protein concentration of about 1.5 µg ml–1. Analysis of the purified RNA polymerases was performed by SDS-PAGE, followed by staining with Coomassie blue and by Western blotting.
Product formation and cell segregation in fed-batch cultivations of E. coli RB791 The fed-batch method for cultivation and production of the recombinant α-glucosidase was chosen as the basic cultivation method in this study. Aside from the practical aspect that many industrial processes for recombinant products are performed in a similar way, the fed-batch
▲
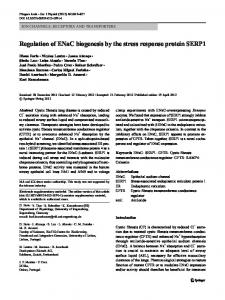
Fig. 1 Colony forming ability (a), α-glucosidase production (b), and cell density (OD500) (c) of Escherichia coli RB791 (pKK177glucC pUBS520) grown in glucose-limited fed-batch cultures (white squares without induction, black squares with induction) and of the corresponding clpP (inverted triangles) and clpP rpoS (triangles) mutants. The feeding start is indicated by a dotted line. Isopropyl-β-D-thiogalactopyranoside (IPTG) was added (interrupted line) 3 h after feeding start. The data for the colony-forming ability were obtained after replica plating from colonies grown on NB agar plates to agar plates containing the respective antibiotics. The data originate from two independent fermentations of each strain (four fermentations of the recombinant wild type). The total concentration of α-glucosidase is presented as mg g–1 cell dry weight. The decrease of α-glucosidase in the recombinant wild type from 7 h after induction is caused by overgrowth of plasmid-free cells as shown earlier (Lin and Neubauer 2000). The total cell number after induction increased in all cases. Only the colony-forming ability is lost to a different degree, depending on the genetic background of the strain
Results
333
Fig. 3 Radioimmunoblot of the σS level in shake flask cultures of E. coli RB791 (pKK177glucC pUBS520) (lanes 5, 6) and the corresponding clpP (lanes 1, 2, 7, 8) and clpP rpoS (lanes 3, 4) mutants. The radioimmunoblot was performed after separation of equal amounts of cell extract by SDS gel electrophoresis. The samples correspond to the time of induction (t0) at OD500=0.5 (lanes 1, 3, 5, 7) and 1 h after induction (lanes 2, 4, 6, 8). The cultivations were performed with glucose-based mineral salt medium at 37 °C
Fig. 2 Immunoblots of the cellular levels of σS in glucose-limited fed-batch fermentations of E. coli RB791 (pKK177glucC pUBS520) without induction of α-glucosidase (a), with induction at 3 h after feed start (b), and in the corresponding clpP mutant with induction (c). A time of 0 h is related to the feed start. IPTG (arrows) was added after removal of the 3-h sample from b and c. All samples correspond to the same amount of cells applied to each lane
method is optimal for the question under study, as the stringent response and the general stress response are induced by the glucose-limited growth of E. coli in a fedbatch fermentation process. This results in a measurable level of guanosine 5′-diphosphate-3′diphosphate (ppGpp) and σS (Andersson et al. 1996; Neubauer et al. 1995; Teich et al. 1998, 1999). The fed-batch cultivation of E. coli RB791 (pKK177glucC pUBS520) is only briefly summarized here, as it was described earlier in detail (Lin and Neubauer 2000; Lin et al. 2001a; Teich et al. 1998). After an initial batch phase with growth at the maximum specific growth rate of 0.70±0.03 h–1 according to the cell number (0.79±0.05 h–1 for OD500), a constant feed of a concentrated glucose solution was started shortly before the initial glucose was consumed. The specific growth rate declined due to the limited amount of glucose available for growth. However, after the start of glucose feeding, growth proceeded approximately linearly within the first hours (Fig. 1c). Without induction of α-glucosidase expression (reference cultures), total cell number and colony-forming units increased in parallel (data not shown). During a time frame of 25 h after the start of feeding (final specific growth rate of 0.03 h–1), neither cell segregation to non-growing cells nor a higher lysis, according to the level of extracellular protein, could be detected in the control cultivations without induction (Lin and Neubauer 2000). However, when the overproduction of the α-glucosidase was induced by addition of IPTG during the feeding phase, cellular growth was inhibited within 1 h (Fig. 1c) and cells lost their ability to divide according to two-phase kinetics (Fig. 1a). After induction, α-glucosidase accumulated
to a maximal 45 mg g–1 dry cell weight, corresponding to 8–10 % of total cell protein (Fig. 1b). In order to determine how the overproduction of heterologous α-glucosidase influences the general starvation response, we analyzed the level of the response regulator σS in the same cultivations. As shown in Fig. 2a, the σS level increases in the control fed-batch fermentation without induction of the expression system. However, after addition of IPTG and the induction of the overproduction of the α-glucosidase, the level of the stress sigma factor σS decreased about twofold within 2 h (Fig. 2b). The reduction of σS was also observed in cultures with E. coli RB791 (pKK177glucC) but without pUBS520 (data not shown). In shake flask cultures of both strains with a low level of σS at the point of induction, the sigma factor concentration decreased below the detection limit within 1 h of induction of the expression system (Fig. 3). The rpoS mRNA level decreased by a factor of about 8 within 2 h of induction, but in the control fermentation without induction rpoS showed a significantly increased mRNA level (Fig. 4). In correlation with the results for σS, the level of osmY mRNA, a gene that is exclusively transcribed by the σS-RNA polymerase holoenzyme (Hengge-Aronis et al. 1993), decreased below the detection limit after induction (Fig. 4) and did not increase until the end of the cultivations. In contrast, in cultivations without induction, the osmY mRNA level increased with a delay of some hours after σS (Fig. 4), which possibly reflects its negative regulation by additional factors, such as cAMP and Lrp (Lange et al. 1993). In order to clarify whether the loss of the viability of the cells after induction is related to the decrease of σS, we investigated a clpP mutant strain with a constitutive high σS level and a rpoS clpP double mutant. The clpP mutant showed similar growth to the recombinant wildtype strain without induction. Correspondingly, the analysis of the colony-forming ability after induction of α-glucosidase overproduction indicated a significantly higher viability of the clpP-deficient cells with a high σS level compared with the recombinant wild-type strain and the rpoS clpP double mutant (Fig. 1a, c). Assuming that the colony-forming ability is decreased by first-or-
334 Table 1 Characteristic data of the different Escherichia coli strains in glucose-limited fedbatch cultivations with induction of α-glucosidase
Straina
RB791 RB791P RB791PS
Characteristics
Wild type clpP clpP rpoS
µmax in batchb (h–1) 0.79±0.05 0.51 0.71
a All strains contain the plasmids pKK177glucC bµ max was calculated from OD500 values c Level at 7 h after induction
der kinetics, the corresponding specific rate constants (kD) are 0.38±0.08 h–1 for the clpP+ wild-type strain (calculated from 2 h after induction) and 0.06 h–1 for the clpP mutant (Table 1). In accordance with the results of Schweder et al. (1996), we detected a high level of σS by immunoblot analysis in the clpP mutant strain (Figs. 2c and 3). The clpP mutant grew more slowly (µmax= 0.51 h–1) than the recombinant wild-type strain (µmax= 0.79±0.05 h–1), but the fed-batch fermentation was still glucose limited. The high level of σS in the clpP mutant increased further during the transient to glucose-limited growth (Fig. 2c) and remained at a high level during the fed-batch phase. This high content of σS in the clpP mutant was not significantly influenced by induction of αglucosidase synthesis (Fig. 2c). This was in accordance with the rpoS and osmY mRNA concentrations, which did not change after induction (Fig. 4). In shake flask experiments, the σS level was three to four times higher in the clpP mutant than in the recombinant wild-type strain, and did not significantly decrease within 3 h of induction (Fig. 3). Unexpectedly, the α-glucosidase product concentration in the clpP mutant was clearly lower than in the recombinant wild-type cultivations (Fig. 1). The corresponding specific production rates measured within the 1st h after induction (qp in grams per gram cell dry weight and hour) were 0.26 for the clpP+ wild-type strain and 0.04 for the clpP mutant (Table 1). Correspondingly, the glucP1 mRNA level was considerably lower after induction in the clpP mutant than in the clpP+ wild-type strain (Fig. 4). The clpP rpoS double mutant, which does not produce σS, had a similar growth rate as the recombinant wild-type strain (Table 1). Following induction, the loss of viability was faster in the clpP rpoS double mutant than in the recombinant wild-type strain (Fig. 1a, Table 1), and the growth was correspondingly inhibited, although the inhibition was less than in cultivations of the recombinant wild-type strain with induction. Surprisingly, the yield of α-glucosidase was not as high as in the cultivation with the recombinant wild-type strain, and only slightly higher than in the clpP mutant (Fig. 1a, c, Table 1). However, in contrast to the clpP mutant, the glucP1 mRNA increased to a similar high level as in the recombinant wild-type strain within 1 h of induction. While the glucP1 mRNA level increased further in this strain up to 3 h after induction, it decreased in the clpP rpoS double mutant 1 h after induction (Fig. 4).
kD after induction (h–1) 0.38±0.08 0.06 0.79
Level of α-glucosidasec (mg g–1)
(mg l–1)
46 8 10
400 60 120
and pUBS520
Fig. 4 Concentration of different mRNAs in glucose-limited fedbatch cultures of E. coli RB791 (pKK177glucC pUBS520) with induction (black bars, left side) and without (reference, striped bars, left side) compared with corresponding cultivations with the related clpP (gray bars, right side) and clpP rpoS (white bars, right side) mutant strains. The mRNA levels were calculated on the basis of the total RNA and normalized to the values determined shortly before induction. The zero values in the graph for osmY mRNA belong to the fermentation with induction of α-glucosidase. No osmY mRNA could be detected in the clpP rpoS mutant. The time of IPTG addition is indicated by a dotted line. The error bars represent independent analyses from two different fermentations
The rpoA mRNA was measured as a control for a host vegetative gene, which is transcribed by the σ70 RNA polymerase holoenzyme. The amount of this mRNA transiently decreased in the recombinant wild-type strain shortly after induction of the strong tac-promoter-directed expression system. The clpP rpoS mutant also showed a slight transient decrease of the rpoA mRNA
335
the same in all three polymerase preparations (Fig. 5b), which is in accordance with the results of Jishage and Ishihama (1995).
Discussion
Fig. 5a–c Analysis of RNA polymerase preparations from batch cultivations on glucose mineral salt medium of E. coli RB791 (pKK177glucC pUBS520) and the corresponding clpP and clpP rpoS mutants before induction of the α-glucosidase. Samples were taken during the exponential growth phase. a SDS gel electrophoresis. Immunoblots of the pooled fractions with high RNA polymerase activity with antibodies for σ70 (b) and σS (c)
level, but the clpP mutant showed a significant long-lasting decrease of the rpoA mRNA level after induction of α-glucosidase overproduction. Comparison of different RNA polymerases The above data suggest that σS and σ70 compete for core RNA polymerases. In order to prove that more σS binds to RNA polymerases in the clpP mutant, we purified the RNA polymerases from exponentially growing cells of different strains (Fig. 5a). The analyses indicated that the purified RNA polymerase fraction of the clpP mutant had an approximately four times higher level of σS than the RNA polymerase fraction of the recombinant wildtype cells. No σS signal could be identified in the RNA polymerase preparation of the clpP rpoS double mutant (Fig. 5c). The concentration of σ70 was approximately
It is well established that the overproduction of recombinant proteins induces a heat shock-like response. However, the importance of other stress responses in recombinant systems has not been elucidated to date. Here we show for the Gram-negative bacterium E. coli K-12 overproducing the heterologous model protein α-glucosidase under fed-batch fermentation conditions that the general stress response is not induced, but suppressed. This could be shown by the analysis of the level of the response regulator σS, as well as by the mRNA level of a σS-dependent gene. The data of this study indicate that the stress response regulated by the alternative sigma factor σS plays a role in the survival during the overproduction of recombinant proteins in E. coli in a glucose-limited fed-batch fermentation. A rpoS clpP mutant showed a dramatically high cell death rate after induction and accumulated a significantly lower amount of α-glucosidase than the recombinant wild-type strain. Although the glucP1 mRNA content of the rpoS mutant initially increased to a comparable level to the recombinant wild-type strain, with loss of the colony-forming ability as early as 1 h after induction the glucP1 mRNA level started to decrease. In contrast, a clpP mutant showed only a slight loss of viability of the α-glucosidase-overproducing E. coli cells, although it is not clear whether this effect is only due to the function of σS, or also due to the lower production of α-glucosidase in this mutant background. The results of this study indicate that the high level of σS in the clpP mutant leads to downregulation of genes, which are regulated by the σ70-RNA polymerase, as σS competes with the house-keeping sigma factor σ70 for the RNA polymerase core enzyme. Thereby, the transcription of σ70-regulated recombinant expression systems, such as the Ptac system, is negatively impaired in a clpP mutant. This is in accordance with the study of Chou et al. (1996) who obtained higher recombinant product formation at low growth rates in a rpoS mutant. The data are also consistent with the results of Dedhia et al. (1997) who found a threefold increase of CAT mRNA levels in a relA mutant with a lower level of ppGpp and therefore a lower content of σS (Gentry et al. 1993). It is supposed that a major bottleneck of recombinant protein production is the competition of the heterologous mRNA with the host mRNAs at the level of translation (Dong et al. 1995; Rinas 1996). Our data indicate that the competition of different sigma factors for core RNA polymerase should also be considered in the production of recombinant proteins. The balance of the cellular sigma factors is of regulatory importance for the gene expression pattern in general (Farewell et al. 1998; Jishage and Ishihama 1995; Jishage et al. 1996). We showed ear-
336
lier that under fed-batch fermentation conditions the levels of σS and ppGpp are significantly elevated (Andersson et al. 1996; Neubauer et al. 1995; Teich et al. 1999). Although the sigma factor concentration itself is no proof of competition, as extensively discussed by Farewell et al. (1998), the higher levels of both σS and ppGpp according to the results of Kvint et al. (2000), increase the transcription competence of σS-RNA polymerase holoenzyme, and in this way are a competitor to the vegetative sigma factor σ70. The comparison of fed-batch fermentations with induction and non-induced control cultivations adds further information on the physiology of E. coli in recombinant bioprocesses, which are characterized by a continuously decreasing growth rate. Results of this study suggest that sigma factor competition can lead to a downregulation of strong expression systems, and thus significantly decrease the yield of the recombinant production process. Therefore, the choice of an expression system and its regulating sigma factor should be more carefully considered in strain and process design. Acknowledgements This work was supported by the Biotechnology Program of the European Community (BIO-CT95-0028, BIOCT98-0167) and the Kultusministerium of Mecklenburg-Vorpommern. The authors kindly thank Regine Hengge-Aronis (Berlin, Germany) for her generous gift of σS antibodies, Erhard Kopetzki and Roche Diagnostics (Penzberg, Germany) for the plasmids pKK177glucC and pUBS520, the E. coli Stock Center (New Haven, USA) for the strain RB791, Peter Rücknagel (Halle, Germany) for the Nterminal sequencing, and Jason Smith (Halle, Germany) for critical reading of the manuscript. B.J. and H.Y.L. contributed equally to the results.
References Andersson L, Yang S, Neubauer P, Enfors S-O (1996) Impact of plasmid presence and induction on cellular responses in fedbatch cultures of Escherichia coli. J Biotechnol 46:255–263 Bahl H, Echols H, Straus DB, Court D, Crowl R, Georgopoulos CP (1987) Induction of the heat shock response of E. coli through stabilization of σ32 by the phage lambda cIII protein. Genes Dev 1:57–64 Brinkmann U, Mattes RE, Buckel P (1989) High-level expression of recombinant genes in Escherichia coli is dependent on the availability of the dnaY gene product. Gene 85:109–114 Burgess RR, Jendrisak JJ (1975) A procedure for the rapid, largescale purification of Escherichia coli DNA-dependent RNA polymerase involving polyimin P precipitation and DNA cellulose chromatography. Biochemistry 14:4634–4638 Chou C-H, Bennett GN, San K-Y (1996) Genetic manipulation of stationary-phase genes to enhance recombinant protein production in Escherichia coli. Biotechnol Bioeng 50:636–642 Dedhia N, Richins R, Mesina A, Chen W (1997) Improvement in recombinant protein production in ppGpp-deficient Escherichia coli. Biotechnol Bioeng 53:379–386 Dong H, Nilsson L, Kurland CG (1995) Gratuitous overexpression of genes in Escherichia coli leads to growth inhibition and ribosome destruction. J Bacteriol 177:1497–1504 Farewell A, Kvint K, Nyström T (1998) Negative regulation by RpoS: a case of sigma factor competition. Mol Microbiol 29:1039–1051 Gentry DR, Hernandez VJ, Nguyen LH, Jensen DB, Cashel M (1993) Synthesis of the stationary-phase sigma factor σS is positively regulated by ppGpp. J Bacteriol 175:7982–7989
George HA, Powell AL, Dahlgren ME, Herber WK, Maigetter RZ, Burgess BW, Stirdivant SM, Greasham RL (1992) Physiological effects of TGFα-PE40 expression in recombinant E. coli JM109. Biotechnol Bioeng 40:437–445 Gill RT, Valdes JJ, Bentley WE (2000) A comparative study of global stress gene regulation in response to overexpression of recombinant proteins in Escherichia coli. Metab Eng 2:178– 189 Gill RT, DeLisa MP, Valdes JJ, Bentley WE (2001) Genomic analysis of high-cell-density recombinant Escherichia coli fermentation and “cell conditioning” for improved recombinant protein yield. Biotechnol Bioeng 72:85–95 Goff SA, Goldberg AL (1985) Production of abnormal proteins in Escherichia coli stimulates transcription of lon and other heat shock genes. Cell 41:587–595 Hengge-Aronis R, Lange R, Henneberg N, Fischer D (1993) Osmotic regulation of rpoS-dependent genes in Escherichia coli. J Bacteriol 175:259–265 Holme T, Arvidson S, Lindholm B, Pavlu B (1970) Enzymes: laboratory-scale production. Process Biochem 5:62–66 Ito K, Akiyama Y, Yura T, Shiba K (1986) Diverse effects of the MalE-LacZ hybrid protein on Escherichia coli cell physiology. J Bacteriol 167:201–204 Jishage M, Ishihama A (1995) Regulation of RNA polymerase sigma subunit synthesis in Escherichia coli: intracellular levels of σ70 and σ38. J Bacteriol 177:6832–6835 Jishage M, Iwata A, Ueda S, Ishihama A (1996) Regulation of RNA polymerase subunit synthesis in Escherichia coli: intracellular levels of four species of sigma subunit under various growth conditions. J Bacteriol 178:5447–5451 Jürgen B, Lin HY, Riemschneider S, Scharf C, Neubauer P, Schmid R, Hecker M, Schweder T (2000) Monitoring of genes that respond to overproduction of an insoluble recombinant protein in Escherichia coli glucose-limited fed-batch fermentations. Biotechnol Bioeng 70:217–224 Kopetzki E, Schumacher G, Buckel P (1989) Control of formation of active soluble or inactive insoluble baker’s yeast alpha-glucosidase PI in Escherichia coli by induction and growth conditions. Mol Gen Genet 216:149–155 Kosinski MJ, Bailey JE (1991) Temperature and induction effects on the degradation rate of an abnormal β-galactosidase in Escherichia coli. J Biotechnol 18:55–68 Kosinski MJ, Bailey JE (1992) Structural characteristics of an abnormal protein influencing its proteolytic susceptibility. J Biotechnol 23:211–223 Kosinski MJ, Rinas U, Bailey JE (1992) Proteolytic response to the expression of an abnormal β-galactosidase in Escherichia coli. Appl Microbiol Biotechnol 37:335–341 Kvint K, Farewell A, Nystrom T (2000) RpoS-dependent promoters require guanosine tetraphosphate for induction even in the presence of high levels of sigma(s). J Biol Chem 275:14795– 14798 Lange R, Hengge-Aronis R (1994) The cellular concentration of the σs subunit of RNA polymerase in Escherichia coli is controlled at the levels of transcription, translation, and protein stability. Genes Dev 8:1600–1612 Lange R, Barth M, Hengge-Aronis R (1993) Complex transcriptional control of the σS-dependent stationary phase-induced and osmotically regulated osmY (csi-5) gene suggests novel roles for Lrp, cyclic AMP (cAMP) receptor protein-cAMP complex and integration host factor in the stationary phase response of Escherichia coli . J Bacteriol 175:7910–7917 Lin HY, Neubauer P (2000) Influence of controlled glucose oscillations on a fed-batch process of recombinant Escherichia coli. J Biotechnol 79:27–37 Lin HY, Hanschke R, Nicklisch S, Nietsche T, Jarchow R, Schwahn C, Riemschneider S, Meyer S, Gupta A, Hecker M, Neubauer P (2001a) Cellular responses to strong overexpression of recombinant genes in Escherichia coli DNA relaxation and cell death after induction of α-glucosidase. In: Merten O-W, Mattanovich D, Lang C, Larsson G, Neubauer P, Porro D, Postma PW, Teixeira de Mattos J, Cole J (eds) Recombinant
337 protein production with prokaryotic and eukaryotic cells. A comparative view on host physiology. Kluwer, Dordrecht, The Netherlands, pp 55–74 Lin HY, Mathiszik B, Xu B, Enfors S-O, Neubauer P (2001b) Determination of the maximum specific uptake capacities for glucose and oxygen in glucose limited fed-batch cultivations of Escherichia coli. Biotechnol Bioeng 73:347–357 Miller JH (1992) A short course in bacterial genetics. Cold Spring Harbor Laboratory Press, Cold Spring Harbor, p 263–267 Neubauer P, Winter J (2001) Expression and fermentation strategies for recombinant protein production in Escherichia coli. In: Merten O-W, Mattanovich D, Lang C, Larsson G, Neubauer P, Porro D, Postma PW, Teixeira de Mattos J, Cole J (eds) Recombinant protein production with prokaryotic and eukaryotic cells. A comparative view on host physiology. Kluwer, Dordrecht, The Netherlands, pp 196–260 Neubauer P, Åhman M, Törnkvist M, Larsson G, Enfors S-O (1995) Response of guanosine tetraphosphate to glucose fluctuations in fed-batch cultivations of Escherichia coli. J Biotechnol 43:195–204 Parsell DA, Sauer RT (1989) Induction of a heat shock-like response by unfolded protein in Escherichia coli: dependence on protein level not protein degradation. Genes Dev 3:1226– 1232
Rinas U (1996) Synthesis rates of cellular proteins involved in translation and protein folding are strongly altered in response to overproduction of basic fibroblast growth factor by recombinant Escherichia coli. Biotechnol Prog 12:196–200 Schweder T, Lee KH, Lomovskaya O, Matin A (1996) Regulation of Escherichia coli starvation sigma factor (σs) by ClpXP protease. J Bacteriol 178:470–476 Snow A, Hipkiss AR (1987) Stability of urogastone and some fusion derivatives and the induction of stress proteins in Escherichia coli. Biochem Soc Trans 15:965–966 Teich A, Lin HY, Andersson L, Meyer S, Neubauer P (1998) Amplification of ColE1 related plasmids in recombinant cultures of Escherichia coli after IPTG induction. J Biotechnol 64: 197–210 Teich A, Meyer S, Lin HY, Andersson L, Enfors S-O, Neubauer P (1999) Growth rate related concentration changes of the starvation response regulators σS and ppGpp in glucose limited fed-batch and continuous cultures of Escherichia coli. Biotechnol Prog 15:123–129 Vind J, Sorensen MA, Rasmussen MD, Pedersen S (1993) Synthesis of proteins in Escherichia coli is limited by the concentration of free ribosomes: expression from reporter genes does not always reflect functional mRNA levels. J Mol Biol 231: 678–688