Running head: INEQUALITY, COMPETITIVENESS, MOTIVATION
1
Pre-proof version. Accepted for publication in: Journal of Personality
Income Inequality, Perceived Competitiveness, and Approach-Avoidance Motivation Nicolas Sommet1,2 Andrew J. Elliot1 Jeremy P. Jamieson1 Fabrizio Butera2 1
2
University of Rochester, NY, USA
University of Lausanne, Switzerland
Submission Date: July, 28, 2017 Word count: 6,862 [excluding references, tables, and figures]
Acceptance Date: August, 28, 2018
Nicolas Sommet, Andrew J. Elliot, and Jeremy P. Jamieson, Department of Clinical & Social Sciences in Psychology, University of Rochester, Rochester, NY, USA. Nicolas Sommet, Life Course and Inequality Research Centre (LINES), University of Lausanne, Switzerland. Fabrizio Butera, Laboratoire de Psychologie Sociale (UNILaPS), University of Lausanne, Switzerland. Correspondence concerning this article should be addressed to Nicolas Sommet, Life Course and Inequality Research Centre (LINES), Bâtiment Géopolis, Bureau #5785, Quartier UNIL-Mouline, Université de Lausanne, 1015, Lausanne, Switzerland ; telephone number: +41 (0)21 692 32 55 ; email :
[email protected]
Running head: INEQUALITY, COMPETITIVENESS, MOTIVATION
2
Abstract Objective Scholars disagree on whether income inequality has incentive or disincentive effects. In the present research, we move beyond such debate and focus on the motivational processes that income inequality predicts. First, income inequality makes economic stratification salient, and therefore should promote perceived competitiveness. Second, competitiveness can be appraised as both a challenge and a threat, and therefore should promote both approach and avoidance motivation. Method In three studies (N = 2,543), U.S. residents from various ZIP codes reported the extent to which they perceived competitiveness in their town/city (Studies 1-3), as well as their economic achievement goals, achievement motives, and self-regulatory foci (Studies 2-3). Results Level of local income inequality was found to be a positive predictor—via increased perceived competitiveness—of other-approach economic goals, need for achievement, and promotion focus, as well as other-avoidance economic goals, fear of failure (specifically, the shame/embarrassment component), and prevention focus. Furthermore, actual and perceived income inequality were positively correlated. Conclusion The conceptual and empirical work herein is the first to show how the economic environment predicts individuals’ perceptions of competitiveness, influencing personal goals, motives, and orientations. It provides a more nuanced perspective on the implications of income inequality than perspectives currently available. Keywords: Income inequality, perceived competitiveness, economic achievement goals, achievement motives, self-regulatory focus.
Running head: INEQUALITY, COMPETITIVENESS, MOTIVATION
3
Income Inequality, Perceived Competitiveness, and Approach-Avoidance Motivation “And let us remark, first of all, that Competition acts forcibly, called forth as it is by these very inequalities” Frédéric Bastiat, 1860, p. 270 GDP per capita in Western countries grew exponentially during the last century (McNeill, 2001). However, income expansion did not occur at the same rate for all people. For example, in the U.S., while the inflation-adjusted income of the top 10% of earners increased by 65% from 1980 to 2012, that of the bottom 90% only increased by 17% (Piketty, Saez, & Zucman, 2015). Moreover, income inequality is not static across locations, even within the same country: For instance, in the most equal ZIP codes of the U.S., households in the highest income quintile earn 6 times more than those in the lowest income quintile; in the most unequal ZIP codes, households in the highest quintile earn 40 times more than those in the lowest.1 Scholars have long debated whether the level of income inequality erodes social capital and functions as a demotivating incentive (Knack & Keefer, 1997), or implies a higher return on labor and functions as a motivating incentive (Bell & Freeman, 2001). In the present research, we build upon the opposing processes model of competition (Murayama & Elliot, 2012) to reconcile these conflicting views: First, we seek to provide the first empirical evidence that income inequality promotes perceived competitiveness; and second, we seek to demonstrate how, through this mechanism, income inequality prompts opposing motivational processes: approach and avoidance. Income Inequality and Perceived Competitiveness Wilkinson and Pickett (2010) argued that income inequality exacerbates social status divisions, with people being more aware of their and others’ position on the social ladder. Income inequality is then presumed to increase attention to markers of social success, to
Running head: INEQUALITY, COMPETITIVENESS, MOTIVATION
4
encourage hierarchical ideology, and to prompt status competition, which may lead individuals to develop pervasive concerns regarding their relative social position. Similarly, income inequality is purported by others to increase the salience of status differences, reinforce social norms of consumption, discourage values of reciprocity, and breed a culture of positional competition (Kawachi, Kennedy, Lochner, & Prothrow-Stith, 1997; Kawachi & Subramanian, 2014; for a review on inequality and competition, see Buttrick & Oishi, 2017). More recently, Cheung and Lucas (2016) reported that the negative effect of neighbors’ (i.e., people within the same county’s) income on life satisfaction was stronger in more economically unequal U.S. counties. This finding was also interpreted as indicating that income comparison groups are more polarized in more unequal places (e.g., the 99% vs. the 1% of the “Occupy Wall Street” slogan), making normative standards of income comparison more salient. This converges with the idea that inequality may increase one’s sense of relative deprivation (Kondo, Kawachi, Subramanian, Takeda, & Yamagata, 2008) thereby conveying the feeling of status struggles through local social comparisons (Frank, 2013). Although they differ in emphasis, the aforementioned accounts share the view that income inequality creates a social environment in which economic stratification is salient and people are concerned about their position within the hierarchy. A fundamental assumption underlying this perspective—albeit one neither directly stated nor empirically tested—is that income inequality is associated with the perception of competition for resources. Given the lay theory that economics is a zero-sum game (in which one’s higher income automatically implies others’ lower income; Friedman & Friedman, 1990), we posit that income inequality can lead individuals to perceive that people are competing against one another (a negative social interdependence in which one’s success comes at the expense of others), rather than cooperating (a positive social interdependence in which one’s success benefits others; Johnson & Johnson, 1974). That is, inequality in the economic environment may be
Running head: INEQUALITY, COMPETITIVENESS, MOTIVATION
5
associated with the perception that others are competitive. This is consistent with Schneider’s (2012) idea that income inequality sculpts social perceptual processing by strengthening or lessening cognitive schemata associated with social groups (e.g., “the rich,” “the poor,” and how they typically interact). Perceived Competitiveness and Approach-Avoidance Motivation Competitiveness—including perceived competitiveness—is linked to both approach and avoidance motivational processes (Hangen, Elliot, & Jamieson, 2016; Murayama & Elliot, 2012). Approach motivation entails the energization or direction of behavior towards a desirable object or situation, whereas avoidance energizes or directs behavior away from an undesirable object or situation (Elliot, 2006). The approach-avoidance distinction is a core feature of contemporary approaches to motivation, including achievement goals (Dweck, 1986), achievement motives (McClelland, 1985), and regulatory foci (Higgins, 1997). Achievement goals are concrete standards of competence that one approaches or avoids (Elliot, Murayama, & Pekrun, 2011). The two most studied achievement goals are other- and self-based goals. Other-approach goals focus on attaining normative competence (e.g., earning more than others), whereas other-avoidance goals focus on avoiding normative incompetence (e.g., not earning less than others). Self-approach goals focus on attaining selfreferential competence (e.g., earning more over time), whereas self-avoidance goals focus on avoiding self-referential incompetence (not earning less over time). Achievement motives are broad orientations toward approaching competence and avoiding incompetence (McClelland, 1985). The two most studied achievement motives are the need for achievement and fear of failure. Need for achievement represents a desire to approach the pride of success, whereas fear of failure represents a desire to avoid the shame of failure. Both of these achievement motives have a strong grounding in social comparison (Atkinson, 1964; Birney, Burdick, & Teevan, 1969). Self-regulatory foci are domain general
Running head: INEQUALITY, COMPETITIVENESS, MOTIVATION
6
orientations regarding valued end-states (Higgins, 1997). There are two regulatory foci: A promotion focus oriented toward attaining ideals and acquiring gains, and a prevention focus oriented toward maintaining obligations and avoiding losses. We posit that the way people view the motivations of others in their economic environment influences their own motivation. Perceiving others as competitive is thought to shift attention toward social comparisons and to evoke general concerns about relative social position that energizes behavior (Elliot, 2006). In the context of challenge and threat theory, perceiving others as competitive can be appraised as both challenging (resources to cope with competitive others exceed the perceived demands of competition) and threatening (demands exceed resources). Accordingly, perceiving others as competitive may promote both approach and avoidance responses (see Urdan & Schoenfelder, 2006). A key way for individuals to regulate concerns about normative standing is to strive to outperform others and not be outperformed by others (Murayama & Elliot, 2012). Thus, we anticipated that perceived competitiveness would positively predict both types of other-based economic goals: otherapproach and other-avoidance. As perceived cooperation rather than competitiveness is more compatible with self-based goals (Wolters, 2004), we did not formulate predictions regarding self-based goals. Given that perceived competitiveness reflects experiences with stratification in specific economic environments over time, it likely influences broader motivational orientations, not only concrete economic goals. Accordingly, we anticipated that perceived competitiveness would positively predict approach and avoidance achievement motives, namely the need for achievement and fear of failure (see Johnson & Johnson, 1974, McClelland, 1985), and domain general approach and avoidance motivational orientations, namely promotion focus and prevention focus (see Ten Velden, Beersma, & De Dreu, 2009). Income Inequality to Approach-Avoidance Motivation
Running head: INEQUALITY, COMPETITIVENESS, MOTIVATION
7
through Perceived Competitiveness Income inequality has been linked to both appetitive (e.g., feelings of superiority; Loughnan et al., 2011) and aversive (e.g., feelings of inferiority; Layte, 2011) processes. Interestingly, appetitive processes are often interpreted as compensation strategies in response to the social anxiety elicited by income inequality, and aversive processes are seen as genuine cues of anxiety (for a review, see Paskov, Gërxhani, & van de Werfhorst, 2013). In our view, such interpretations are limited due to a lack of refutability (i.e., an observation and its opposite both tend to be interpreted as evidence of anxiety). In the following, we review the seemingly inconsistent findings in this literature, and propose an integrative model to account for the observed diversity of results. First, income inequality relates to both self-enhancement and self-diminishment. On one hand, income inequality is associated with overestimating one’s positive traits relative to others (Loughnan et al., 2011) and optimistic evaluations of one’s self-perceived social status (Zhao, 2012). On the other hand, income inequality is associated with the impression of earning less than others (Osborne, Sibley, & Sengupta, 2015) and feelings of being negatively evaluated because of one’s job/income (Layte & Whelan, 2014). Moreover, income inequality evokes both approach and avoidance social emotions. Whereas some research shows income inequality is associated with hope (Cheung, 2016) and anger toward top earners (Dawes, Fowler, Johnson, McElreath, & Smirnov, 2007), other research indicates income inequality is associated with social anxiety (Delhey & Dragolov, 2014) and fear (Godoy et al., 2006). At a more general level, income inequality is associated with the desire to be perceived as high-status and the fear of being perceived as low-status. That is, individuals from unequal places tend to strive for markers of high status (an appetitive motivation), which results in an increase of average annual workhours (the so-called “Veblen effect”; Bowles & Park, 2005), more economic risk-taking (Payne, Brown-Iannuzzi, & Hannay, 2017), and more conspicuous
Running head: INEQUALITY, COMPETITIVENESS, MOTIVATION
8
consumption (Walasek & Brown, 2015). However, individuals from unequal places also tend to strive to avoid markers of low status (an aversive motivation), that is, “to avoid appearing incompetent or inadequate in the eyes of others” (Wilkinson & Pickett, 2010, p. 226). In sum, income inequality seems to be linked with self-enhancement orientations, social approach emotions, and desires to signal superior status, as well as with selfdiminishing orientations, social avoidance emotions, and fears of signaling inferior status. The research presented here seeks to help resolve these seemingly incompatible patterns by providing evidence for an integrative model. More specifically, we hypothesize that perceptions of competitiveness stemming from income inequality elicit approach and avoidance motivations across people. Overview of Studies Hypotheses were tested across a series of three studies. Study 1 tested the hypothesis that income inequality is a positive predictor of perceived competitiveness (Hypothesis 1). Building on this foundation, Studies 2 and 3 sought to replicate and extend Study 1 by testing the hypotheses that perceived competitiveness is a positive predictor of approach motivation (i.e., other-approach goals, need for achievement, and promotion focus; Hypothesis 2a), as well as avoidance motivation (i.e., other-avoidance goals, fear of failure, and prevention focus; Hypotheses 2b), and that income inequality positively relates—via competitiveness— to approach and avoidance motivation (Hypotheses 3a and 3b, respectively). Note that the level of income inequality is more noticeable at more local geographic scales (for a review, see Johnston & Newman, 2016, pp. 175-177). Thus, hypotheses were tested using U.S. ZIP code-based indicators of income inequality (i.e., the lowest level of geographic aggregation available for American macroeconomic statistics). In each study, we first ensured that such economic indicator was positively correlated with perceived inequality. All sample sizes were determined a priori using power analyses. Analyses were planned a
Running head: INEQUALITY, COMPETITIVENESS, MOTIVATION
9
priori, and all data exclusions and variables analyzed are reported. All data were analyzed using Stata SE (version 15.1). Questionnaires, raw data, and syntax files for the three studies are available through FigShare (https://figshare.com/s/a74fe100f068d9327d0f). Study 1: Income Inequality and Perceived Competitiveness Study 1 was designed to test the relation between income inequality and perceived competitiveness. U.S. residents provided their ZIP code and city name before reporting the extent to which they perceived competitiveness in their town/city. Method Sample and procedure. A power analysis revealed that 787 participants were needed to detect a small-sized effect (f 2 = .01) with a power of .80 for a one-level linear multiple regression with 10 covariates. Invitations to complete an online survey on “people’s perceptions of their economic environment” were emailed using ResearchMatch, a national volunteer research registry. In this and the subsequent studies, we oversampled to ensure a sufficient number of respondents after excluding participants with missing data. Participants. Eight hundred and eighty-five participants completed the study. Fifteen were excluded a priori due to missing data. The final sample included 870 U.S. residents (195 men, 669 women, 7 unspecified; Mage = 47.17, SD = 15.31; 754 White/Caucasian, 44 Black/African-American, 26 Latino/a, 16 Asian, 24 “other,” and 7 unspecified; 62.51% working/employed, 15.07% unemployed/not working, 16.37% retired, and 6.05% students). Average annual income was $52,606 (SD = 29,316), and 71.26% of participants had a fouryear college degree or higher. Average political self-rating (1 = Very liberal to 7 = Very conservative) was M = 3.21 (SD = 1.69). The vast majority of participants had been living in their town/city for more than one year 1 year (93.56%). Clusters. Participants were nested in 710 ZIP code tabulation areas (known as ZCTAs, henceforth referred to as ZIP codes). The average number of inhabitants per ZIP code was
Running head: INEQUALITY, COMPETITIVENESS, MOTIVATION
10
30,756 (SD = 18,033)2, the employment rate was 61.19% (SD = 7.72), the percentage of the population living below the poverty line (< $12,000/year for a single person) was 14.69% (SD = 9.64), and the percentage of those without a high school diploma was 13.61% (SD = 8.24). Economic indicators were collected using the U.S. Census Bureau, 2010-2014 American Community Survey (ACS) estimates (see http://factfinder.census.gov/). Variables. Table 1 presents descriptive statistics, reliability estimates, and correlations for the inequality measures and perceived competitiveness. All self-report measures used a seven-point scale (1 = Not at all, 4 = Somewhat, 7 = Completely). In this and the subsequent studies, responses to items were averaged to obtain a score for each variable. Income inequality. The 2010-2014 ACS ZIP code-based Gini coefficients were used. The Gini coefficient describes the dispersion of household income distribution in a given area and ranges from “0” (perfect equality: all households have an equal share of income) to “1” (perfect inequality: one household has all of the income). We additionally collected urban area-based Gini coefficients and tested their predictive utility. The urban area-based Gini coefficient was not found to be a reliable predictor of perceived inequality or competitiveness, whereas the ZIP code-based Gini coefficient was generally found to have a greater predictive utility. This suggests that income inequality is more noticeable at the lower level of aggregation (results are presented in Supplementary Materials). Perceived income inequality. A three-item scale was created: “In my town/city, there is a huge gap between rich and poor.,” “…there is a big difference between those in the top 1% of income earners and the others.,” and “…the wealth disparity between upper and lower wage earners is large.” Perceived competitiveness. Murayama and Elliot’s (2012) five-item perceived competitiveness scale was adapted: “In my town/city, it seems that people are competing with
Running head: INEQUALITY, COMPETITIVENESS, MOTIVATION
11
each other.,” “…it seems that I am competing with others.,” “…people seem to share the feeling that competing with each other is important.,” “…I feel that I am being compared with others.,” and “…people seem to value competition.” Control variables and multiple imputation with chained equation (MICE). Ten covariates were controlled for. First, we decided a priori to control for six common participant-based sociodemographic variables: sex, age, ethnicity, employment status, income, and education. MICE with 20 imputed datasets was used to account for missing values on these variables. Perceived income inequality and perceived competitiveness items were used to impute the missing data (0.7% to 2.5% of observations). Second, because effects of income inequality might correspond to compositional effects, we decided (also a priori) to control for four important area-based composition variables identified by Wilkinson and Pickett (2006): ZIP code’s size (population), employment rate, absolute level of poverty, and percent without a high school education. In Studies 1-3, conclusions were identical with or without covariates (Table S3 presents the results for Hypothesis 1 and Figure S1 for Hypotheses 2-3). Results Preliminary analysis: Actual and perceived inequality. Gini coefficient was positively correlated with perceived inequality, r = .19, p < .001. Main analysis: Income inequality and perceived competitiveness. We used multiple imputation-based regression analysis.3 Perceived competitiveness was regressed on the Gini coefficient and covariates. Table 2 presents the full results (first column from the left). Supporting Hypothesis 1, Gini was a positive predictor of perceived competitiveness, β = .21, [.13, .29], p < .001, f 2 = .03 (brackets indicate 95% CI). Discussion Supporting Hypothesis 1, income inequality positively predicted perceived competitiveness. This is consistent with the idea that income inequality increases the salience
Running head: INEQUALITY, COMPETITIVENESS, MOTIVATION
12
of economic stratification, establishing a cognitive picture of one's social environment as being competitive. Study 2 sought to replicate the link between income inequality and perceived competitiveness and extend this association to approach and avoidance motivation. Study 2: Income Inequality, Perceived Competitiveness, and Approach-Avoidance Motivation Method Sample and procedure. The same target sample size and recruitment process (via ResearchMatch) described in Study 1 were used. There was no overlap in participants. Participants. Eight hundred and forty-one participants completed the study. Eighteen were excluded a priori due to missing data. The final sample consisted of 823 U.S. residents (170 men, 648 women, 5 unspecified; Mage = 46.67, SD = 15.18; 707 White/Caucasian, 48 Black/African-American, 23 Latino/a, 13 Asian, 23 “other,” and 9 unspecified; 65.31% working/employed, 14.87% unemployed/not working, 13.21% retired, and 6.61% students). Average annual income was $53,764 (SD = 27,402) and 74.66% of participants had a fouryear college degree or higher. Political self-rating (same scale as in Study 1) was M = 3.10 (SD = 1.68). Again, most participants had been living in their town/city > 1 year (93.07%). Clusters. Participants were nested in 678 ZIP codes. The average number of inhabitants per ZIP code was 30,455 (SD = 16,598), the employment rate was 60.88% (SD = 8.00), the absolute level of poverty was 14.63% (SD = 9.35), and the percent without a high school diploma was 13.26% (SD = 7.77). Variables. Table 1 presents descriptive statistics, reliability estimates, and correlations for the inequality measures and perceived competitiveness. Table 3 presents the same information for the motivation variables, all of which used a seven-point scale (1 = Not true of me, 4 = Moderately true of me, and 7 = Extremely true of me). Income inequality, perceived income inequality, and perceived competitiveness.
Running head: INEQUALITY, COMPETITIVENESS, MOTIVATION
13
Variables were assessed using the same measures as in Study 1. Approach and avoidance economic achievement goals. Elliot et al.’s (2011) 3 x 2 Achievement Goal Questionnaire was adapted. Three items assessed each of the following economic achievement goals: Other-approach (e.g., “To be more economically successful than others in life”), other-avoidance (e.g., To avoid being worse off economically than others in life), self-approach (e.g., To improve my financial situation over time), and self-avoidance (e.g., To avoid the worsening of my financial situation over time). The full set of economic achievement goal items is presented in the Supplementary Materials, Appendix. Need for achievement and fear of failure. Jackson’s (1974) Need for Achievement scale assessed need for achievement (16 items, e.g., “I will not be satisfied until I am the best in my field of work.”), and Thrash and Elliot’s (2003) Fear of Failure Scale assessed fear of failure (nine items, e.g., “I often avoid a task because I am afraid that I will make mistakes.”). Promotion and prevention foci. Lockwood, Jordan, and Kunda’s (2002) General Regulatory Focus measure assessed promotion focus (nine items; e.g., “In general, I am focused on achieving positive outcomes in my life.”) and prevention focus (nine items; e.g., “I frequently think about how I can prevent failures in my life.”). Control variables and MICE. The same ten covariates used in Study 1 were controlled for and MICE was performed to account for missing values on the participantbased covariates. Perceived income inequality, perceived competitiveness, motivation, and moderator (see Footnote 4) items were used to impute the missing data (< 0.1% to 0.3%). Results Preliminary analysis: Actual and perceived inequality. Again, Gini coefficient was positively correlated with perceived inequality, r = .28, p < .001. Replication of Study 1: Income Inequality and perceived competitiveness. As in Study 1, we used multiple imputation-based regression analysis. Perceived competitiveness
Running head: INEQUALITY, COMPETITIVENESS, MOTIVATION
14
was regressed on the Gini coefficient and covariates. Table 2 presents the full results (second column from the left). Replicating Study 1 and further supporting Hypothesis 1, Gini was a positive predictor of perceived competitiveness, β = .21 [.13, .30], p < .001, f 2 = .03. Extension of Study 1: Income inequality, perceived competitiveness, and approach-avoidance motivation. In a second phase, we built three multiple imputationbased SEMs testing the influence of income inequality (predictor variable) via perceived competitiveness (intervening variable) on economic achievement goals (Model 1), achievement motives (Model 2), and self-regulatory foci (Model 3). We continued to control for the effects of the 10 covariates on the intervening and outcomes variables.4 Income inequality → motivation. Table S4 presents the full results. The (nonhypothesized) total effects of the Gini coefficient on the motivational variables did not significantly differ from zero (ps ≥ .270), except for a small positive effect on fear of failure, β = .10 [.01, .18], p = .022, f 2 = .01. Note that when there are theoretical reasons to do so, statisticians recommend ignoring the significance level of the total effects and focusing on indirect effects (for a review, see Rucker, Preacher, Tormala, & Petty, 2011). Perceived competitiveness → motivation. Table 4 presents the full results. Consistent with Hypothesis 2a, perceived competitiveness was a positive predictor of other-approach goals, β = .10 [.03, .17], p = .004, f 2 = .01, need for achievement, β = .11 [.04, .18], p = .001, f 2 = .01, and promotion focus, β = .15 [.09, .22], p < .001, f 2 = .02. Consistent with Hypothesis 2b, perceived competitiveness was a positive predictor of other-avoidance goals, β = .15 [.08, .22], p < .001, f 2 = .02, and prevention focus, β = .15 [.09, .22], p < .001, f 2 = .02, but not fear of failure, β = .01 [-.08, .06], p = .847. Perceived competitiveness also was a positive predictor of self-approach goals, β = .13 [.06, .19], p < .001, f 2 = .02, but not selfavoidance goals, β = .05 [-.02, .12], p = .134. Income inequality → perceived competitiveness → motivation (indirect effects).
Running head: INEQUALITY, COMPETITIVENESS, MOTIVATION
15
Figure 1 presents the path models of interest. Consistent with Hypothesis 3a, the indirect effects of the Gini coefficient through perceived competitiveness were positive for otherapproach goals, β = .02 ]0, .04], p = .012 (left reverse bracket indicates zero is excluded), need for achievement, β = .02 [.01, .04], p = .007, and promotion focus, β = .03 [.01, .05], p < .001.5 Consistent with Hypothesis 3b, the indirect effects were also positive for otheravoidance goals, β = .03 [.01, .05], p = .001, and prevention focus, β = .03 [.01, .05], p = .001. Given that the influence of perceived competitiveness on fear of failure did not differ from zero, the indirect effect was not tested. Moreover, the indirect effect was positive for selfapproach goals, β = .03 [.01, .05], p = .002. Discussion Replicating Study 1, income inequality positively predicted perceived competitiveness (supporting Hypothesis 1). Extending Study 1, perceived competitiveness positively predicted other-approach goals, need for achievement, and promotion focus (supporting Hypothesis 2a), as well as other-avoidance goals and prevention focus (but not fear of failure; thus partially supporting Hypothesis 2b). Moreover, the effects of income inequality were transmitted, via perceived competitiveness, to both approach (supporting Hypothesis 3a) and avoidance (partially supporting Hypothesis 3b) motivational constructs. Two limitations of Study 2 should be noted. First, ResearchMatch does not use representative sampling methods and both Studies 1 and 2 lacked demographic heterogeneity: Most participants were women, and low socio-economic status individuals were underrepresented. Moreover, the null results on fear of failure were not expected; one possibility is that the scale used to assess fear of failure was too broad, failing to capture the specific essence of one’s emotional exposure to potential losses in competitive contexts. To address these limitations, Study 3 tested the full set of hypotheses with Amazon’s Mechanical Turk (MTurk) workers, a more demographically diverse sample than other online samples
Running head: INEQUALITY, COMPETITIVENESS, MOTIVATION
16
(Buhrmester, Kwang, & Gosling, 2011), and used a more specific fear of failure measure grounded in fear of shame and embarrassment (Conroy, Willow, & Metzler, 2002). Study 3: Income Inequality, Perceived Competitiveness, and Approach-Avoidance Motivation: Replication with a more Diverse Sample Method Sample and procedure. The same target sample size described in Study 1 was used for this study. However, MTurk with the TurkPrime's microbatch feature was used for recruitment. This enabled us to open the study to nine new participants every 30 minutes, facilitating the recruitment of individuals across U.S. time zones over the course of several days. Individuals received $0.40 for their participation. Participants. Eight hundred and sixty-four participants completed the study. Fourteen were excluded a priori due to missing data. The final sample was more gender-balanced and diverse (in terms of SES) than Studies 1-2. It comprised 850 U.S. residents (400 men, 445 women, 5 unspecified; Mage 36.30, SD = 12.31; 685 White/Caucasian, 43 Black/AfricanAmerican, 39 Latino/a, 58 Asian, 20 “other,” and 5 unspecified; 72.65% working/employed; 18.55% unemployed/not working; 2.89% retired, and 5.90% students). Average annual income was $37,734 (SD = 26,588) and 54.79% of participants had a four-year degree or higher. Political self-rating (same scale as in Study 1) was M = 3.52 (SD = 1.75). Again, the vast majority of participants had been living in their town/city > 1 year (91.40%). Clusters. Participants were nested in 788 ZIP codes. The average number of inhabitants per ZIP code was 30,168 (SD = 17,986), the employment rate was 58.76% (SD = 8.73), the absolute level of poverty was 15.88% (SD = 9.98), and the percent without a high school diploma was 14.81% (SD = 9.32). Variables. Table 1 presents descriptive statistics, reliability estimates, and correlations for the inequality measures and perceived competitiveness. Table 3 presents the same
Running head: INEQUALITY, COMPETITIVENESS, MOTIVATION
17
information for the motivation variables. All measures were the same as in Studies 1 and 2 with the exception that Conroy et al.’s (2002) Fear of Experiencing Shame and Embarrassment subscale assessed fear of failure (seven items; e.g., “When I am failing, I worry about what others think about me”). The same ten covariates used in Studies 1-2 were controlled for and MICE was performed to account for missing values on participant-based covariates. Specifically, perceived income inequality, perceived competitiveness, and motivation items were used to impute the missing data (< 0.1%). Results Preliminary analysis: Actual and perceived inequality. Gini coefficient was again positively correlated with perceived inequality, r = .29, p < .001. Replication of Studies 1 and 2: Income inequality and perceived competitiveness. As in Studies 1-2, we used multiple imputation-based regression analysis. Perceived competitiveness was regressed on the Gini coefficient and covariates. Table 2 presents the full results (third column from the left). Replicating Studies 1-2 and further supporting Hypothesis 1, Gini predicted perceived competitiveness, β = .20 [.12, .28], p < .001, f 2 = .03. Figure 2 depicts data concerning the Gini coefficient and perceived competitiveness across Studies 1-3. Replication of Study 2: Income inequality, perceived competitiveness and approach-avoidance motivation. In a second phase, we built the same three multiple imputation-based SEMs used in Study 2 to replicate the effects of income inequality via perceived competitiveness on economic achievement goals (Model 1), achievement motives (Model 2), and self-regulatory foci (Model 3). Income inequality → motivation. Table S5 presents the full results. The (nonhypothesized) total effects of the Gini coefficient on the motivational variables did not significantly differ from zero (ps ≥ .265), except for a small negative effect on need for achievement, β = -.09 [-.16, -.01], p = .032, f 2 = .01.
Running head: INEQUALITY, COMPETITIVENESS, MOTIVATION
18
Perceived competitiveness → motivation. Table 5 presents the full results. Consistent with Hypothesis 2a, perceived competitiveness was a positive predictor of other-approach goals, β = .17 [.11, .24], p < .001, f 2 = .03, need for achievement, β = .19 [.13, .26], p < .001, f 2 = .03, and promotion focus, β = .10 [.04, .17], p = .003, f 2 = .01. Consistent with Hypothesis 2b, perceived competitiveness was also a positive predictor of other-avoidance goals, β = .20 [.13, .26], p < .001, f 2 = .04, fear of failure (shame and embarrassment), β = .23 [.16, .29], p < .001, f 2 = .05, and prevention focus, β = .18 [.12, .25], p < .001, f 2 = .03. Perceived competitiveness also was a significant predictor of self-avoidance goals, β = .07 ]0, .14], p = .045, f 2 = .004, but not self-approach goals, β = .05 [-.01, .13], p = .093, f 2 = .02. Income inequality → perceived competitiveness → motivation (indirect effects). Figure 1 presents the path models of interest. Consistent with Hypothesis 3a, the indirect effects of the Gini coefficient through perceived competitiveness were positive for otherapproach goals, β = .03 [.02, .05], p < .001, need for achievement, β = .04 [.02, .05], p < .001, and promotion focus, β = .02 ]0, .04], p = .011. Consistent with Hypothesis 3b, the indirect effects were also positive for other-avoidance goals, β = .04 [.02, .06], p < .001, fear of failure, β = .05 [.02, .07], p < .001, and prevention focus, β = .05 [.02, .08], p < .001. The indirect effect was not significant for self-avoidance goals, β = .01 [0, .03], p = .064. Discussion Replicating Study 2, income inequality again positively predicted perceived competitiveness (supporting Hypothesis 1), which itself positively predicted other-approach goals, need for achievement, and promotion focus (supporting Hypothesis 2a), as well as other-avoidance goals and prevention focus (supporting Hypothesis 2b). As in Study 2, the effects of income inequality were transmitted to these motivational constructs through perceived competitiveness (supporting Hypotheses 3a-3b). In addition, contrary to Study 1, the hypothesized indirect effect of income inequality via perceived competitiveness on fear of
Running head: INEQUALITY, COMPETITIVENESS, MOTIVATION
19
failure (focused on fear of shame and embarrassment) manifested in Study 2 (fully supporting Hypotheses 2b-3b). General Discussion These studies are the first to document a link between income inequality and perceived competitiveness. By its very definition, income inequality implies a higher social distance between income groups, reinforcing the stratification of the economic system (Kawachi et al., 1997). Thus, we predicted that income inequality should “get in people’s heads” in the form of perceived competitiveness. Consistent with Hypothesis 1, Studies 1 to 3 showed that local income inequality positively predicted self-reported perceptions of competitiveness. In our view, this perception that others are competitive is the reason that income inequality pervasively “gets in our head,” fostering social comparison (Cheung & Lucas, 2016), a sense of relative deprivation (Kondo et al., 2008), or even status competition-related anxiety (Delhey & Dragolov, 2014). Another contribution of our work is that it sheds light on the seemingly incompatible motivating and demotivating effects of income inequality observed previously (Paskov et al., 2013). Since perceived competitiveness can promote both the will to win and the will not to lose (Wolters, 2004), we predicted that income inequality should be associated, though perceived competitiveness, with approach and avoidance motivation. Consistent with Hypotheses 2-3, in both Studies 2-3 inequality was positively associated—via perceived competitiveness—with other-approach economic goals, need for achievement, and promotion focus, as well as with other-avoidance economic goals, (shame/embarrassment-based) fear of failure, and prevention focus. These findings suggest that income inequality fuels positional concerns, which then fosters approach and avoidance motivational processes. Perceived competitiveness (and income inequality), however, did not robustly relate to self-based economic goals; as perceived competitiveness activates concerns regarding social comparison
Running head: INEQUALITY, COMPETITIVENESS, MOTIVATION
20
(in reference to others) rather than temporal comparison (in reference to the self), its influence might not systematically extend to goal adoption not focused on normative competence. Importantly, whereas most research on income inequality has used global economic indicators (e.g., nation- or state-based), the above findings were obtained using more specific local economic indicators (ZIP code-based). Using global economic indicators often implies small sample sizes at the highest level (e.g., Wilkinson & Pickett [2010] often only compare a dozen of nations), resulting in low power and increased probability of Type 1 errors. Moreover, using global economic indicators does not enable one to avoid confounding variables (e.g., different historical legacies between nations; Hiilamo & Kangas, 2014). For our part, we were able to compare a large number of ZIP codes (almost 2,000) within one single country (limiting the risk of confounding cultural variables), which strengthens the reliability of the findings observed here. Limitations of the Present Research Two main limitations should be kept in mind when interpreting this research. First, the present research is correlational. Despite income inequality being an ecological, exogenous, and objective economic indicator, we cannot formally establish the causal nature of effects (for a discussion of this topic, see Pickett & Wilkinson, 2015). Moreover, the perceived competitiveness and approach-avoidance motivation variables were self-reported. We argued that perceiving others as competitive in one’s social environment predicts appetitive and aversive competitive motivation (i.e., the tested model), but others could argue that competitive motivations may predict the perception that others are competitive (i.e., reverse causation; see Elliot, Jury, & Murayama, 2017). However, from a theoretical perspective, perceived competitiveness is presumed to activate general competitive concerns which are then regulated by appetitive and aversive competitive motivation, not vice versa (see Murayama & Elliot, 2012). Moreover, experimental evidence supports a causal link between
Running head: INEQUALITY, COMPETITIVENESS, MOTIVATION
21
perceived competitiveness and other-approach and -avoidance goals (e.g., Pekrun, Cusack, Murayama, Elliot, & Thomas 2014; Shin, Leo, & Seo, 2017). That said, we cannot rule out the possibility of a reciprocal dynamic relation: Perceiving others as competitive may trigger appetitive and aversive competitive motivation, which then increases the likelihood that others are perceived as competitive (and so on). Experimentally manipulating the salience of income inequality (Côté, House, & Willer, 2015) and/or of perceived competitiveness (Jackson & Esses, 2000) could provide additional insight regarding the causal relations between our theoretical constructs. Second, samples were not representative of all Americans, which may lead to underestimating or overestimating the population effect. However, in the more diverse sample of Study 3, no demographic groups seemed to be disproportionately represented and the same pattern of findings was observed. Although this demonstrates the robustness of the results, further research using data from nationally representative samples are needed. Relatedly, our studies were conducted on American participants and thus our findings cannot be generalized across nations (Henrich, Heine, & Norenzayan, 2010). In particular, the influence of perceived competitiveness and approach-avoidance motivation may vary as a function of culture (e.g., see Hulleman, Schrager, Bodmann, & Harackiewicz, 2010, respectively) and, more generally, cross-cultural differences may supersede effects of income inequality on perceived competitiveness and motivation (Hiilamo & Kangas, 2014). Future Directions Directional Moderators. In the present research, income inequality did not exert a direct effect on approach or avoidance motivation. However, it is possible that income inequality exerts only a direct effect on approach motivation for a subgroup of the population, and on avoidance motivation for another subgroup of the population. According to the biopsychosocial model of challenge and threat, when individuals perceive that available
Running head: INEQUALITY, COMPETITIVENESS, MOTIVATION
22
resources exceed the demands of a stressor, they experience challenge and are approach motivated; but when they perceive that demands exceed available resources they experience threat and are avoidance motivated (for reviews, see Blascovich, 2013; Jamieson, 2016). In our case, it is conceivable that individuals experiencing financial abundance (i.e., having sufficient financial resources) tend to be challenged by economically unequal and competitive environments, whereas individuals experiencing financial scarcity (i.e., having insufficient financial resources) may be threatened by such environments (see Mullainathan & Shafir, 2014). Thus, for individuals experiencing financial abundance, income inequality could be a direct predictor of approach motivation; conversely, for individuals experiencing financial scarcity, income inequality could be a direct predictor of approach motivation. Other directional moderator candidates, such as the perceived legitimacy/illegitimacy of income inequality (Schneider, 2012), positive/negative attitudes toward competition (Elliot & Hulleman, 2017), or intergenerational income mobility/immobility (Chetty, Hendren, Kline, & Saez, 2014) may also contribute to the challenging/threatening nature of the competitive ethos established by income inequality. Downstream Consequences on Economic Growth. Conflicting views have been espoused regarding the effect of income inequality on economic growth (for a review, see Cingano, 2014). Some have argued that income inequality negatively impacts socio-political stability and reduces incentives to participate in economic activities, thereby hindering growth (Keefer & Knack, 1999). Others have argued that income inequality affects an economy’s demand structure and increases the incentive to work, invest, and innovate, thereby stimulating growth (Forbes, 2000). Furthermore, meta-analytic data on the topic is inconclusive (de Dominicis, Florax, & de Groot, 2008). Given the present results, both positions may be accurate: Income inequality could negatively and positively predict economic growth depending on the motivation that emerges
Running head: INEQUALITY, COMPETITIVENESS, MOTIVATION
23
from perceived competitiveness. For example, other-avoidance goals are associated with threat-related affective, cognitive, and behavioral processes, and—by extension—with worse performance; whereas other-approach goals are associated with challenge-related affective, cognitive, and behavioral processes, and—by extension—with better performance (for a meta-analysis, see Murayama & Elliot, 2012). Thus, income inequality, via perceived competitiveness, may increase net production and promote economic growth if it evokes other-approach goals, but may decrease net production and undermine economic growth to if it evokes other-avoidance goals. Conclusion Income inequality is a “hot topic” in the social sciences. Contrasting theoretical positions have been proposed, with some contending that income inequality has incentive effects and others arguing that it has disincentive effects. From our perspective, neither of these positions is accurate nor inaccurate in and of itself. Our conceptual and empirical work herein suggests that income inequality—via perceived competitiveness—can evoke approach motivation, an adaptive form of motivation (e.g., predicting persistence; Wu, Matthews, & Dagher, 2007). However, our work also shows that income inequality—via perceived competitiveness—can evoke avoidance motivation that, over time, tends to eventuate in various forms of demotivation (e.g., predicting disengagement, Roskes, Elliot, Nijstad, & De Dreu, 2013). Thus, rather than debating whether a motivating or demotivating position is correct, we advocate for a more nuanced position open to the likelihood that income inequality can have both positive and negative implications for motivation. The present research lays the conceptual foundation for such an integrative position, and we hope that it will inspire further empirical work aimed at documenting the implications of income inequality for individuals and societies.
Running head: INEQUALITY, COMPETITIVENESS, MOTIVATION
24
References Atkinson, J. W. (1964). An introduction to motivation. New York, NY: Van Nostrand. Bastiat, F. (1860/1850). Harmonies of Political Economy. London, UK: John Murray. Bell, L. A., & Freeman, R. B. (2001). The incentive for working hard: explaining hours worked differences in the US and Germany. Labour Economics, 8, 181-202. Birney, R. C., Burdick, H., & Teevan, R. C. (1969). Fear of failure. New York, NY: Van Nostrand. Blascovich, J. (2013). Challenge and threat. In A. J. Elliot (Ed.), Handbook of approach and avoidance motivation (pp. 431–446). New York, NY: Psychology Press. Bowles, S., & Park, Y. (2005). Emulation, Inequality, and Work Hours Was Thorsten Veblen Right. The Economic Journal, 115, F397-F412. Buhrmester, M., Kwang, T., & Gosling, S. D. (2011). Amazon’s Mechanical Turk a new source of inexpensive, yet high-quality, data?. Perspectives on Psychological Science, 6, 3-5. Buttrick, & Oishi, S. (2017). The psychological consequences of income inequality. Social and Personality Psychology Compass, 11, 1-12 Chetty, R., Hendren, N., Kline, P., & Saez, E. (2014). Where is the land of Opportunity? The Geography of Intergenerational Mobility in the United States. The Quarterly Journal of Economics, 129, 1553-1623. Cheung, F. (2016). Can Income Inequality be Associated With Positive Outcomes? Hope Mediates the Positive Inequality–Happiness Link in Rural China. Social Psychological and Personality Science, 7, 320-330. Cheung, F., & Lucas, R. E. (2016). Income inequality is associated with stronger social comparison effects: The effect of relative income on life satisfaction. Journal of Personality and Social Psychology, 110, 332-341. Cheung, M. W. (2007). Comparison of approaches to constructing confidence intervals for
Running head: INEQUALITY, COMPETITIVENESS, MOTIVATION
25
mediating effects using structural equation models. Structural Equation Modeling: A Multidisciplinary Journal, 14, 227-246. Cingano, F. (2014). Trends in Income Inequality and its Impact on Economic Growth (OECD Social, Employment and Migration Working Papers, No. 163). Paris, France: OECD Publishing. Retrived from https://bit.ly/1wIvGLF Conroy, D. E., Willow, J. P., & Metzler, J. N. (2002). Multidimensional fear of failure measurement: The performance failure appraisal inventory. Journal of Applied Sport Psychology, 14, 76-90. Côté, S., House, J., & Willer, R. (2015). High economic inequality leads higher-income individuals to be less generous. Proceedings of the National Academy of Sciences, 112, 15838-15843. Dawes, C. T., Fowler, J. H., Johnson, T., McElreath, R., & Smirnov, O. (2007). Egalitarian motives in humans. Nature, 446, 794-796. de Dominicis, L., Florax, R. J., & de Groot, H. L. (2008). A Meta-Analysis On The Relationship Between Income Inequality And Economic Growth. Scottish Journal of Political Economy, 55, 654-682. Delhey, J., & Dragolov, G. (2014). Why inequality makes Europeans less happy: The role of distrust, status anxiety, and perceived conflict. European Sociological Review, 30, 151165. Dweck, C. S. (1986). Motivational processes affecting learning. American Psychologist, 41, 1040. Elliot, A. J. (2006). The hierarchical model of approach-avoidance motivation. Motivation and Emotion, 30, 111-116. Elliot, A. J., Jury, M., & Murayama, K. (2017). Trait and Perceived Environmental Competitiveness in Achievement Situations. Journal of Personality. Advance online
Running head: INEQUALITY, COMPETITIVENESS, MOTIVATION
26
publication. DOI: 10.1111/jopy.12320 Elliot, A. J., & Hulleman, C. S. (2017). Achievement goals. In A. Elliot, C. Dweck, & D. Yeager (Eds.), Handbook of competence and motivation, second edition: Theory and application (pp. 43-60). New York, NY: Guilford Press. Elliot, A. J., Murayama, K., & Pekrun, R. (2011). A 3 × 2 achievement goal model. Journal of Educational Psychology, 103, 632-648. Forbes, K. J. (2000). A reassessment of the relationship between inequality and growth. American Economic Review, 90, 869-887. Friedman, M., & Friedman, R. (1990). Free to choose: A personal statement. Harmondsworth, UK: Penguin Books. Godoy, R. A., Reyes-García, V., McDade, T., Huanca, T., Leonard, W. R., Tanner, S., & Vadez, V. (2006). Does village inequality in modern income harm the psyche? Anger, fear, sadness, and alcohol consumption in a pre-industrial society. Social Science & Medicine, 63, 359–372. Hangen, E. J., Elliot, A. J., & Jamieson, J. P. (2016). The opposing processes model of competition: Elucidating the effects of competition on risk-taking. Motivation Science, 2, 157 -170. Henrich, J., Heine, S. J., & Norenzayan, A. (2010). The weirdest people in the world?. Behavioral and Brain Sciences, 33, 61-83. Higgins, E. T. (1997). Beyond pleasure and pain. American Psychologist, 52, 1280-1300. Hiilamo, H., & Kangas, O. (2014). Cherry picking: How sensitive is the relationship between inequality and social problems to country samples?. International Journal of Sociology and Social Policy, 34, 771-792. Hulleman, C. S., Schrager, S. M., Bodmann, S. M., & Harackiewicz, J. M. (2010). A metaanalytic review of achievement goal measures: Different labels for the same constructs or
Running head: INEQUALITY, COMPETITIVENESS, MOTIVATION
27
different constructs with similar labels?. Psychological Bulletin, 136, 422-449. Jackson, D. N. (1974). Personality Research Form Manual. Goshen, NY: Research Psychologists Press. Jackson, L. M., & Esses, V. M. (2000). Effects of perceived economic competition on people’s willingness to help empower immigrants. Group Processes & Intergroup Relations, 3, 419-435. Jamieson, J. P. (2016). Challenge and threat appraisals. In A. Elliot, C. Dweck, & D. Yeager (Eds), Handbook of Competence and Motivation (2nd Edition): Theory and Application. New York, NY: Guilford Press. In press. Johnson, D. W., & Johnson, R. T. (1974). Instructional goal structure: Cooperative, competitive, or individualistic. Review of Educational Research, 44, 213-240. Johnston, C. D., & Newman, B. J. (2016). Economic inequality and US public policy mood across space and time. American Politics Research, 44, 164-191. Kawachi, I., Kennedy, B. P., Lochner, K., & Prothrow-Stith, D. (1997). Social capital, income inequality, and mortality. American Journal of Public Health, 87, 1491-1498. Kawachi, I., & Subramanian, S.V. (2014). Income inequality. In: L. F. Berkman, I. Kawachi, & M. M. Glymour (Eds.), Social Epidemiology (pp. 126-152). New York , NY: Oxford University Press. Keefer, P., & Knack, S. (2002). Polarization, politics and property rights: Links between inequality and growth. Public Choice, 111, 127-154. Knack, S., & Keefer, P. (1997). Does social capital have an economic payoff? A crosscountry investigation. The Quarterly Journal of Economics, 112, 1251-1288. Kondo, N., Kawachi, I., Subramanian, S. V., Takeda, Y., & Yamagata, Z. (2008). Do social comparisons explain the association between income inequality and health?: Relative deprivation and perceived health among male and female Japanese individuals. Social
Running head: INEQUALITY, COMPETITIVENESS, MOTIVATION
28
Science & Medicine, 67, 982-987. Layte, R. (2011). The Association between Income Inequality and Mental Health: Testing Status Anxiety, Social Capital, and Neo-Materialist Explanations. European Sociological Review, 28, 498-511. Layte, R., & Whelan, C. T. (2014). Who feels inferior? A test of the status anxiety hypothesis of social inequalities in health. European Sociological Review, 30, 525-535. Lockwood, P., Jordan, C. H., & Kunda, Z. (2002). Motivation by positive or negative role models: regulatory focus determines who will best inspire us. Journal of Personality and Social Psychology, 83, 854-864. Loughnan, S., Kuppens, P., Allik, J., Balazs, K., De Lemus, S., Dumont, K., ... & Park, J. (2011). Economic inequality is linked to biased self-perception. Psychological Science, 22, 1254-1258. McClelland, D. C. (1985). Human motivation. Glenview, IL: Scott, Foresman. McNeill, J. R. 2001. Something new under the sun: An environmental history of the Twentieth-century world. New York, NY: Norton. Mullainathan, S., & Shafir, E. (2014). Scarcity: The New Science of Having Less and How It Defines Our Lives. New York, NY: Picador. Muthen, B. & Satorra, A., (1995). Complex sample data in structural equation modeling. Sociological Methodology, 25, 267-316. Murayama, K., & Elliot, A. J. (2012). The competition-performance relation: A meta-analytic review and test of the opposing processes model of competition and performance. Psychological Bulletin, 138, 1035-1070. Osborne, D., Sibley, C. G., & Sengupta, N. K. (2015). Income and neighbourhood‐level inequality predict self‐esteem and ethnic identity centrality through individual‐and group‐ based relative deprivation: A multilevel path analysis. European Journal of Social
Running head: INEQUALITY, COMPETITIVENESS, MOTIVATION
29
Psychology, 45, 368-377. Paskov, M., Gërxhani, K., & Van de Werfhorst, H. G. (2013). Income Inequality and Status Anxiety (GINI Discussion Paper No 90). Amsterdam, Netherland: The Amsterdam Institute for Advanced Labor Studies (AIAS). Retrieved from https://bit.ly/2rni9vB Payne, B. K., Brown-Iannuzzi, J. L., & Hannay, J. W. (2017). Economic inequality increases risk taking. Proceedings of the National Academy of Sciences, 114, 4643-4648. Pekrun, R., Cusack, A., Murayama, K., Elliot, A. J., & Thomas, K. (2014). The power of anticipated feedback: Effects on students' achievement goals and achievement emotions. Learning and Instruction, 29, 115-124. Pickett, K. E., & Wilkinson, R. G. (2015). Income inequality and health: a causal review. Social Science & Medicine, 128, 316-326. Piketty, T., Saez, E., & Zucman, G. (2015, July). Distributional national accounts: Methods and estimates for the united states since 1913. Paper presented at the NBER Conference on Research in Income and Wealth (CRIW). Retrieved from https://bit.ly/2ns1445 Preacher, K. J., & Kelley, K. (2011). Effect size measures for mediation models: quantitative strategies for communicating indirect effects. Psychological Methods, 16, 93-115. Roskes, M., Elliot, A. J., Nijstad, B. A., & De Dreu, C. K. (2013). Avoidance motivation and conservation of energy. Emotion Review, 5, 264-268. Rucker, D. D., Preacher, K. J., Tormala, Z. L., & Petty, R. E. (2011). Mediation analysis in social psychology: Current practices and new recommendations. Social and Personality Psychology Compass, 5, 359-371. Schneider, S. M. (2012). Income inequality and its consequences for life satisfaction: what role do social cognitions play?. Social Indicators Research, 106, 419-438. Shin, J., Lee, Y. K., & Seo, E. (2017). The effects of feedback on students' achievement goals: Interaction between reference of comparison and regulatory focus. Learning and
Running head: INEQUALITY, COMPETITIVENESS, MOTIVATION
30
Instruction, 49, 21-31. Ten Velden, F. S., Beersma, B., & De Dreu, C. K. (2009). Goal expectations meet regulatory focus: How appetitive and aversive competition influence negotiation. Social Cognition, 27, 437-454. Thrash, T. M. & Elliot, A. J. (2003). Inspiration as a psychological construct. Journal of Personality and Social Psychology, 84, 871–889. Urdan, T., & Schoenfelder, E. (2006). Classroom effects on student motivation: Goal structures, social relationships, and competence beliefs. Journal of School Psychology, 44, 331-349. Wolters, C. A. (2004). Advancing achievement goal theory: Using goal structures and goal orientations to predict students’ motivation, cognition, and achievement. Journal of Educational Psychology, 96, 236-250. Walasek, L., & Brown, G. D. (2015). Income Inequality and Status Seeking Searching for Positional Goods in Unequal US States. Psychological Science, 26, 527-533. Wilkinson, R. G. (1999). Health, hierarchy, and social anxiety. Annals of the New York Academy of Sciences, 896, 48-63. Wilkinson, R. G., & Pickett, K. E. (2006). Income inequality and population health: A review and explanation of the evidence. Social Science & Medicine, 62, 1768-1784. Wu, S., Matthews, & Dagher, G. K. (2007). Need for achievement, business goals, and entrepreneurial persistence. Management Research News, 30, 928-941. Zhao, W. (2012). Economic inequality, status perceptions, and subjective well-being in China's transitional economy. Research in Social Stratification and Mobility, 30, 433-450.
Running head: INEQUALITY, COMPETITIVENESS, MOTIVATION
31
Declaration of Conflicting Interests. The author(s) declared no potential conflicts of interest with respect to the research, authorship, and/or publication of this article. Funding. This research was supported by a postdoctoral UNIL/CHUV fellowship (University of Lausanne, Switzerland) awarded to the first author.
Running head: INEQUALITY, COMPETITIVENESS, MOTIVATION
32
Footnotes 1
This information is based on the 2010-2014 American Community Survey estimates.
The most equal ZIP codes correspond to those below the 5th percentile and the most unequal ZIP codes to those above the 95th percentile. 2
In Studies 1-3, the average number of inhabitants from the sampled ZIP codes was
higher than the average number from the general population. This is simply due to the fact that participants living in more (vs. less) populated clusters were more likely to be sampled. 3
In Studies 1-3, the number of participants per ZIP code was so small (nS1 = 1.23, nS2 =
1.21, nS3 = 1.08) that the incidence of clustering on estimates was deemed negligible. As a matter of fact, for each study, the design effect (DEFF) was well below the threshold of two, DEFFS1 = 1.04 [1.01, 1.08], DEFFS2 = 1.07 [1.04, 1.11], and DEFFS3 = 1.01 [1.00, 1.04]. This indicates that one- and two-level regressions are not expected to produce different results (Muthen & Satorra, 1995). Indeed, when multilevel analyses were used, the relations between income inequality and perceived competitiveness remained essentially the same, β S1 = .21, 95% CI [.13, .29], βS2 = .22, 95% CI [.13, .30], and βS3 = .20, 95% CI [.12, .28], ps < .001. 4
Because low- and high-income earners might differ in terms of resources to cope with
competition, we tested whether income moderated associations between perceived competitiveness and approach-avoidance motivation. Other moderator candidates were explored in Study 2. Results were inconclusive and are presented in Supplementary Materials. 5
The estimation of Cohen’s f 2 is not possible for indirect paths. However, standardized
coefficients of the indirect paths can be interpreted as effect sizes (Preacher & Kelley, 2011). For direct paths, β = .14, .36, and .51 are considered small, medium, and large effect sizes, respectively. Since indirect paths are the product of two coefficients, these values can be squared: β = .02 (i.e., .142), .13 (i.e., .362), and .26 (i.e., .512) are considered small, medium, and large indirect effect sizes, respectively (for similar reasoning, see Cheung, 2007).
Running head: INEQUALITY, COMPETITIVENESS, MOTIVATION
33
Table 1. Descriptive statistics, reliability estimates, and correlations for Gini coefficient, perceived inequality, and perceived competitiveness. Studies 1-3.
Study 1
Descriptive statistics
α
Pairwise intercorrelations
M
SD
(1)
Gini coefficient (1)
n/a .44
.06
–
Perceived inequality (2)
.92 5.16 1.52 .19***
Perceived competitiveness (3)
.92 3.75 1.55
Notes: ***p < .001.
Study 2
(2)
(3)
–
.19*** .32***
–
Descriptive statistics
Study 3
Pairwise intercorrelations
α
M
SD
(1)
n/a
.44
.06
–
(2)
–
.92
5.23 1.46 .28***
.90
4.13 1.42 .14*** .36***
(3)
Descriptive statistics
Pairwise intercorrelations
α
M
SD
(1)
n/a
.44
.06
–
.93
4.54 1.54 .29***
.93
3.78 1.53 .20*** .42***
(2)
(3)
–
–
Running head: INEQUALITY, COMPETITIVENESS, MOTIVATION
34
Table 2. Coefficient estimates and effect sizes of the models testing the effects of income inequality (ZIP code-based Gini coefficient) on perceived competitiveness. Studies 1-3. Study 1
Gini coefficient
ZIP-based covariates
Participant-based covariates
Sex (men vs. women) Age
Study 2
Study 3
β
f2
β
f2
β
f2
.21***
.03
.21***
.03
.20***
.03
-.02
–
.07*
.01
.02
–
-.11**
.01
-.10**
.01
-.06
–
*
Ethnicity (Whites vs. others)
.08
.01
.04
–
-.03
–
Status (workers vs. others)
-.05
–
.01
–
-.08*
.01
Income
-.08*
.01
-.09*
.01
-.08*
.01
Education (grad. vs. others)
.02
–
-.06
–
.04
–
Population
.05
–
.09**
.01
.10**
.01
Employment percentage
.10*
.01
.12**
.01
.13**
.01
Poverty rate
.00
–
-.11*
.01
.01
–
Education level
.05
–
.03
–
-.01
–
Notes: “Men vs. women” means that men were coded “+0.5” and women “-0.5” (the same goes for White vs. others, and so on); “grad.” means graduated from college; the paths of primary interest are framed; ***p < .001, **p < .01, *p < .05.
Running head: INEQUALITY, COMPETITIVENESS, MOTIVATION
35
Table 3. Descriptive statistics, reliability estimates, and correlations for the dependent variables. Studies 2-3. Descriptive statistics Study 2
Intercorrelations Study 2 (below the diagonal) and Study 3 (above the diagonal)
Study 3
α
M
SD
α
M
SD
(1)
Other-approach goals (1)
.92
3.43
1.70
.88
4.03
1.68
–
Other-avoidance goals (2)
.95
3.82
1.83
.93
4.15
1.77
.59***
Self-approach goals (3)
.87
5.40
1.36
.93
5.75
1.16
.44*** .28***
Self-avoidance goals (4)
.87
5.18
1.59
.95
5.13
1.65
Need for achievement (5)
.78
3.69
0.48
.85
3.86
0.59
Fear of failure (6)
.88
2.45
1.02
.93
4.17
1.54
Promotion focus (7)
.88
5.06
1.10
.93
5.09
Prevention focus (8)
.83
3.58
1.15
.92
3.87
Notes: ***p < .001, **p < .01, *p < .05.
(2)
(3)
.53*** .36*** –
(4) .09**
(5)
(6)
(7)
.29*** .22*** .39***
(8) .11**
.22*** .54*** .17*** .31*** .14*** .42*** –
.33***
.05
.24*** .48*** .10***
.16*** .44*** .38***
–
.06
.31***
.23*** .16*** .18***
.07*
–
-.10**
.10**
.11**
1.24
.31*** .12*** .46***
.10**
.23*** -.31***
1.37
.23*** .32*** .25*** .33*** .23*** .52***
.01
.09**
-.04
.50***
.23*** .19*** .24*** –
.11*** .59*** –
-.10**
.08**
–
Running head: INEQUALITY, COMPETITIVENESS, MOTIVATION
36
Table 4. Coefficient estimates and effect sizes of the multiple imputation-based SEMs testing the effects of perceived competitiveness on economic achievement goals (Model 1), achievement motives (Model 2), and self-regulatory foci (Model 3). Study 2. Model 1. Economic ach. goals
Model 2. Ach. motives
OtherOtherSelfSelfNeed for approach goals avoidance goals approach goals avoidance goals achievement β
ZIP-based covariates
Participant-based covariates
Sex (men vs. women) Age
Promotion focus
Prevention focus
f2
β
f2
β
f2
β
f2
β
f2
β
f2
β
f2
β
f2
.01
.15***
.02
.13***
.02
.05
–
.11**
.01
-.01
–
.15***
.02
.15***
.02
-.04
–
-.08
–
-.02
–
-.01
–
.01
–
.10*
.01
-.02
–
-.03
–
.03
–
.00
–
.01
–
-.05
–
.19
***
.04
-.04
–
.02
–
.01
–
-.20***
.03
-.10*
.01
-.29***
.07
-.04
–
-.16***
.02
-.18***
.03
-.22***
.04
-.25***
.05
.01
.06
–
.09**
.01
.01
–
.08*
.01
-.02
–
.12**
.01
.06
–
.03
-.07
–
.12
**
***
.01
-.01
–
.02
–
Perceived competitiveness .10** Gini coefficient
Fear of failure
Model 3. Regulatory foci
Ethnicity (Whites vs. others) .10** Status (workers vs. others)
.05
–
.04
–
Income
.08
–
.08*
.00
.03
–
-.01
–
-.01
–
-.08*
.01
.03
–
-.02
–
Education (grad. vs. others)
.04
–
.12**
.01
.04
–
.14***
.02
.05
–
.04
–
-.06
–
.14***
.02
Population
-.01
–
-.03
–
.05
–
-.01
–
-.01
–
-.05
–
.00
–
-.07*
< .01
Employment percentage
-.01
–
-.05
–
-.06
–
-.06
–
.02
–
.10
*
.01
.02
–
Poverty rate
-.03
–
.00
–
-.01
–
-.04
–
-.06
–
Education level
-.03
–
-.01
–
.02
–
.05
–
.05
–
Covariance
-.17
***
Between goals: covs ∈ (0.15, 0.54), ps < .001
.01
.13
*
.01
-.08
-.05
–
-.02
–
.01
–
.00
–
-.05
–
-.03
–
Between motives: 0.07*
Between foci: -0.01
Notes: “Men vs. women” means that men were coded “+0.5” and women “-0.5” (the same goes for White vs. others, and so on); “ach.” means achievement; the paths of primary interest are framed and are graphically presented in Figure 1; ***p < .001, **p < .01, *p < .05.
Running head: INEQUALITY, COMPETITIVENESS, MOTIVATION
37
Table 5. Coefficient estimates and effect sizes of the multiple imputation-based SEMs testing the effects of perceived competitiveness on economic achievement goals (Model 1), achievement motives (Model 2), and self-regulatory foci (Model 3). Study 3. Model 1. Economic ach. goals
Model 2. Ach. motives
OtherOtherSelfSelfNeed for approach goals avoidance goals approach goals avoidance goals achievement β
ZIP-based covariates
Participant-based covariates
Perceived competitiveness .17***
Fear of failure
Model 3. Regulatory foci Promotion focus
Prevention focus
f2
β
f2
β
f2
β
f2
β
f2
β
f2
β
f2
β
f2
.03
.20***
.04
.06
–
.07*
0
.19***
.04
.23***
.05
.10**
.01
.18***
.03
Sex (men vs. women)
-.04
–
-.06
–
-.04
–
-.06
–
-.12**
.01
-.03
–
-.05
–
-.02
–
Age
.07*
.01
-.01
–
-.09**
.01
-.11**
.01
.13***
.02
-.04
–
-.12**
.01
-.01
–
.02
-.05
–
Ethnicity (Whites vs. others) -.25
***
.06
-.14
***
.02
-.14
***
-.28
***
.08
-.24
***
.06
-.16
***
.02
-.15
***
.02
Status (workers vs. others)
.05
–
.02
–
.02
–
-.03
–
.06
–
-.04
–
.09*
.01
.01
–
Income
.00
–
.02
–
-.04
–
.00
–
.05
–
.03
–
-.07*
.01
.06
–
.01
.03
–
-.04
–
-.06
–
.03
–
-.06
–
.08
*
**
Education (grad. vs. others)
.11
Population
-.01
–
.12**
.01
-.02
–
.17***
.03
.02
–
-.01
–
-.06
–
.06
–
Employment percentage
.02
–
-.01
–
-.06
–
-.02
–
.07*
.01
.04
–
-.02
–
.01
–
Poverty rate
-.04
–
.02
–
.05
–
.04
–
-.06
–
-.03
–
.00
–
.01
–
Education level
-.03
–
.01
–
-.03
–
.03
–
-.03
–
-.01
–
.02
–
-.04
–
Covariance
Between goals: covs ∈ (0.09, 0.50), ps ≤ .007
Between motives: 0.11***
.01
-.13
***
.02
Between foci: 0.12***
Notes: “Men vs. women” means that men were coded “+0.5” and women “-0.5” (the same goes for White vs. others, and so on); “ach.” means achievement; the paths of primary interest are framed and are graphically presented in Figure 3; ***p < .001, **p < .01, *p < .05.
Running head: INEQUALITY, COMPETITIVENESS, MOTIVATION
38
Figure 1. Studies 2 and 3: Multiple imputation-based structural equation models testing the effects of income inequality (ZIP code-based Gini coefficient) via perceived competitiveness on economic achievement goals (Model 1), achievement motives (Model 2), and selfregulatory foci (Model 3). Standardized coefficients are given above the arrows / lines for Study 2 and below the arrows / lines for Study 3; βind corresponds to the estimate of the indirect effect; total effects, control variables, and covariance parameters are not represented; n/a means that the indirect effect is not calculated because the competitiveness-to-motivation path is non-significant; ***p < .001, **p < .01, *p < .05.
Running head: INEQUALITY, COMPETITIVENESS, MOTIVATION
◇
39
Low (first tertile); ◆ Intermediate (second tertile) ◆ High (third tertile)
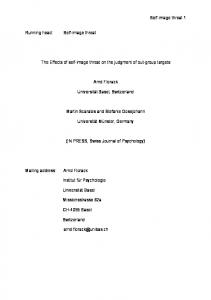
Figure 2. Latitude and longitudinal positions of the N = 2,543 U.S residents (inferred from the K = 1,904 ZIP codes). Income inequality is presented in the left panel (darker dots mean higher ZIP code-based Gini coefficients) and perceived competitiveness is presented in the right panel (darker dots mean higher self-reported perceptions). Darker dots tend to be located in Southwestern and Midwestern United States, and around major urban centers. Data nested in the same geographic coordinates were averaged. Quantile classification method was used: We classified data into three categories (i.e., low, intermediate, and high), each containing an equal number of ZIP codes; the maps were built using QGIS and the same settings were used for both maps.
Running head: INEQUALITY, COMPETITIVENESS, MOTIVATION 1 2 3 4 5 6
Supplementary Materials for
7
Income Inequality, Perceived Competitiveness, and Approach-Avoidance Motivation
40
Running head: INEQUALITY, COMPETITIVENESS, MOTIVATION
1 2
41
Level of Geographic Aggregation of Income Inequality (Studies 1-3) As individuals usually compare their economic situation with geographically close
3
others, more local inequality may be more predictive of competitiveness (for similar
4
reasoning, see Johnston & Newman, 2016). However, as social comparisons often occur at a
5
broader level due to residential segregation (residents of poor areas focusing on the income
6
gap with richer areas), more global inequality may be more predictive of competitiveness (for
7
similar reasoning, see Chiavegatto Filho, Kawachi, Wang, Viana, & Andrade, 2013). To
8
address this issue, we compared the predictive strength of ZIP code-based (lower level) and
9
urban area-based (higher level) Gini coefficients when predicting perceived competitiveness.
10 11
Urban Area Participants were nested in KURBAN = 186 urban areas (formally known as metropolitan
12
and micropolitan statistical areas) in Study 1, KURBAN = 187 in Study 2, and KURBAN = 259 in
13
Study 3. A few participants residing outside of an urban area could not be assigned a cluster:
14
22 (2.53%) in Study 1, 15 (1.82%) in Study 2, and 29 (3.41%) in Study 3.
15
Actual and Perceived Inequality Correlations
16
Urban area-based Gini coefficients were gathered using the 2010-2014 ACS estimates.
17
Table S1 presents descriptive statistics and intercorrelations between Gini coefficients,
18
perceived income inequality, and perceived competitiveness. Steiger’s (1980) tests revealed
19
that the correlations between actual and perceived inequality were stronger at the ZIP code-
20
level than at the urban area-level in Studies 1-3, Zs ≥ 2.62, ps ≤ .009. This suggests that
21
income inequality is more accurately perceived at the local level.
22
Main analysis: Income Inequality and Perceived Competitiveness
23
We built three multiple imputation-based regression models1 using perceived
24
competitiveness as the outcome variable: The ZIP code model used the ZIP code-based Gini
Running head: INEQUALITY, COMPETITIVENESS, MOTIVATION 1
coefficient as the focal predictor (as in the main text), the urban model used the urban area-
2
based Gini coefficient, and the composite model used both Gini coefficients. The same ten
3
control variables were used. Urban area-based covariates were used in the urban model and
4
ZIP code-based covariates in the composite model.2
5
42
Income inequality and perceived competitiveness. Table S2 presents the full results.
6
In the urban model, the effect of the Gini coefficient was positive in Study 2, β = .12 [.02,
7
.23], p = .023, f 2 = .01, but non-significant in Study 1, β = .03 [-.06, .12], p = .525, and Study
8
3, β = .09 [-.01, .19], p = .077, f 2 < .01. In the composite model, while the effect of the ZIP
9
code-based Gini coefficient remained positive, the effect of the urban area-based Gini
10
coefficient was non-significant in Studies 1-3, ps ≥ .137. Post-estimation analyses revealed
11
that the effect of the Gini coefficient was stronger at the ZIP code-level for Studies 1-2, Fs ≥
12
5.80, ps ≤ .016, whereas it was less clear for Study 3, F = 3.61, p = .058. This suggests that
13
the predictive utility of income inequality was generally higher at the local level.
14
Moderators of the Effect of Income Inequality (Studies 2-3)
15
When facing a stressor, perceiving that one’s resources are sufficient to address the
16
situational demands prompts approach motivation, whereas perceiving that one’s resources
17
are insufficient prompts avoidance motivation (Jamieson, 2016; see also Van Deurzen, Van
18
Ingen, & Van Oorschot, 2015). In Studies 2-3, we tested whether individual income (i.e.,
19
resources) moderated the relation between perceived competitiveness and approach-avoidance
20
motivation (for a similar approach with happiness, see Oishi, Kesebir, & Diener, 2011). Three
21
other potential moderators were included in Study 2.
22
Moderators (Study 2)
23
Subjective income status. Singh-Manoux, Adler, and Marmot’s (2003) single-item
24
Measure of Subjective Status was used to assess subjective income status. Participants were
Running head: INEQUALITY, COMPETITIVENESS, MOTIVATION 1
asked to place themselves on a continuum representing 100 people living in their area (1 =
2
lowest income, 100 = highest income; M = 49.53, SD = 22.64).
43
3
Perceived economic mobility. Wong and Yoon’s (2014) 8-item Perceived Economic
4
Mobility scale was used (e.g., “In my city/town, everyone has a fair chance at moving up the
5
economic ladder”; 1 = Not at all, 7 = Completely; α = .90, M = 4.04, SD = 0.88).3
6
Cognitive appraisal. Jamieson, Nock, and Mendes’s (2012) Resource/Demand
7
Appraisal Questionnaire was adapted. Two items assessed inequality-related demands (e.g.,
8
“In my city/town, dealing with economic inequalities is very demanding”; 1 = Not at all, 7 =
9
Completely; α = .77, M = 4.52, SD = 1.53) and two assessed resources (e.g., “In my city/town,
10
economic inequalities will take a lot of effort to overcome”; α = .74, M = 4.43, SD = 1.32).
11
We subtracted the former score from the latter.
12
Moderators of the Effects of Income Inequality (Studies 2-3)
13
For each moderator, we included the moderator in the three SEMs. In Studies 2-3,
14
individual income did not moderate the relation between perceived competitiveness and
15
approach (ps ≥ .197) or avoidance (ps ≥.364) motivation. Exceptions were promotion focus in
16
Study 2, β = .23 [.01, .46], p = .040, f 2 = .01, and self-avoidance goals in Study 3, β = -.07 [-
17
.13, .0[, p = .036, f 2 = .01.
18
In Study 2, subjective income status, perceived economic mobility, and cognitive
19
appraisal did not moderate the relation between perceived competitiveness and approach (ps ≥
20
.182) or avoidance (ps ≥ .053) motivation. The only two exceptions were subjective income
21
status and promotion focus, β = .25 [.05, .44], p = .015, f 2 = .01, and cognitive appraisal and
22
prevention focus, β = -.19, [-.36, -.01], p = .039, f 2 = .01 . Only four out of 32 interactions
23
were significant, and the results were not consistent. Hence, the present findings suggest that
24
the relations between perceived competitiveness and approach-avoidance do not depend on
25
the studied moderators.
Running head: INEQUALITY, COMPETITIVENESS, MOTIVATION 1
44
References
2
Chiavegatto Filho, A. D. P., Kawachi, I., Wang, Y. P., Viana, M. C., & Andrade, L. H. S. G.
3
(2013). Does income inequality get under the skin? A multilevel analysis of depression,
4
anxiety and mental disorders in Sao Paulo, Brazil. Journal of Epidemiology and
5
Community Health, 67, 966-72.
6
Jamieson, J. P. (2016). Challenge and threat appraisals. In A. Elliot, C. Dweck, & D. Yeager
7
(Eds), Handbook of Competence and Motivation (2nd Edition): Theory and Application.
8
New York, NY: Guilford Press. In press.
9
Jamieson, J. P., Nock, M. K., & Mendes, W. B. (2012). Mind over matter: reappraising
10
arousal improves cardiovascular and cognitive responses to stress. Journal of Experimental
11
Psychology: General, 141, 417.
12 13 14
Oishi, S., Kesebir, S., & Diener, E. (2011). Income inequality and happiness. Psychological Science, 22, 1095-1100. Singh-Manoux, A., Adler, N. E., & Marmot, M. G. (2003). Subjective social status: its
15
determinants and its association with measures of ill-health in the Whitehall II study.
16
Social Science & Medicine, 56, 1321-1333.
17 18 19
Steiger, J. H. (1980). Tests for comparing elements of a correlation matrix. Psychological Bulletin, 87, 245-251. Van Deurzen, I., Van Ingen, E., & Van Oorschot, W. J. (2015). Income inequality and
20
depression: the role of social comparisons and coping resources. European Sociological
21
Review, 31, 477-489.
22
Yoon, S., & Wong, N. (2014). Perceived economic mobility: Measurement, validity, and
23
implication for consumer wellbeing and materialism. Advances in Consumer Research, 42.
24
750 751.
25
Running head: INEQUALITY, COMPETITIVENESS, MOTIVATION 1 2 3
45
Footnotes 1
The design effects were below the threshold of two for the three studies, DEFFs ≤
1.76, and standard regression analysis was used.
4
2
The same conclusions would be reached using the urban-area-based covariates.
5
3
We also created a three-item scale measuring perceived equality of opportunity.
6
However, a principal component analysis revealed that its items and those from the Perceived
7
Economic Mobility scale loaded on the same component. The results were the same across the
8
two scales.
Running head: INEQUALITY, COMPETITIVENESS, MOTIVATION
46
1
Table S1.
2
Descriptive statistics and correlations for the Gini coefficients, perceived inequality, and perceived competitiveness. Studies 1-3.
Study 1
Descriptive statistics
3 4
Study 2
Pairwise intercorrelations
M
SD
(1)
ZIP code Gini coefficient (1)
.44
.06
–
Urban area Gini coefficient (2)
.45
.03 .29***
Perceived inequality (3)
5.16 1.52 .19*** .09*
Perceived competitiveness (4)
3.75 1.55 .19*** .09** .32***
Notes: ***p < .001, **p < .01, *p < .05.
(2)
(3)
Descriptive statistics
(4)
–
–
Pairwise intercorrelations
M
SD
(1)
.44
.06
–
.45
.03 .32***
(2)
(3)
Descriptive statistics
(4)
–
5.23 1.46 .28*** .16***
–
Study 3
–
4.13 1.42 .14*** .07 .36***
Pairwise intercorrelations
M
SD
(1)
.44
.06
–
.45
.03 .26***
(2)
(4)
–
4.54 1.54 .29*** .08*
–
(3)
–
3.78 1.53 .20*** .09** .42***
–
Running head: INEQUALITY, COMPETITIVENESS, MOTIVATION
47
1
Table S2.
2
Coefficient estimates and effect sizes from the ZIP code model, the urban model, and the composite model. Studies 1-3. Study 1 ZIP code model (N = 870)
Participant-based covariates
Main predictors
β ZIP-based Gini coefficient
f2
.21*** .03
Urban-based Gini coefficient -.02
–
Urban model (N = 835) β
f2
.03
–
-.04
–
Study 2 Composite model (N = 835) β
f2
ZIP code model (N = 823) β
f2
.20***a .03 .21*** .03 .05b
–
.07*
.01
-.11** .01 -.11** .01 -.03 – -.10** .01 Age .08* .01 .06 – -.11** .01 .04 – * Ethnicity (Whites vs. others) -.05 – -.07 – .07 .01 .01 – Status (workers vs. others) -.08* .01 -.10** .01 -.06 – -.09* .01 Income .02 – .02 – -.09* .01 -.06 – Education (grad. vs. others) .05 – .17*** .02 .04 – .09** .01 Sex (men vs. women)
Urban model (N = 797) β
.13* .07
f2
Study 3 Composite model (N = 797) β
f2
ZIP code model (N = 850) β
f2
.01 .23***a .03 .20*** .03 –
-.10* .01 .04 – .01 – -.09* .01 -.09* .01 .02 –
.00b
–
.07 – * -.10 .01 .06 – .01 – * -.09 .01 -.07 –
.02 -.06 -.03 -.08* -.08* .04 .10**
–
Urban model (N = 775) β
f2
.09
–
.04
–
Composite model (N = 775) β
f2
.16**a .01 .03b
–
– -.05 – .04 – – -.01 – -.04 – ** .01 -.10 .01 -.02 – .01 -.10** .01 -.10** .01 – .04 – -.09* .01 .01 .02 – .06 –
4
graduated from college; the paths of primary interest are framed; different superscripts indicate a difference (ps ≤ .05; italicized superscripts at p
5
< .1) between the effect of the ZIP code- and urban area-based Gini coefficient in the composite model (within the same study); differences in
6
sample sizes are due to missing values on the urban-area-based Gini coefficient; ***p < .001, **p < .01, *p < .05.
ZIP-based covariates
3
.10* .01 .04 – .04 – .12** .01 .02 – .11** .01 .13** .01 .01 – .09* .01 Employment percentage .00 – .02 – .10* .01 -.11* .01 -.14* .01 .12** .01 .01 – -.03 – .14** .01 Poverty rate .05 – -.03 – .00 – .03 – .06 – -.13** .01 -.01 – -.05 – .03 – *** *** *** * *** *** ** Education level .21 .03 .03 – .20 .03 .21 .03 .13 .01 .23 .03 .20 .03 .09 – .16 .01 Notes: “Men vs. women” means that men were coded “+0.5” and women “-0.5” (the same goes for White vs. others, and so on); “grad.” means
7
Population
Running head: INEQUALITY, COMPETITIVENESS, MOTIVATION
48
1
Table S3.
2
Coefficient estimates and effect sizes of the models testing the effects of income inequality (ZIP code-based Gini coefficient) on perceived
3
competitiveness without using the ten control variables. Studies 1-3. Study 1
Gini coefficient
Study 2
Study 3
β
f2
β
f2
β
f2
.19***
.04
.14***
.02
.20***
.02
4
Notes: “Men vs. women” means that men were coded “+0.5” and women “-0.5” (the same goes for White vs. others, and so on); “grad.” means
5
graduated from college; the paths of primary interest are framed; ***p < .001.
Running head: INEQUALITY, COMPETITIVENESS, MOTIVATION
49
1
Table S4.
2
Coefficient estimates and effect sizes of the multiple imputation-based SEMs testing the total effects of income inequality (ZIP code-based Gini
3
coefficient) on economic achievement goals (Model 1), achievement motives (Model 2), and self-regulatory foci (Model 3). Study 2. Model 1. Economic ach. goals
Model 2. Ach. motives
ZIP-based covariates
Participant-based covariates
OtherOtherSelfSelfNeed for approach goals avoidance goals approach goals avoidance goals achievement
Fear of failure
Model 3. Regulatory foci Promotion focus
Prevention focus
β
f2
β
f2
β
f2
β
f2
β
f2
β
f2
β
f2
β
f2
Gini coefficient
-.02
–
-.05
–
.01
–
.01
–
.03
–
.10*
.01
.02
–
.00
–
Sex (men vs. women)
.04
–
.01
–
.02
–
-.05
–
.20***
.04
-.04
–
.03
–
.02
–
.01 -.31*** .08
-.05
–
-.17*** .02 -.18*** .03 -.24*** .04 -.27*** .06
.1**
.01
.02
–
.09*
.01
-.02
–
.12***
.01
.07
–
-.17*** .03
-.07
–
.13**
.01
.13***
.01
-.01
–
.02
–
-.02
–
-.02
–
-.08*
.01
.01
–
-.03
–
.02
.05
–
.04
–
-.07
–
Age
-.21*** .04
Ethnicity (Whites vs. others) .11**
-.11**
.01
.07*
< .01
Status (workers vs. others)
.05
–
.04
–
Income
.07
–
.07
–
Education (grad. vs. others)
.04
–
.11
Population
.00
–
Employment percentage
.00
Poverty rate Education level Covariance
.02
–
.01
.03
–
-.02
–
.06
–
-.01
–
.00
–
-.06
–
.02
–
-.05
–
–
-.03
–
-.04
–
-.05
–
.03
–
.10*
.01
-.07
–
.04
–
-.04
–
-.02
–
-.03
–
-.05
–
-.08
–
-.04
–
-.04
–
-.01
–
-.03
–
-.01
–
.02
–
.06
–
.05
–
.00
–
-.05
–
-.02
–
**
***
.14
Between goals: covs ∈ (0.15, 0.56), ps ≤ .001
Between motives: 0.07*
***
.13
.02
Between foci: 0.01
4
Notes: “Men vs. women” means that men were coded “+0.5” and women “-0.5” (the same goes for White vs. others, and so on); “ach.” means
5
achievement; the paths of primary interest are framed; ***p < .001, **p < .01, *p < .05.
Running head: INEQUALITY, COMPETITIVENESS, MOTIVATION
50
1
Table S5.
2
Coefficient estimates and effect sizes of the multiple imputation-based SEMs testing the total effects of income inequality (ZIP code-based Gini
3
coefficient) on economic achievement goals (Model 1), achievement motives (Model 2), and self-regulatory foci (Model 3). Study 3. Model 1. Economic ach. goals
Model 2. Ach. motives
ZIP-based covariates
Participant-based covariates
OtherOtherSelfSelfNeed for approach goals avoidance goals approach goals avoidance goals achievement
Fear of failure
Model 3. Regulatory foci Promotion focus
Prevention focus
β
f2
β
f2
β
f2
β
f2
β
f2
β
f2
β
f2
β
f2
Gini coefficient
-.01
–
-.02
–
-.03
–
-.05
–
-.09*
.01
.02
–
-.03
–
.02
–
Sex (men vs. women)
.08*
.01
-.01
–
-.09*
.01
-.11**
.01
.13***
.02
-.04
–
-.11**
.01
-.01
–
-.06
–
Age
-.26*** .06 -.15*** .02 -.15*** .02
-.29*** .08 -.25*** .06 -.16*** .03 -.16*** .02
Ethnicity (Whites vs. others)
.04
–
.02
–
.02
–
-.03
–
.05
–
-.05
–
.08*
.01
.00
–
Status (workers vs. others)
-.01
–
.01
–
-.04
–
.00
–
.04
–
.01
–
-.08*
.01
.05
–
Income
.10**
.01
.02
–
-.04
–
-.06
–
.01
–
-.07*
0
.07
–
Education (grad. vs. others)
.00
–
.13***
.01
-.02
–
.18***
.03
.02
–
.00
–
-.05
–
.07*
< .01
Population
.03
–
.01
–
-.05
–
-.02
–
.09**
.01
.06
–
-.01
–
.03
–
Employment percentage
-.02
–
.05
–
.06
–
.05
–
-.03
–
.00
–
.01
–
.03
–
Poverty rate
-.03
–
.01
–
-.02
–
.03
–
-.02
–
-.01
–
.03
–
-.04
–
Education level
.02
–
-.01
–
.01
–
-.05
–
-.02
–
.00
–
-.05
–
.03
–
Covariance
Between goals: covs ∈ (0.10, 0.51), ps ≤ .003
Between motives: 0.15***
-.15*** .02
Between foci: -0.10**
4
Notes: “Men vs. women” means that men were coded “+0.5” and women “-0.5” (the same goes for White vs. others, and so on); “ach.” means
5
achievement; the paths of primary interest are framed; ***p < .001, **p < .01, *p < .05.
Running head: INEQUALITY, COMPETITIVENESS, MOTIVATION
51
1 2
Figure S1. Studies 2 and 3: Multiple imputation-based structural equation models testing the
3
effects of income inequality (ZIP code-based Gini coefficient) via perceived competitiveness
4
on economic achievement goals (Model 1), achievement motives (Model 2), and self-
5
regulatory foci (Model 3) without using the ten control variables. Standardized coefficients
6
are given above the arrows / lines for Study 2 and below the arrows / lines for Study 3; βind
7
corresponds to the estimate of the indirect effect; total effects and covariance parameters are
8
not represented; n/a means that the indirect effect is not calculated because the
9
competitiveness-to-motivation path is non-significant; ***p < .001, **p < .01, *p < .05.
Running head: INEQUALITY, COMPETITIVENESS, MOTIVATION 1
Appendix
2
Economic Achievement Goals Questionnaire (Studies 2 and 3)
52
3
The first three items represent self-approach goals, the next three items represent self-
4
avoidance goals, the next three items represent other-approach goals, and the last three items
5
represent other-avoidance goals. The items were presented in this order.
6 7 8 9
The following statements represent the type of economic goals that you may or may not have in life. Please indicate how true each statement is of you. To improve my financial situation over time.
10
To do better economically in my life than I did in the past.
11
To make more and more money over time.
12
To avoid the worsening of my financial situation over time.
13
To avoid doing worse economically in my life than I did in the past.
14
To avoid making less and less money over time.
15
To be more economically successful than others in life.
16
To be in a good financial situation compared to others in life.
17
To have more wealth than others in life.
18
To avoid being worse off economically than others in life.
19
To avoid being in a poor financial situation in comparison to others in life.
20
To avoid earning little money relative to others in life.


![Running Head: [insert running head here] - ETD - Vanderbilt University](https://m.moam.info/img/260x300/running-head-insert-running-head-here-etd-vanderbi_59f11e271723dde995d05447.jpg)