Rural, remote and regional differences in .... Access to, use of, and satisfaction with health services by geographic ... Satisfaction with access to GP services .
R ural,
remote and regional differences in women’s health:
Findings from the Australian Longitudinal Study on Women’s Health
Authors:
Annette Dobson, Julie Byles, Xenia Dolja-Gore, David Fitzgerald, Richard Hockey, Deborah Loxton, Deirdre McLaughlin, Nancy Pachana, Jenny Powers, Jane Rich, David Sibbritt and Leigh Tooth
Final report prepared for the Australian Government Department of Health and Ageing
June 2011
Major Report F Rural, remote and regional differences in women’s health: Findings from the Australian Longitudinal Study on Women’s Health
The research on which this report is based was conducted as part of the Australian Longitudinal Study on Women‘s Health by the University of Newcastle and the University of Queensland. We are grateful to the Australian Government Department of Health and Ageing for funding and to the women who provided the survey data. We acknowledge Medicare Australia for providing any Pharmaceutical Benefits Scheme and Medicare Benefits Scheme data.
Table of Contents
1.
Executive summary................................................................................................................................. 1
2.
Introduction ........................................................................................................................................... 5 2.1. Introduction to ALSWH ...............................................................................................................................5 2.2. Area of residence in the ALSWH .................................................................................................................7 2.2.1. Measure of Remoteness: ARIA+ .............................................................................................................7 2.2.2. Location of ALSWH participants...........................................................................................................10 2.3. References ................................................................................................................................................14
3.
Differences in health status by geographic location .............................................................................. 15 3.1. Mortality ...................................................................................................................................................15 3.2. Risk factors ...............................................................................................................................................17 3.2.1. Introduction .........................................................................................................................................17 3.2.2. Chronic conditions................................................................................................................................23 3.2.3. SF36 scores...........................................................................................................................................29 3.3. Summary ...................................................................................................................................................29 3.4. References ................................................................................................................................................32
4.
Access to, use of, and satisfaction with health services by geographic location .................................... 33 4.1. Selected usage, access, satisfaction- health services. ..............................................................................33 4.1.1. Visits to GPs .........................................................................................................................................33 4.1.2. Satisfaction with access to GP services ................................................................................................36 4.1.3. Visits to Medical Specialists .................................................................................................................40 4.1.4. Satisfaction with access to medical specialists ....................................................................................42 4.1.5. Hospital Admissions .............................................................................................................................44 4.1.6. Self-reported procedures .....................................................................................................................46 4.2. The management of heart conditions in older rural and urban Australian women.................................49 4.2.1. Health Service Use ...............................................................................................................................49 4.2.2. Medication Use ....................................................................................................................................54 4.2.3. Self-management advice .....................................................................................................................55 4.2.4. References............................................................................................................................................57 4.3. Use of dental services ...............................................................................................................................58 4.3.1. Discussion ............................................................................................................................................64 4.3.2. References............................................................................................................................................65 4.4. Complementary and alternative medicine (CAM) ....................................................................................66 4.4.1. Introduction .........................................................................................................................................66 4.4.2. Consultations with conventional health care providers by CAM use ...................................................66 4.4.3. Rating of conventional health care providers by CAM use ..................................................................67 4.4.4. Symptoms and diagnoses by CAM use.................................................................................................68 4.4.5. Diseases and consultations with a CAM practitioner ...........................................................................69 4.4.6. Summary ..............................................................................................................................................70 4.4.7. References............................................................................................................................................71 4.5. The use of CAM in the 1921-26 birth cohort: Rural women speak out ....................................................72 4.6. Screening services ....................................................................................................................................74 4.6.1. Pap tests ..............................................................................................................................................74 4.6.2. Mammograms .....................................................................................................................................81 4.6.3. Discussion ............................................................................................................................................85
- ii -
5.
Out of pocket costs for medical services by geographic location .......................................................... 86 5.1. 5.2. 5.3. 5.4.
6.
Differences in birth interventions by geographic location..................................................................... 94 6.1. 6.2. 6.3. 6.4. 6.5.
7.
Introduction ..............................................................................................................................................86 Discussion .................................................................................................................................................92 Conclusion ................................................................................................................................................93 References: ...............................................................................................................................................93
Introduction ..............................................................................................................................................94 Birth interventions by area of residence ..................................................................................................94 Risk factors for having an epidural or spinal block ...................................................................................96 Risk factors for having a caesarean ..........................................................................................................98 Key issues: ................................................................................................................................................99
Climate events and women’s health ................................................................................................... 100 7.1. Exceptional circumstances and mental health .......................................................................................100 7.2. Precipitation and self rated health .........................................................................................................102 7.3. Soil salinity ..............................................................................................................................................105 7.4. Qualitative experience of drought .........................................................................................................107 7.4.1. Drought as a burden ..........................................................................................................................108 7.4.2. Ageing in drought ..............................................................................................................................108 7.4.3. Resilience during drought ..................................................................................................................109 7.4.4. Conclusion ..........................................................................................................................................109 7.5. References ..............................................................................................................................................110
8.
Social cohesion ................................................................................................................................... 111 8.1. Neighbourhood.......................................................................................................................................111 8.1.1. Neighbourhood connection................................................................................................................111 8.1.2. Neighbourhood safety .......................................................................................................................112 8.1.3. Neighbourhood attachment and trust ...............................................................................................113 8.1.4. Social support.....................................................................................................................................114 8.1.5. Life satisfaction ..................................................................................................................................115 8.1.6. Stress ..................................................................................................................................................116 8.1.7. Perceived control ...............................................................................................................................117 8.1.8. Optimism............................................................................................................................................118 8.1.9. References..........................................................................................................................................118 8.2. Cohesion/satisfaction .............................................................................................................................119 8.2.1. Introduction .......................................................................................................................................119 8.2.2. References..........................................................................................................................................121 8.3. Driving.....................................................................................................................................................122 8.3.1. Introduction .......................................................................................................................................122 8.3.2. Main means of transport ...................................................................................................................122 8.3.3. Factors associated with continuing to drive ......................................................................................123 8.3.4. Discussion ..........................................................................................................................................124 8.3.5. References..........................................................................................................................................125
- iii -
List of Tables Table 2-1 Table 2-2 Table 2-3 Table 2-4 Table 2-5 Table 2-6 Table 2-7 Table 3-1
Schedule of surveys for the ALSWH, .........................................................................................................6 Survey 1 Unweighted Frequencies by ARIA+ Categories .........................................................................10 Survey 1 Weighted Frequencies by ARIA+ Categories .............................................................................11 Area distribution of women in the Australian population and the ALSWH sample in 1996. ...................11 ALSWH Sample Weights ...........................................................................................................................11 RRMA ARIA+ Classes, weighted Frequencies and Row Percents .............................................................12 Attrition at Survey 5 by Area of Residence, Frequencies and Row Percents ...........................................13 Numbers (and column percentages) of women categorised by area of residence, survival or cause of death. ....................................................................................................................................15 Table 3-2 Hazard ratios (adjusted for age) of deaths from all causes and selected causes. ....................................16 Table 4-1 Medication usage recorded by women reporting doctor diagnosed ischaemic heart disease, heart failure or atrial fibrillation. ...............................................................................................55 Table 4-2 Self management advice received by women reporting doctor diagnosed ischaemic heart disease, heart failure or atrial fibrillation. ...............................................................................................56 Table 4-3 Adjusted† odds ratios and associated 95% confidence intervals (C.I.) ....................................................61 Table 4-4 Factors associated with dentist consultations by older Australian women, derived from a longitudinal analysis using multivariable generalized estimation equation(GEE) modelling with backward stepwise elimination (n=9,387) .......................................................................................63 Table 4-5 Consultations with conventional health care providers by CAM use (consulted with a CAM practitioner or not) .........................................................................................................................67 Table 4-6 Rating of conventional health care providers by CAM use (consulted with a CAM practitioner or not) Level of Satisfaction (1=excellent … 5=poor). ..........................................................68 Table 4-7 Sought help for symptoms by CAM use (consulted with a CAM practitioner or not) ..............................69 Table 4-8 Diagnoses by CAM user status (consulted with a CAM practitioner or not) ............................................70 Table 4-9 Factors associated with having a Pap test in the past 2 years. 1973-78 and 1946-51 cohorts. ....................................................................................................................................................80 Table 4-10 Factors associated with having a mammogram in the past 2 years. 1946-51 cohort. ............................84 Table 5-1 Proportions of women with zero out of pocket costs for general practitioner services in 2008 .........................................................................................................................................................92 Table 7-1 Regression models for mental health component scores in the 1973-1978 cohort: coefficients with confidence intervals that do not include zero are statistically significant. ................106 Table 7-2 Regression models for mental health component scores in the 1946-1951 cohort: coefficients with confidence intervals that do not include zero are statistically significant. ................106 Table 7-3 Regression models for mental health component scores in the 1921-1926 cohort: coefficients with confidence intervals that do not include zero are statistically significant. ................107 Table 8-1 Factors affecting odds of driving, over time and across areas ...............................................................124
- iv -
List of Figures Figure 2-1 Figure 2-2 Figure 3-1 Figure 3-2 Figure 3-3 Figure 3-4 Figure 3-5 Figure 3-6 Figure 3-7 Figure 3-8 Figure 3-9 Figure 3-10 Figure 3-11 Figure 4-1 Figure 4-2 Figure 4-3 Figure 4-4 Figure 4-5 Figure 4-6 Figure 4-7 Figure 4-8 Figure 4-9 Figure 4-10 Figure 4-11 Figure 4-12 Figure 4-13 Figure 4-14 Figure 4-15 Figure 4-16 Figure 4-17 Figure 4-18 Figure 4-19 Figure 4-20 Figure 4-21 Figure 4-22. Figure 4-23 Figure 4-24 Figure 4-25 Figure 4-26 Figure 4-27 Figure 4-28 Figure 4-29 Figure 4-30 Figure 4-31
Map of Australia showing the 2006 ARIA+ categories ............................................................................9 Map of Australia showing locations of the ALSWH participants (2006) .................................................9 Current smoking in the 1973-78 cohort and the 1946-51 cohort. ........................................................18 Smoking in the 1921-26 cohort. ............................................................................................................19 Obesity in all cohorts.............................................................................................................................21 Non/low physical activity in all ALSWH cohorts. ...................................................................................22 Prevalence and incidence of diabetes by area of residence. ................................................................24 Prevalence and incidence of hypertension by area of residence..........................................................25 Prevalence and incidence of asthma by area of residence. ..................................................................26 Prevalence and incidence of chronic obstructive pulmonary disease by area of residence in the 1921-26 cohort. ..........................................................................................................27 Prevalence and incidence of osteoporosis by area of residence, 1921-26 cohort and 1946-51 cohort. .....................................................................................................................................28 Physical Component Score by area of residence. ..................................................................................30 Mental Component Score by area of residence. ...................................................................................31 Proportions of women making 7 or more visits to a GP – 1973-78 cohort ...........................................33 Proportions of women making 7 or more visits to a GP – 1946-51 cohort ...........................................34 Proportions of women making 7 or more visits to a GP – 1921-26 cohort ...........................................35 Satisfaction with access to GP services – 1973-78 cohort at Survey 5. .................................................37 Satisfaction with access to GP services for 1945-51 cohort at Survey 5. ...............................................38 Satisfaction with GP Services for 1921-26 cohort at Survey 3. ..............................................................39 Proportion of women who had visited a specialist in the past year – 1973-78 cohort .........................40 Proportion of women who had visited a specialist in the past year – 1946-51 cohort. ........................41 Proportion of women who had visited a specialist in the past year – 1921-26 cohort. ........................41 Satisfaction with access to medical specialists at Survey 5 – 1973-78 cohort. ......................................42 Satisfaction with access to medical specialists/hospital at Survey 5 - 1946-51 cohort. ........................43 Satisfaction with access to medical specialist/hospital at Survey 3 – 1921-26 cohort. ........................43 Self-reported admissions to hospitals – 1921-26 cohort. ......................................................................44 Satisfaction with access to hospitals for the ALSWH 1921-26 cohort, by area of residence. ..............................................................................................................................................45 Satisfaction with access to hospitals for the ALSWH 1946-51 cohort, by area of residence. ..............................................................................................................................................45 Satisfaction with access to hospitals for the ALSWH 1973-78 cohort, by area of residence. ..............................................................................................................................................46 Self report of hysterectomy, by area of residence – 1946-51 cohort. ...................................................47 Self report of cholecystectomy, by area of residence – 1946-51 cohort. ..............................................47 Self report of hip surgery by area of residence – 1921-26 cohort. ........................................................48 Health Service Use for women with Ischaemic Heart Disease according to area of residence. ..............................................................................................................................................50 Health Service Use for women with Heart Failure according to area of residence. ..............................52 Health Service Use for women with Atrial Fibrillation according to area of residence. ........................53 1973-78 cohort Surveys 4 and 5, visited a dentist. ................................................................................58 1946-51 cohort, visited a dentist Surveys 2-5. ......................................................................................59 1921-26 cohort, visited a dentist, Surveys 2-4. .....................................................................................59 Self report of time since last Pap test by women in 1973-78 cohort at Surveys 1-5 .............................75 Proportions of women in the 1946-51 cohort who report having a hysterectomy by each survey and by area of residence. ..................................................................................................76 Self report of time since last Pap test by women in the 1946-51 cohort. .............................................77 Ease of obtaining a Pap test. 1973-78 cohort Survey 5 .........................................................................78 Ease of obtaining a Pap test. 1946-51 cohort Survey 5 .........................................................................78 Self report of time since last Mammogram by women in 1946-51 cohort. ..........................................82
-v-
Figure 4-32 Ease of obtaining a Mammogram. 1946-51 cohort Survey 5 .................................................................83 Figure 5-1 Out of pocket costs for GP services since 1995-2001. .............................................................................87 Figure 5-2 Mean out-of pocket cost per general practice consultation per woman per year, 20022008, for women born in 1921-26 by area of residence, adjusted to 2008 dollar values. ......................89 Figure 5-3 Mean out-of pocket cost per general practice consultation per woman per year, 20022008, for women born in 1946-51 by area of residence, adjusted to 2008 dollar values. ......................90 Figure 5-4 Mean out-of pocket cost per general practice consultation per woman per year, 20022008, for women born in 1973-78 by area of residence, adjusted to 2008 dollar values. ......................91 Figure 6-1 Prolonged labour by area of residence. ....................................................................................................94 Figure 6-2 Emotional distress by area of residence ...................................................................................................95 Figure 6-3 Type of pain relief by area of residence ...................................................................................................95 Figure 6-4 Type of delivery by area of residence .......................................................................................................95 Figure 6-5 Episiotomy or vaginal tear requiring stitches by area of residence ..........................................................96 Figure 6-6 Epidural or spinal block by age of first-time mother ................................................................................97 Figure 6-7 Epidural or spinal block by private health insurance ................................................................................97 Figure 6-8 Epidural or spinal block by body mass index group ..................................................................................97 Figure 6-9 Epidural or spinal block by height .............................................................................................................98 Figure 7-1 Distribution of women living in Exceptional Circumstances declared areas by ARIA+ ...........................100 Figure 7-2 Ability to manage on available income by Exceptional Circumstances ..................................................101 Figure 7-3 Level of optimism for women living in Exceptional Circumstances and non-Exceptional Circumstances area ................................................................................................................................101 Figure 7-4 Distribution of dryness and drought across Australia by Survey year for the 1946-51 cohort.....................................................................................................................................................102 Figure 7-5 Ability to manage on available income by dryness and drought in 2007 for ALSWH participants in the 1946-51 cohort. .......................................................................................................103 Figure 7-6 Level of social support by dryness and drought in 2007 for ALSWH participants in the 1946-51 cohort. .....................................................................................................................................103 Figure 7-7 Level of optimism by dryness and drought in 2007 for ALSWH participants in the 1946-51 cohort.....................................................................................................................................................104 Figure 7-8 Changes in General Health over time by dryness and drought for ALSWH participants in the 1946-51 cohort. ...............................................................................................................................104 Figure 7-9 Changes in Mental Health over time by dryness and drought for ALSWH participants in the 1946-51 cohort. ...............................................................................................................................105 Figure 8-1 Mean neighbourhood connection scores and 95% confidence intervals in each geographic location ...............................................................................................................................111 Figure 8-2 Mean neighbourhood safety scores and 95% confidence intervals in each geographic location ..................................................................................................................................................112 Figure 8-3 Mean neighbourhood attachment & trust scores and 95% confidence intervals location ....................113 Figure 8-4 Proportion of women reporting level of social support in each geographic location ............................114 Figure 8-5 Mean life satisfaction scores and 95% confidence intervals in each geographic location .....................115 Figure 8-6 Proportion of women reporting levels of stress in each geographic location ........................................116 Figure 8-7 Mean perceived life control scores and 95% confidence intervals in each geographic location ..................................................................................................................................................117 Figure 8-8 Mean optimism scores and 95% confidence intervals in each geographic location ..............................118 Figure 8-9 Main means of transport for women in major cities, regional, and remote areas at Survey 3 (N= 7966), Survey 4 (N=6197) and Survey 5 (N=4772) .......................................................................123
- vi -
1.
Executive summary
Introduction Much has been published about rural health disadvantage in Australia, including a series of reports by the Australian Institute of Health and Welfare (AIHW). The AIHW concludes: ―... it is not currently possible to apportion the generally poorer health outcomes outside major cities to access, environment or risk factor issues. It is likely that each of these three play a part.‖ (AIHW, 2011) The Australian Longitudinal Study on Women‘s Health (ALSWH) is well-placed to elucidate these reasons using detailed data provided by women from across Australia. ALSWH is funded by the Australian Government Department of Health and Ageing and conducted by the University of Newcastle and the University of Queensland. ALSWH participants have taken part in five surveys over 15 years and many have consented to use of linked data from Medicare Australia. The findings reported here can be summarised in three broad themes: Generally poorer health of women living in regional and remote areas; Differences in access to and use of a wide range of health services; The resilience of rural women and characteristics of life in rural communities which ameliorate sometimes difficult conditions. It is important to note that within each of these themes there are contradictions and inconsistencies in the findings, and these emphasise the need for further research to allow deeper understanding and more nuanced responses. The study findings also show clear examples where government policies have been effective in reducing health inequities, as well as highlighting situations in which changes in policies and practices could lead to further improvements. This summary is structured around these three themes, drawing on findings from throughout the report. Poorer health of rural women Among ALSWH participants born in 1921-26, 23% died between 1996 and 2006. Consistent with the findings of others, death rates for these women were higher in regional and remote areas than in major cities. The regional and remote death rates for women in the 1921-26 cohort were particularly higher for lung cancer, chronic obstructive pulmonary disease and ischaemic heart disease, which are often associated with tobacco smoking (section 3.1). (There were too few deaths in the other cohorts to provide reliable estimates). When we examined the main risk factors for major diseases for women from all cohorts we found that current smoking prevalence was not markedly different across areas defined by distance from major centres. In all areas and age groups smoking decreased over time, although the change was slower among young women in remote areas. The explanation for the higher death rates from apparently smoking-related causes among older rural women may therefore lie in higher levels of smoking in the past (possibly decades ago), exposure to smoking by others, or greater exposure to other hazards (section 3.2.1). For women of all ages, one health risk factor that was consistently higher with increasing distance from major cities was obesity. Prevalence and incidence of diabetes and hypertension, conditions which are associated with obesity, were also consistently higher. When we analysed the rates of these conditions
1
by area, body mass index (BMI), and various demographic factors, the area differences in disease could be almost entirely explained by the higher levels of obesity. The ALSWH data strongly suggest that higher levels of BMI (and prevalence of obesity) in regional and remote areas account for the higher rates of diabetes and other risk factors for cardiovascular disease. This is an area where effective health promotion targeted to rural women could reduce health inequality. For various other health-related conditions there were few differences in prevalence or trends in incidence across areas; these included asthma (section 3.2.2), and prolonged labour or emotional distress among first-time mothers (section 6). Access to and use of health services Use of most health services was higher in major cities than in regional and remote areas. However the pattern of GP use among the 1973-78 and 1946-51 cohorts varied over time. For the period 1996 - 2002 the level of bulk billing decreased and out-of-pocket costs increased for all age cohorts, especially for women in rural areas (section 5). In 2004, there were changes to Medicare reimbursements to GPs for services to patients from rural and remote areas, selected eligible metropolitan areas, or anywhere in Tasmania, and for services provided to older people (section 5). When we analysed bulk-billing rates and out-of-pocket costs for 2002-2008 we found an overall improvement in access to bulk-billing. We also found continuing relative disadvantage for women living in inner regional areas not covered by the 2004 Medicare change. These results suggest that the incentives should be further evaluated to assess the potential for reducing inequity for inner regional areas while maintaining the improved access for people in more remote areas. Numbers of visits to specialists decreased with increasing distance from major cities for all age cohorts at all surveys (section 4.1.3). However there was little difference in hospital admissions between areas (section 4.1.5). A detailed analysis of medical care for women with heart disease showed lower levels of recent cardiological review, echocardiograms and stress tests for rural women. Medications consistent with recommended guidelines and advice for self-management of their conditions was generally poor but consistent across areas (section 4.2). Among the 1946-51 cohort rates of hysterectomy increased with distance from major cities (section 4.1.6). This pattern persisted over time and seems likely to reflect less access to or less interest in trying alternative treatments by women in country areas. In contrast to the pattern for hysterectomies in the 1946-51 cohort, rates of other procedures generally decreased with distance from major centres. This was the pattern for hip surgery in the 1921-26 cohort at Survey 2, although the inequality for hip surgery was reduced over time (section 4.1.6). For both the 1946-51 cohort and the 1921-26 cohorts, osteoporosis was more commonly reported in major cities, as the diagnosis depends on tests more easily available there (section 3.2.2). In the 1973-78 cohort, there was consistently greater use of obstetric interventions in major cities than in regional and remote areas; these included use of epidural injections, forceps or ventous suction, and emergency and elective caesarean section (section 6). Visits to dentists for women in all cohorts were much more common in major cities (section 4.3). Detailed analyses – both cross-sectional and longitudinal, with adjustments for socio-economic and demographic factors and health status – showed almost 50% higher use of dentists by women in cities compared to rural areas. However, overall, only 35% of women in the 1921-26 cohort had visited a dentist in a 12 month period; women cited access difficulties, including travel and costs, as reasons for not visiting a dentist even when they needed to do so. The cost of private dental care, compared with Medicare subsidised medical treatment, is a barrier to appropriate oral health care and this has recently been
-2-
identified as a top priority by the Health and Hospital Reform Commission (National Health and Hospitals Reform Commission, 2009). In contrast to other health services, Pap tests and mammography were more uniformly used across areas with breast screening rates highest in remote areas and Pap test rates highest in regional areas (section 4.6). At each survey women are asked to rate their access to and their satisfaction with services. The results were consistent across all cohorts, over time and for all services. Women in remote areas experienced the greatest difficulty accessing services (even when their use is relatively high, as for screening tests). Women in regional areas experienced more difficulties accessing services than women in major cities. This pattern was true for access to GPs (GPs who bulk-bill, female GPs, after hours service, hours when GPs are available, waiting times for appointments, and choice of GPs – section 4.1.2); access to specialists (section 4.1.4); hospitals (section4.1.5); and screening tests (section 4.6). In summary, for most medical and other health services, use is much lower in remote and regional areas and women experience considerably more difficulties with access than in major cities. Country women whose health is generally poorer than city women‘s also have less health care. The exceptions to this pattern – publically funded screening services and changes in bulk-billing policy – show that government subsidies for health services can be very effective ways of reducing inequities in health services. Resilience and life in rural communities Despite the well-documented differences in objective measures of health across areas, physical and mental health scores based on self-reported data differed little, even though the expected differences between age cohorts and over time were apparent (section 3.2.3). This may reflect differences in views, values and expectations related to health among rural women compared to women living in major cities. Use of complementary and alternative medicines (CAM) is higher in regional and remote areas (section 4.4). CAM use does not appear to be related to health status (sections 4.4.4 and 4.4.5) and there is conflicting evidence about whether it is related to dissatisfaction with conventional health services (sections 4.4.2, 4.4.3 and 4.5). Interviews with a small sample of rural women revealed some scepticism about conventional practitioners and belief in traditional practises and CAM, reinforced by the social networks in rural areas. We examined several markers of climate change and their potential impact on health in rural areas. These were: the declaration of areas as experiencing exceptional circumstances (e.g., drought, flood and fire) that result in severe downturn in farm and farm-related income and entitle some people in these areas to income support from governments (section 7.1); long-term changes in rainfall resulting in prolonged periods of dryness and drought (section 7.2); and soil salinity, and markers of temperature and vegetation in south-western Western Australia (section 7.3). In all cases we found no evidence of adverse effects on mental or physical health. Analysis of comments written by women on the surveys pointed to the resilience and adaptability of country women to dealing with adversity (perhaps strengthened by government support) as the possible explanation (section 7.4). ALSWH has included several measures of neighbourhood satisfaction, social support, life satisfaction optimism and stress (section 8.1). These showed considerable differences between regional, remote and urban areas. Scores for neighbourhood connectedness, feeling safe and life satisfaction were highest in remote areas and decreased with increasing nearness to major cities. Neighbourhood attachment and trust were highest in outer and inner regional areas and lowest in major cities. Scores for perceived control and optimism were highest in remote areas and lowest in outer regional areas. Interviews with older women emphasised the importance of support from neighbours and social networks for women
-3-
living in rural areas, and on driving as the main means of transport which is essential to maintain these connections (section 8.2). Women in regional and remote areas have few transport options other than driving and they continue to drive as long as their health and vision permit (section 8.3). Services to help rural people maintain good vision are especially important for their independence and community connectedness. The importance of driving for rural people to access health care and other services for themselves and the people they provide care for, and to maintain social their networks poses a policy challenge. Stopping older people from driving because of health issues which affect their ability to drive, while potentially reducing road crashes, impacts adversely on many aspects of their lives, especially in rural and remote areas. This is a complex issue. Consideration should be given to vehicle and road design that is safer for older people; alternative transport options and supportive infrastructures; effective licensing systems for older drivers; and driver education tools.
Overall, the report shows a number of differences in health and health-care use for women in regional and remote areas compared to urban-dwelling women. The findings point to the need to address specific risk factors such as obesity, and to continue, strengthen and broaden existing effective policies for better access to services. It is also important to consider the contexts in which women live, and how these impact on women‘s mental and social well-being.
References Australian Institute of Health and Welfare. Impact of rurality on health status, http://www.aihw.gov.au/rural-health-impact-of-rurality/ (accessed 16 March, 2011). National Health and Hospitals Reform Commission. 2009. A Healthier Future for all Australians – Final Report of the National Health and Hospitals Reform Commission. Commonwealth Government of Australia. ISBN: 1-74186-940-4
-4-
2.
Introduction
In 2007-2008 the Australian Institute of Health and Welfare (AIHW) published a series of reports documenting differences in health status and health systems performance (AIHW 2007; 2008a; 2008b). AIHW found death rates are lower and other measures of health status are better for people living in major cities in Australia than for those living in regional or remote areas, and concluded ―it is not currently possible to apportion the generally poorer health outcomes outside major cities to access, environment or risk factor issues. It is likely that each of these three play a part.‖ Other researchers have also found that differences in health between people living in regional and rural areas compared to urban areas in Australia are complicated, with different patterns for different health conditions (Smith et al., 2008; Vagenas et al., 2009; Jong et al., 2004). Comparisons with other countries are complicated because patterns vary depending on the extent of geographic isolation, access to services (including health insurance coverage), and occupational hazards (Smith et al., 2008; Judd et al., 2002). Most commonly cited reasons for poorer health in rural and regional areas of Australia include: lower socio-economic level (e.g., less education, lower income); higher proportions of people of Aboriginal and Torres Strait Islander background: different attitudes to health and health services (e.g., greater resilience or stoicism); less healthy lifestyle (e.g., higher prevalence of smoking and overweight); environmental and occupational exposures (e.g., dust, drought, sun exposure); poorer access to health services (e.g., distance to services, greater out-of-pocket costs); less effective health services (e.g., hospital with poorer facilities, less experienced doctors).
The challenge is to disentangle these factors. To meet this challenge we need: data on health outcomes for each individual (to avoid the ‗ecological fallacy‘ of making inferences about individuals based on evidence from aggregate data); data on each of the relevant factors (‗exposures‘) for the same individual (in order to estimate the joint effects of exposures); longitudinal data in order to identify ‗causes‘ that occur before the ‗effects‘ (to avoid ‗reverse causation‘ interpretation); knowledge of risk factors and management of the selected conditions in order to identify points along the disease pathway which are potentially amenable to changes; understanding of the extent to which interventions could reduce the urban-rural differences. In this report, we use accumulated data from ALSWH participants to examine some of these issues.
2.1. Introduction to ALSWH The ALSWH is a longitudinal population-based survey funded by the Australian Government Department of Health and Ageing. The project began in 1996 and involves three large, nationally representative, cohorts of Australian women representing three generations: the 1973-1978 cohort, aged 18 to 23 years when first recruited in 1996 (N=14 247) and now aged 33 to 38 years in 2011
-5-
the 1946-1951 cohort, aged 45 to 50 years in 1996 (N=13 716), now aged 60 to 65 years in 2011 the 1921-1926 cohort, aged 70 to 75 years in 1996 (N=12 432), now aged 85 to 90 years in 2011. The women have now been surveyed at least five times over the past 15 years, providing a large amount of data on their lifestyles, use of health services and health outcomes. The schedule of surveys is shown in Table 1 as well as the age in years and number of participants in each cohort. Table 2-1 Schedule of surveys for the ALSWH, age in years and number of participants in each cohort Survey S1
Year
1973-1978 cohort
1946-1951 cohort
1921-1926 cohort
1996
18-23 N=14,247
45-50 N=13,716
70-75 N=12,432
47-52 N=12,338
1998 S2
73-78 N=10,434
1999 2000
22-27 N=9688 50-55 N=11,200
2001 S3
76-81 N=8646
2002 2003
25-30 N=9081 53-58 N=10,905
2004 S4
79-84 N=7158
2005 2006
28-33 N=9145 56-61 N=10,638
2007 S5
82-87 N=5561
2008 2009
31-36 N=8200 59-64 N=9900*
2010 S6
85-90
2011 2012
34-39
2015
*Survey intake will be finalised in August 2011.
-6-
2.2. Area of residence in the ALSWH 2.2.1.
Measure of Remoteness: ARIA+
For this report, in consultation with the Department of Health and Ageing, it was decided that ARIA+ would be used to define areas of residence. Here, we explain how this measure is defined, give comparisons with other area of residence measures, and provide summary statistics of ARIA+ for the ALSWH cohorts at baseline, as well as tables on population sizes and attrition in the ALSWH. For each ALSWH participant at each survey, we obtain estimates of latitude and longitude based on their postal address. These estimates are calculated by the National Centre for Social Applications of Geographic Information Systems (GISCA). This detailed geographic data enables us to classify each area of residence according to ARIA+. Sample Selection: RRMA The first system of area classification used in the ALSWH was the Rural, Remote, and Metropolitan Area system (RRMA) developed by the Departments of Primary Industries and Energy, Human Services and Health. This is a 7-category system that can be collapsed into three categories: Urban, Rural, and Remote. The ALSWH sample was selected using these categories, with deliberate over-sampling of the Rural and Remote categories. The RRMA has since been replaced (by ARIA and then ARIA+), but is still used in the ALSWH annual Data Books. Since the sample was selected using the RRMA system the ALSWH sample weights are also based on the RRMA values at 1996. (Reference: ALSWH Technical Report 4). ARIA and ARIA+ ARIA (Accessibility/Remoteness Index for Australia) is a continuous measure that is commonly grouped into 5 categories, unlike the RRMA which is a 7-way categorical measure. ARIA was developed by GISCA, using 1996 Census data, and is designed to measure ‗remoteness‘. ARIA has since been expanded to ARIA+, which is now used by the Australian Bureau of Statistics (ABS) for its measure of remoteness, and by ALSWH for its measure of area of residence. ARIA+ is very similar to ARIA so here we explain ARIA+ only, noting where ARIA differs from ARIA+. ARIA+ is founded on the principle that remoteness and urbanity are not mutually exclusive and an Urban, Rural, Remote continuum is not appropriate or even desirable. For example, Alice Springs can be considered both remote and a sizable urban centre. Similarly, a rural centre may be quite accessible. ARIA+ measures ‗remoteness‘ in terms of access along the road network from 11,879 populated localities to five categories of service centres. (The original ARIA used only four centres.) Service centres are urban centres with populations of 1000 or more at the 1996 census. (The four ARIA centres had populations of 5000 or more.) The ARIA+ index ranges from 0 to 15 (ARIA ranges from 0 to 12), with 0 as the least remote value and 15 as the most remote. A higher ARIA+ value indicates more remoteness. However, an ARIA+ value of 8 does not necessarily mean the location is twice as remote as a location with a value of 4. ARIA+ is based on physical geography and is not, by itself, intended to be a socioeconomic index. The idea is that remoteness is defined by the distance travelled by road to the nearest urban centre, and the size of the urban centre is a proxy for the range of services available. Urban centres were divided into five categories based on research indicating towns of 1000 to 4999 people usually provided only a subset of services from a selected group. Towns of 5000 and more usually provided all the services to some extent. The highest category of urban centre, Category A, was
-7-
a centre where all services are fully available. methodology.
There are 738 service centres used in the ARIA+
The ARIA+ score for a particular locality is calculated by first measuring the shortest road distance from a populated locality to each of the nearest five categories of service centre. Towns within a service centre are given a distance of zero. Also, the Australian average (mean) of these road distances, for each category, is calculated. For each locality the ratio of the shortest distance to the national average shortest distance, for each category of service centre, is calculated. This gives five ratios for each category of service centre. The maximum values for these ratios are capped at three. The five individual values are then summed to arrive at a single ARIA+ score for the populated locality. This is necessarily from 0 to 15 inclusive. Localities on islands had their distances adjusted. Anyone living within one of the 11,879 localities can be assigned an ARIA+ score from this method. For those living outside the localities, a 1 km by 1 km grid method is used. Each such grid in Australia is given an ARIA+ value based on the scores from the six closest localities. The grid‘s ARIA+ value is given to anyone living within the grid. (Reference: http://gisca.adelaide.edu.au/projects/category/about_aria.html)
The ABS, and the ALSWH, has adopted five classes of remoteness. ARIA+ ranges
ARIA+ Categories
Examples
From 0 to less than 0.2
Major Cities of Australia
Sydney
From 0.2 to less than 2.4
Inner Regional Australia
Hobart
From 2.4 to less than 5.92
Outer Regional Australia
Cairns
Remote Australia
Alice Springs
Very Remote Australia
Most of Northern Territory
From 5.92 to less than 10.53 From 10.53 to 15 inclusive Off-shore, migratory and shipping
Migratory
ALSWH does not use the final category of ‗Off-shore, migratory and shipping‘. category would be given a missing value for ARIA+.
Any woman in this
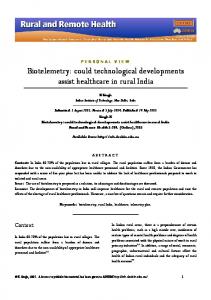
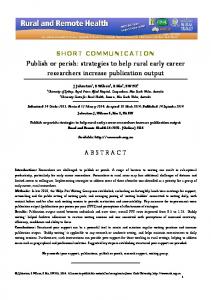
Figure 2-1 (sourced from http://www.abs.gov.au/websitedbs/D3310114.nsf/home/remoteness+structure ) shows a map of ARIA+ categories based on the 2006 census. Figure 2 shows the location of ALSWH participants in 2006. These maps illustrate the good geographic coverage of ALSWH. ALSWH was designed to have over-representation of women living in regional and remote areas to enable us to obtain reliable estimates for these areas. To obtain valid national estimates, or to make valid comparisons, it is often necessary to re-weight these estimates to reflect the national population distribution.
-8-
Figure 2-1 Map of Australia showing the 2006 ARIA+ categories
Figure 2-2 Map of Australia showing locations of the ALSWH participants (2006)
-9-
2.2.2.
Location of ALSWH participants
Table 2-2 shows the actual number of ALSWH participants in Survey 1 (conducted in 1996) by ARIA+ category. Table 2-2 Survey 1 Unweighted Frequencies by ARIA+ Categories 1973-78
1946-51
1921-26
ARIA+ categories
Freq
%
Freq
%
Freq
%
Major Cities
7375
51.80
5000
36.46
5173
41.61
Inner Regional
4307
30.25
5214
38.03
4803
38.63
Outer Regional
2090
14.68
2798
20.41
2185
17.58
Remote
347
2.44
544
3.97
230
1.85
Very Remote
118
0.83
156
1.14
41
0.33
All Remote
465
3.27
700
5.11
271
2.18
Total Missing
14,237
13,712
12,432
10
3
0
Collapsing Remote and Very Remote categories At Survey 1 there were 118, 156, and 41 women in the Very Remote categories in the 1973-78, 1946-51, and 1921-26 cohorts, respectively (Table 2-2). Due to these very small numbers (≤ 1% of each cohort) the categories of remote and very remote are combined and the resulting group is called ‗All Remote‘. Table 2-3 shows the distribution of the weighted frequencies by ARIA+ categories for each cohort. These weighted data are used when we wish to produce national estimates whereas the unweighted data in Table 2-2 are used when we are comparing ARIA+ categories (e.g. for most calculations in this report). ALSWH Sampling Scheme and sample weights A striking feature of Table 1 is the different distributions of the ARIA+ across cohorts. For example, about 52% of the 1973-78 cohort live in Major Cities while only about 36% and 42% of the 1946-51 and 1921-26 cohorts, respectively, live in Major Cities. This is due to three reasons. Firstly, the ALSWH sample was selected so that women whose postcodes were in areas in RRMA categories of Rural or Remote were twice as likely to be sampled as women living in RRMA Urban areas. Table 2-4 shows the national population distribution in 1996 of women in each of the ALSWH age groups. For example, for women born in 1973-78 approximately 3% lived in Remote areas, 21% in Rural areas and 76% in Urban areas. Therefore, 6% (twice the 3%) of women selected for this cohort were from Remote areas, 42% (twice the 21%) from Rural areas and the remainder, 52%, from Urban areas. Secondly, response rates to the ALSWH invitation to participate in ALSWH differed between areas and cohorts. Thirdly, once we had the actual addresses (not just postcodes) of participants, we were able to get GISCA to code the locations more accurately. The resulting distribution of the sample, by RRMA category and cohort, is also shown in Table 2-4.
- 10 -
Table 2-3 Survey 1 Weighted Frequencies by ARIA+ Categories 1973-78
1946-51
1921-26
ARIA + categories
Freq
%
Freq
%
Freq
%
Major Cities
9849
69
9285
68
8449
68
Inner Regional
2699
19
2753
20
2648
21
Outer Regional
1348
9
1390
10
1159
9
333
2
283
2
175
1
All Remote Total
14,230
13,710
12,430
12
42
0
Missing
Table 2-4 shows the national population frequencies and percents for each of the cohorts at 1996. The ratio of the population percent over the sample percent is the sample weight for that RRMA class. Table 2-4 Area distribution of women in the Australian population and the ALSWH sample in 1996 by RRMA category and birth cohort. 1973-78
1946-51
1921-26
RRMA Classes
Pop (%)
Sample (%)
Pop (%)
Sample (%)
Pop (%)
Sample (%)
City (Cap/other metro)
579,690 (76)
7856 (55)
531,644 (72)
4979 (36)
265,558 (70)
5022 (41)
Rural (Large/small/other)
158,622 (21)
5802 (41)
183,717 (25)
7796 (57)
105,151 (28)
7077 (57)
Remote (Centre and other)
21,537 (2.8)
553 (3.9)
19,375 (2.6)
923 (6.7)
6389 (1.7)
285 (2.3)
759,849
14,211
734,736
13,698
377,098
12,384
Total
To adjust for the difference in distributions, ALSWH sample weights were calculated by dividing the population proportion for each RRMA class by the sample proportion for each RRMA class. These weights are shown in Table 2-5. The weights are used for valid estimates for the population. Table 2-5 ALSWH Sample Weights RRMA Class
1973-78
1946-51
1921-26
City (Cap/other metro)
1.38004
1.990695
1.736558
Rural (Large/small/other)
0.511309
0.439343
0.487945
Remote (Centre and other)
0.728379
0.39135
0.736198
- 11 -
ALSWH sample by ARIA+ groups ARIA+ rather than RRMA is used in this report. Table 2-6 shows the ALSWH sample, multiplied by the sampling weights in Table 2-5 and rounded to the nearest whole number, cross-classified by RRMA and ARIA+ groupings. The RRMA Urban group roughly matches the ARIA+ Major Cities, the Rural group roughly matches the Inner and Outer Regional areas, and the Remote group roughly matches the All Remote category. Table 2-6 RRMA ARIA+ Classes, weighted Frequencies and Row Percents RRMA Class
1973-78 Cohort (ARIA+) Major cities
Inner regional
Outer regional All Remote
Total
Urban
6996 89.00
570 7.25
273 3.47
22 0.28
7861
Rural
375 6.44
3729 64.08
1622 27.87
93 1.60
5819
Remote
4 0.72
8 1.44
195 35.01
350 62.84
557
Major cities
Inner regional
Outer regional All Remote
Total
Urban
4569 91.69
298 5.98
114 2.29
2 0.04
4983
Rural
425 5.45
4911 62.98
2342 30.03
120 1.54
7798
Remote
6 0.64
5 0.54
342 36.73
578 62.08
931
1946-51 Cohort (ARIA+)
1921-26 Cohort (ARIA+) Major cities
Inner regional
Outer regional All Remote
Total
Urban
4745 94.15
243 4.82
49 0.97
3 0.06
5040
Rural
428 6.02
4557 64.14
2008 28.26
112 1.58
7105
Remote
0 0.00
3 1.05
128 44.60
156 54.36
287
Attrition by Area of Residence To analyse the unadjusted attrition (i.e. using unweighted data) in the ALSWH by area of residence, three attrition values were calculated: responded, not responded, and deceased. The attrition rates at Survey 5 for each cohort are shown in Table 2-7 below. In the 1973-78 cohort non-response (drop-out or loss to follow-up) is slightly higher in remote areas than other ARIA+ categories. In the 1946-51 cohort attrition does not appear to be related to area of residence. In the 1921-26 cohort, attrition due to death is higher in the remote areas.
- 12 -
Table 2-7 Attrition at Survey 5 by Area of Residence, Frequencies and Row Percents
1973-78 Cohort ARIA + Classes
Respondent
Non Respondent
Deceased
Total
Major Cities %
4207 57
3138 43
30 0.4
7375
Inner Regional %
2466 57
1831 43
10 0.2
4307
Outer Regional %
1199 57
881 42
10 0.5
2090
252 54
208 45
5 1
465
8124
6058
55
14,237
All Remote % Total
1946-51 Cohort ARIA + Classes
Respondent
Non Respondent
Deceased
Total
Major Cities %
3808 76
1086 22
106 2
5000
Inner Regional %
4131 79
974 19
109 2
5214
Outer Regional %
2160 77
567 20
71 3
2798
538 77
146 21
16 2
700
10,637
2773
302
13,712
All Remote % Total
1921-26 Cohort ARIA + Classes
Respondent
Non Respondent
Deceased
Total
Major Cities %
2332 45
1760 34
1081 21
5173
Inner Regional %
2140 45
1600 33
1063 22
4803
Outer Regional %
981 45
681 31
523 24
2185
All Remote %
108 40
94 35
69 25
271
5561
4135
2736
12,432
Total
- 13 -
2.3. References Australian Institute of Health and Welfare. (2007). Rural, regional and remote health: A study on mortality (2nd edition). Rural Health Series (Australian Institute of Health and Welfare, Canberra). Australian Institute of Health and Welfare. (2008a). Rural, regional and remote health: Indicators of health status and determinants of health. Rural Health Series (Australian Institute of Health and Welfare, Canberra). Australian Institute of Health and Welfare. (2008b). Rural, regional and remote health: Indicators of health system performance. Rural Health Series (Australian Institute of Health and Welfare Canberra). Smith, K.B., Humphreys, J.S. & Wilson, M.G.A. (2008). Addressing the health disadvantage of rural populations: How does epidemiological evidence inform rural health policies and research? Australian Journal of Rural Health 16, 56-66. Vagenas, D., McLaughlin, D. & Dobson, A. (2009). Regional variation in the health of older Australian women: Grey canaries? Australian and New Zealand Journal of Public Health 33, 119-125. Jong, K.E., Smith, D.P., Yu, X.Q., O'Connell, D.L., Goldstein, D. & Armstrong, B.K. (2004). Remoteness of residence and survival from cancer in New South Wales. Medical Journal of Australia 180, 618622. Judd, F.K., Jackson, H.J., Komiti, A., Murray, G., Hodgins, G. & Fraser, C. (2002). High prevalence disorders in urban and rural communities. Australian and New Zealand Journal of Psychiatry 36, 104-113.
- 14 -
3.
Differences in health geographic location
status
by
3.1. Mortality Table 3-1 below shows the numbers of deaths and the percentages of deaths from the major causes of death for ALSWH participants born in 1921-26 from a recently paper recently published in the Australian and New Zealand Journal of Public Health (Dobson et al., 2010). The distribution of deaths across the main causes is very similar to the distribution for all women in this age group in the entire Australian population. Table 3-1 Numbers (and column percentages) of women categorised by area of residence, survival or cause of death. Area Major cities
%
Inner regional
%
5160
Outer regional
%
2221
Remote
%
269
Total
Total
4750
12400
Alive at 31 October 2006
3726
78
3997
77
1678
76
201
75
9597
All causes of death
1024
22
1168
23
543
24
68
25
2803
Ischaemic heart disease
209
20
220
19
132
24
9
14
570
Breast cancer
38
4
44
4
21
4
1
1
104
Lung cancer
36
4
55
5
31
6
2
3
124
Stroke
119
12
104
9
47
9
7
10
277
COPD
35
3
73
6
24
4
6
9
138
Digestive system cancers
94
9
113
9
50
9
7
10
264
Other cancers
149
15
164
14
77
14
6
9
396
Other known causes
331
32
381
33
155
29
28
41
895
Unknown causes
13
1
14
1
6
1
2
3
35
Source: Dobson A, McLaughlin D, Vagenas D, & Wong KY. (2010) Why are death rates higher in rural areas? Evidence from the Australian Longitudinal Study on Women‘s Health. Australian and New Zealand Journal of Public Health,34, 624-628
However the rates of deaths differ across areas and causes, as shown in Table 3-2 which compares the rates in inner regional, outer regional and remote areas (and all rural areas considered together) with those in the major cities. Compared with major urban centres the rates of deaths from all causes were higher in all other areas. Death rates from all causes were 9% higher for all rural areas compared to major cities, and the excess was statistically significantly higher in outer regional areas.
- 15 -
Table 3-2 Hazard ratios (adjusted for age) of deaths from all causes and selected causes by area of residence with major urban centres as the reference category (estimates with confidence intervals that do not include unity are shown in bold). Area Causes of death
Inner regional
Outer regional
Remote
All causes of death
1.06 (0.97,1.15)
1.16 (1.04, 1.29)
1.23 (0.96, 1.57)
Ischaemic heart disease
0.97 (0.80, 1.17)
1.36 (1.10, 1.70)
0.77 (0.40, 1.50)
Breast cancer
1.07 (0.69, 1.65)
1.18 (0.69, 2.02)
0.47 (0.06, 3.42)
1.08 (0.73, 1.61)
Lung cancer
1.41 (0.93, 2.15)
1.85 (1.14, 2.99)
0.99 (0.24, 4.09)
1.52 (1.03, 2.25)
Stroke
0.80 (0.62, 1.05)
0.84 (0.60, 1.18)
1.06 (0.49, 2.26)
0.82 (0.65, 1.05)
COPD
1.93 (1.29, 2.88)
1.47 (0.87, 2.47)
3.05 (1.28, 7.26)
1.83 (1.25, 2.69)
Digestive system cancers
1.11 (0.84, 1.46)
1.14 (0.81, 1.60)
1.15 (0.50, 2.61)
1.12 (0.87, 1.45)
Other cancers
1.02 (0.81, 1.27)
1.11 (0.84, 1.46)
0.71 (0.32, 1.61)
1.03 (0.84, 1.27)
Other known causes
1.06 (0.92, 1.23)
1.00 (0.83, 1.21)
1.55 (1.05, 2.29)
1.06 (0.93, 1.22)
All rural 1.09 (1.01, 1.18) 1.08 (0.91, 1.28)
Source: Dobson A, McLaughlin D, Vagenas D, Wong KY. (2010) Why are death rates higher in rural areas? Evidence from the Australian Longitudinal Study on Women‘s Health. Australian and New Zealand Journal of Public Health,34, 624-628.
Rural women were more likely to die from what are traditionally regarded as smoking-related diseases: chronic obstructive pulmonary disease (COPD), lung cancer and ischaemic heart disease (IHD), than women in urban areas. However, history of smoking did not differ much by area (see Section 3.2 of this report) and the estimated risk of death from these diseases did not change when smoking was taken into account. So other explanations must be sought. There is evidence that women in rural areas have higher levels of major risk factors for IHD (Jong et al., 2004) and they also have lower rates of life-saving procedures such as revascularisation (Campbell et al., 2001). So it is important to know the relative contribution of each of these factors to the higher death rates in order to identify appropriate interventions. As another example, people living in rural areas may be exposed to a range of potentially hazardous substances (e.g., grain dust, mining dust, agricultural chemicals), that increase their risk of respiratory disease. But treatment may also be different: for instance, it has been shown that people with COPD or lung cancer who were treated in a rural hospital did worse than those who were treated in an urban hospital (Jack et al., 2003; Campbell et al., 2001; Luke et al., 2004). Finally, the differences in deaths attributed to lung cancer illustrate another aspect of differences in health services. The gold standard of lung cancer diagnosis is microscopic confirmation, because effective treatment is dependent on correct classification between small-cell and non-small-cell lung cancer, and to exclude the possibility of secondary cancer (most commonly from the breast or bowel). However Queensland patients diagnosed with lung cancer between 1999 and 2002 and treated in regional hospitals were three times less likely to have microscopic confirmation than patients in tertiary public hospitals (Siahpush & Singh, 2004). Therefore a possible explanation for the excess deaths due to lung cancer is that the source of the primary cancer was wrongly attributed to the lung. These examples illustrate that the explanations for urban-rural differences in health require careful analysis, insight and interpretation.
- 16 -
3.2. Risk factors 3.2.1.
Introduction
In this section we present the prevalence of selected risk factors at every survey for each of the five ARIA+ categories and each cohort. For some risk factors questions were not asked at every survey (e.g. smoking was only included in Surveys 1 and 2 for the 1921-26 cohort) or questions were asked differently (eg. alcohol consumption in several surveys and/or cohorts and physical activity at Survey 1 for all cohorts). The data are shown for least favourable levels of each risk factor: current smoking, obesity, non/low physical activity. Current smoking Among the 1973-78 cohort the prevalence of smoking increased between Surveys 1 and 2 as some young women did not start smoking until their 20s. From Survey 3 onwards smoking generally declined. However this pattern was not consistent across areas. Initially smoking was markedly higher among young women living in remote areas and although smoking has declined there the rate of decline has slowed in more recent years. Overall the decline is more pronounced in major cities than in rural areas. Among women in the 1946-51 smoking has declined over time. Initially smoking prevalence was higher in outer regional and remote areas but it has declined substantially in these areas, and now in all areas only 10-12% of women in this cohort smoke. Prevalence of smoking among the 1921-26 cohort was below 10% at Survey 1 and it declined further by Survey 2. Since then this group of women have not been asked about their current smoking as so few continue to smoke (based on the results of Survey 2).
- 17 -
Figure 3-1 Current smoking in the 1973-78 cohort and the 1946-51 cohort.
- 18 -
Figure 3-2 Smoking in the 1921-26 cohort.
- 19 -
Obesity Among women in the 1973-78 and 1946-51 cohorts the prevalence of obesity has increased over the study period (Figure 3-3). The increase among the younger women is so pronounced that their levels at Survey 5, when they were aged in their early 30s, are similar to those of the mid-aged women at Survey 1 (when they were aged 45-50). In both cohorts prevalence of obesity is lowest in the major cities and increased with distance away from the cities – this pattern has persisted over time. Among the oldest women, born in 1921-26, the prevalence of obesity increased slightly over time but it has been consistently higher in remote areas than elsewhere (Figure 3-3). Physical Activity Survey questions about physical activity used in ALSWH changed between Surveys 1 and 2 in line with national recommendations. Therefore we do not show the results for Survey 1. The proportions of women reporting taking little or no physical activity increased over time, between Survey 2 and Survey 5, in the youngest and oldest cohorts but decreased in the mid-aged group (Figure 3-4). Among the 1973-78 cohort this gradual increase was consistent across all areas. For women in the 1946-51 cohort the wording of the questions was changed slightly between Surveys 2 and 3 and this may account for the apparent increase prevalence of little or no physical activity. However since then there has been a decline (i.e. an increase in levels of physical activity). Initially low levels of physical activity were more common among women living in major cities but over time this pattern has changed with little difference between areas by Survey 5. The increase in physical inactivity among the 1921-26 cohort is not unexpected as they were in their 80‘s by Survey 5. There is no difference between areas in this group.
- 20 -
Figure 3-3 Obesity in all cohorts.
- 21 -
Figure 3-4 Non/low physical activity in all ALSWH cohorts.
- 22 -
3.2.2.
Chronic conditions
To illustrate the area differences and changes in chronic conditions over time, we present the data as bar graphs showing the percentages of women in each area and cohort who reported that they had the condition at Survey 1 (prevalent cases), the percentage of women who first reported the condition at Surveys 2-5 (incident cases occurring between Surveys 1-5) and the percentage who never reported the condition. For diabetes, both prevalence and incidence were low for the 1973-78 cohort with little difference across areas. Incidence increased across surveys and both prevalence and incidence were associated with higher BMI. For the 1946-51 and 1921-26 cohorts, prevalence and incidence of diabetes increased with distance from major cities. For the mid-aged cohort prevalence and incidence were associated with higher BMI (and with being born in Asia), and incidence increased over time. Differences in prevalence and incidence across areas could be accounted for by differences in BMI. For the older women prevalence of diabetes was strongly associated with BMI and being born in Asia; incidence rates increased over time but differences among areas could be largely explained by BMI and differing levels of physical activity.
- 23 -
Diabetes 1973-78 cohort MajorCities InnerRegional OuterRegional Remote/VeryRemote 1946-51cohort MajorCities InnerRegional OuterRegional Remote/VeryRemote 1921-26 cohort MajorCities InnerRegional
OuterRegional Remote/VeryRemote 0%
20%
prevalent S1
40%
incident S1-S5
60%
80%
100%
disease free
Figure 3-5 Prevalence and incidence of diabetes by area of residence.
Among the 1973-78 cohort initial prevalence of hypertension did not differ much among areas but was associated with higher levels of BMI and smoking. Incidence rates increased over time and were associated with BMI, but again there were no significant area differences. Among the 1946-51 and 192126 cohorts prevalence of hypertension increased with distance from major cities (except in remote areas
- 24 -
for the older women), but these differences were no longer evident once BMI and smoking were taken into account. Incidence rates increased over time and were strongly associated with BMI, but not area of residence.
Hypertension 1973-78 cohort Major Cities Inner Regional Outer Regional Remote/Very Remote 1946-51 cohort MajorCities InnerRegional OuterRegional Remote/Very Remote 1921-26 cohort MajorCities InnerRegional OuterRegional Remote/Very… 0%
20%
prevalent S1
40%
incidence S1-S5
60%
80%
100%
Disease free
Figure 3-6 Prevalence and incidence of hypertension by area of residence.
Prevalence and incidence of asthmas were highest among the 1973-78 cohort and lowest among the 1921-26 cohort. This phenomenon has been found in many countries but remains largely unexplained. In each cohort initial prevalence was highest in major cities and inner regional areas. Among the youngest women, prevalence was associated with higher BMI, cigarette smoking and being born in Australia, and once these factors were taken into account the area differences were not statistically significant. Incidence increased over time and was also associated with higher BMI. Among the 1946-51 cohort initial prevalence was also associated with higher BMI and being born in Australia but
- 25 -
not area of residence. Incidence increased over time and again was most strongly associated with BMI. For the 1921-26 cohort, patterns were similar to those for the other cohorts. Prevalence and incidence were most strongly associated with BMI and a history of smoking, and incidence increased over time. When BMI and smoking were taken into account there were no apparent area differences.
Asthma 1973-78 cohort MajorCities InnerRegional OuterRegional Remote/VeryRemote 1946-51 cohort MajorCities InnerRegional OuterRegional Remote/VeryRemote 1921-26 cohort MajorCities InnerRegional OuterRegional Remote/VeryRemote 0%
20%
prevalent S1
40%
incident S1-S5
60%
Disease free
Figure 3-7 Prevalence and incidence of asthma by area of residence.
- 26 -
80%
100%
Prevalence and incidence of chronic obstructive pulmonary disease (COPD), predominantly bronchitis and emphysema, among the 1921-26 cohort decreased with distance from major cities which is similar to asthma and suggests the possibility of similar aetiology or overlap between the two diagnoses. This pattern is inconsistent with the higher rates of death from COPD in regional and remote areas. The reasons for these area differences are unclear.
Chronic obstructive pulmonary disease 1921-26 cohort MajorCities
InnerRegional OuterRegional Remote/VeryRemote 0%
10%
20%
30%
prevalent S2
40%
50%
incident S2-S5
60%
70%
80%
90%
100%
disease free
Figure 3-8 Prevalence and incidence of chronic obstructive pulmonary disease by area of residence in the 1921-26 cohort.
- 27 -
Osteoporosis is a diagnosis that depends on bone densitometry tests. The higher prevalence and incidence reported in major cities (which is statistically significant for the 1921-26 cohort) is most probably due to better access to the tests rather than differences in the disease.
Osteoporosis 1946-51 cohort MajorCities
InnerRegional
OuterRegional
Remote/VeryRemote
1921-26 cohort MajorCities InnerRegional OuterRegional Remote/VeryRemote 0%
20%
prevalent S1
40%
incident S1-S5
60%
80%
100%
Disease free
Figure 3-9 Prevalence and incidence of osteoporosis by area of residence, 1921-26 cohort and 1946-51 cohort.
- 28 -
3.2.3.
SF36 scores
The figures below show the SF-36 summary (component) scores for physical health (PCS; Figure 3-10) and mental health (MCS; Figure 3-11) – higher scores indicate better health. The various sub-scales of SF-36 show similar effects, or no clear patterns, and are not shown here. For the physical health component scores among women in the 1973-78 cohort there was no consistent trend over time but mean scores were generally lower in inner regional areas than in other areas. In contrast for the 1946-51 cohort there was a clear decline in physical health over time with no differences between areas. For the 1921-26 cohort the decline was even more pronounced, but again with no differences between areas. For mental health component scores among the 1973-78 cohort there was an increase over time. Mean scores were initially lowest in the major cities and highest in remote areas, but over time the area differences became less pronounced. Scores also increased for the 1946-51 cohort, again with scores initially lowest in the major cities and highest in remote areas, but the differences between areas disappeared over time. Mental health scores increased among the 1921-26 cohort from survey 1 to survey 3 but then they declined as the women approached their 80s. As with the other cohorts there was some evidence for higher scores among women in remote areas but the differences were not consistent over time.
3.3. Summary From ALSWH data we showed higher mortality rates overall and from several common conditions in outer regional and remote areas. These results are consistent with many previous reports in Australia. We found higher levels of obesity, diabetes, hypertension and other conditions in regional and remote areas. The differences in chronic conditions could be predominantly explained by BMI differences. Overall scores of self-reported measures of physical and mental health changed over time and across cohorts in expected ways, but were not markedly different across areas.
- 29 -
Figure 3-10 Physical Component Score by area of residence.
- 30 -
Figure 3-11 Mental Component Score by area of residence.
- 31 -
3.4. References Campbell N, Elliott A, Sharp L, Ritchie L, Cassidy J, & Little J. (2001). Rural and urban differences in stage at diagnosis of colorectal and lung cancers. British Journal of Cancer, 84:910-14. Dobson A, McLaughlin D, Vagenas D, & Wong KY. (2010). Why are death rates higher in rural areas? Evidence from the Australian Longitudinal Study on Women‘s Health. Australian and New Zealand Journal of Public Health, 34:624-628. Jack R, Gulliford M, Ferguson J, & Moller H. (2003). Geographical inequalities in lung cancer management and survival in South East England: evidence of variation in access to oncology services? British Journal of Cancer, 88:1025-31. Jong K, Smith D, Yu X, O‘Connell D, Goldstein D, & Armstrong B. (2004). Remoteness of residence and survival from cancer in New South Wales. Medical Journal of Australia, 180:618-22. Luke C, Nguyen A, Priest K, & Roder D. (2004). Female breast cancers are getting smaller, but sociodemographic differences remain. Australian and New Zealand Journal of Public Health, 28: 312-16. Siahpush M & Singh G. (2002). Sociodemographic variations in breast cancer screening behaviour among Australian women: Results from the 1995 National Health Survey. Preventive Medicine,35:175-180.
- 32 -
4.
Access to, use of, and satisfaction with health services by geographic location
In this chapter we focus on access to health services to examine the extent to which this might differ across areas.
4.1. Selected usage, access, satisfaction- health services. 4.1.1.
Visits to GPs
The proportions of women making 7 or more visits (1973-78 cohort and 1946-51 cohort) or 9 or more visits (1921-26 cohort) to a general practitioner (GP) in the past year in each area and for each survey is shown in Figure 4-1, Figure 4-2, and Figure 4-3. In the 1973-78 cohort, there are few differences in the proportions of the cohort with 7 or more visits according to area or by survey. The main differences are observed at Survey 4 and Survey 5 when women in major cities are less likely to have 7 or more visits than women in other areas (these GP visit items were not included in Surveys 2 and 3 for this cohort).
Figure 4-1 Proportions of women making 7 or more visits to a GP – 1973-78 cohort
- 33 -
In the 1946-51 cohort there is an initial trend towards fewer women with 7+ visits in regional and remote areas up until Survey 4 when this trend diminishes. At Survey 4 and Survey 5, women in the remote/very remote areas are most likely to have 7 or more visits.
Figure 4-2 Proportions of women making 7 or more visits to a GP – 1946-51 cohort
- 34 -
The cut-point of 9 or more GP visits was applied for older women in recognition of the higher overall rate of GP use among this age group. In this cohort, there is a clear difference between major cities and other areas, with women in major cities being much more likely to have had nine or more visits per year.
Figure 4-3 Proportions of women making 7 or more visits to a GP – 1921-26 cohort
- 35 -
4.1.2.
Satisfaction with access to GP services
Women‘s ratings of their access to GP services at Survey 5 for each cohort are shown in Figure 4-4, Figure 4-5 and Figure 4-6. Compared with women living in major cities, women living outside of major cities are less likely to rate these access issues as good, very good or excellent, and more likely to rate them as fair or poor. As a general trend, women in the 1921-26 cohort were more likely to give higher ratings than women in the other cohorts; women in the 1973-78 cohort were most likely to give poorer ratings. Most women in major cities rated ease of seeing the GP of their choice as good/very good/ or excellent, however women were less likely to give a favourable rating to this access issue in other areas. A similar pattern was seen for hours when a GP is available, and waiting for an appointment time (not asked of 1973-78 cohort), and access to afterhours medical care. These items are also closely associated indicating that convenient hours of availability may be contributing to women‘s difficulties seeing a doctor of their choice as well as demand for services. Notably, despite their higher overall ratings for these access items, women in the 1921-26 cohorts were as likely as women in the other cohorts to rate after hours medical care as fair or poor. Ratings for the number of GPs available to choose from and access to female GP decreased with increasing remoteness and would reflect the distribution of GPs across urban and remote areas However, the poorer ratings of these items by women in regional areas also suggests a level of inequity of choice for these women. Access to GPs who bulk bill also shows variation across area, and further examination of bulk billing rates for GP services is provided in Section 5.
- 36 -
Figure 4-4 Satisfaction with access to GP services – 1973-78 cohort at Survey 5.
- 37 -
Figure 4-5 Satisfaction with access to GP services for 1945-51 cohort at Survey 5.
- 38 -
Figure 4-6 Satisfaction with GP Services for 1921-26 cohort at Survey 3.
- 39 -
4.1.3.
Visits to Medical Specialists
At Survey 1, visits to medical specialists were more likely for women in the 1921-26 cohort and least likely for women in the 1973-78 cohort (Figure 4-7, Figure 4-8 and Figure 4-9). This reflects the increased need for care for chronic disease and other health concerns as women age. However, at Survey 4 and Survey 5, women in the 1973-78 cohort were as likely to have seen a specialist in the past year as were older women, probably reflecting an increased use of obstetric visits by this cohort as they move into childbearing years. Regardless of age, increasing remoteness of residence was associated with decreased likelihood of visiting a specialist, particularly at Survey 1. However, this pattern varies with more recent surveys, with specialist visits for women living in remote and outer regional areas decreasing over time, and specialist visits for women living in regional areas and major cities increasing over time.
Figure 4-7 Proportion of women who had visited a specialist in the past year – 1973-78 cohort
- 40 -
Figure 4-8 Proportion of women who had visited a specialist in the past year – 1946-51 cohort.
Figure 4-9 Proportion of women who had visited a specialist in the past year – 1921-26 cohort.
- 41 -
4.1.4.
Satisfaction with access to medical specialists
Women‘s ratings of their access to medical specialists for each cohort are shown in Figure 4-10, Figure 4-11 and Figure 4-12.
Figure 4-10 Satisfaction with access to medical specialists at Survey 5 – 1973-78 cohort.
These ratings correspond to the patterns in reported specialist use with women being more likely to rate access as poor or fair with increasing remoteness. Overall ratings of access to specialists increased with the age of the cohort, with the proportion of women giving a good, very good, or excellent rating to this item being highest in the 1921-26 cohort and lowest in the 1973-78 cohort.
- 42 -
Figure 4-11 Satisfaction with access to medical specialists/hospital at Survey 5 - 1946-51 cohort.
Figure 4-12 Satisfaction with access to medical specialist/hospital at Survey 3 – 1921-26 cohort.
- 43 -
4.1.5.
Hospital Admissions
Self-reported hospital admissions (at least one night duration) for the 1921-26 cohort are presented in Figure 4-13. There is little consistent variation by area.
Figure 4-13 Self-reported admissions to hospitals – 1921-26 cohort.
Satisfaction with access to hospitals. As for other services, satisfaction with access to hospitals was rated least highly in remote areas and by women in the 1973-78 cohort. In addition, the area differences in ratings to hospital access were greater in the 1973-78 cohort than in the 1946-51 and 1921-26 cohorts. Indeed there was little difference by area in the 1921-26 cohort.
- 44 -
Figure 4-14 Satisfaction with access to hospitals for the ALSWH 1921-26 cohort, by area of residence.
Figure 4-15 Satisfaction with access to hospitals for the ALSWH 1946-51 cohort, by area of residence.
- 45 -
Figure 4-16 Satisfaction with access to hospitals for the ALSWH 1973-78 cohort, by area of residence.
4.1.6.
Self-reported procedures
Selected self-reported surgical procedures are shown in Figure 4-17, Figure 4-18, and Figure 4-19. Women in the 1946-51 cohort were more likely to report hysterectomy if they were in outer regional and remote areas. Cholecystectomy showed the opposite trend, with women in regional and remote areas being less likely to report this procedure.
- 46 -
Figure 4-17 Self report of hysterectomy, by area of residence – 1946-51 cohort.
Figure 4-18 Self report of cholecystectomy, by area of residence – 1946-51 cohort.
- 47 -
At Survey 1, hip surgery was reported less commonly for women in the 1921-26 cohort who lived in remote areas. This trend has reversed over subsequent surveys.
Figure 4-19 Self report of hip surgery by area of residence – 1921-26 cohort. These data reflect selected usage, access, satisfaction with health services of women, with particular attention paid to variables reflecting age or area of residence differences and trends of note over time. Access to GP‘s displayed varying usage trends for each cohort over time, with younger women in major cities reporting decreasing numbers of GP visits, mid-aged women in the remote/very remote areas reporting increasing numbers of GP visits, and older women in major cities reporting increasing numbers of GP visits over time. Similarly, satisfaction with access to GP services showed varying usage trends for each cohort over time, with women in major cities reporting the highest satisfaction with access issues, including number of GPs available to choose from and access to female GP. Older women were more likely than other age groups to rate their access to after hours medical care as fair or poor. Specialist visits for women living in remote and outer regional areas are tending to decrease over time, while increasing over time for women living in major cities and regional areas. Satisfaction with access to specialists decreased with increasing remoteness and increased with increasing age. Older women reported the most self-reported hospital admission stays of at least one night‘s duration and younger women and women living in more remote areas reported least satisfaction with access to hospitals. Self-reported surgical procedures showed varying trends over time, with hysterectomy more likely and cholecystectomy less likely for mid-aged women in regional and remote areas. For older women living in more remote areas, hip surgery has become increasingly common over time. Overall, women in more remote areas are reporting sustained issues with access and satisfaction with health care services, even in the face of varying trends for numbers of contacts (e.g. GP visits) or for undergoing specific procedures (e.g. hip replacement), over time.
- 48 -
4.2. The management of heart conditions in older rural and urban Australian women In 2004, 944 older urban and rural ALSWH participants born in 1921-26 who had replied in any survey that they had received a diagnosis of heart disease took part in a special sub-study which focused on their treatment. The treatment they reported was compared with national and international clinical guidelines for the management of ischaemic heart disease (IHD), congestive cardiac failure (CCF) or atrial fibrillation (AF) (Krum, 2001; Williams et al., 2002; Lipid management guidelines, 2001; NHMRC, 2001; Snow et al., 2003; Hankey, 2001). The data were also analysed according to whether the women lived in a major city, an inner regional area or outer regional/remote/very remote areas. 4.2.1.
Health Service Use
Figure 4-20 compares three key markers of quality of care for people with IHD. Most women (80%) who reported doctor-diagnosed IHD indicated that they had seen a cardiologist for their heart condition at some time, although women from major cities were more likely to report recent (12 mths 5 yrs/don't know/never
*Age 45-50 at Survey 1, 50-55 at Survey 3, 53-58 at Survey 4, and 56-61 at Survey 5.
Figure 4-28 Self report of time since last Pap test by women in the 1946-51 cohort.
- 77 -
100%
Ease of access to Pap tests Figure 4-29 and Figure 4-30 show women‘s ratings at Survey 5 of the ease of obtaining a Pap test. Women in the 1946-51 cohort were more likely to give a good, very good, or excellent rating to this item than were younger women. The proportion of women giving a fair or poor rating to this item was higher across regional and remote areas, particularly among women in the 1973-78 cohort.
Figure 4-29 Ease of obtaining a Pap test. 1973-78 cohort Survey 5
Figure 4-30 Ease of obtaining a Pap test. 1946-51 cohort Survey 5
- 78 -
Factors associated with having a Pap test Further analyses have been undertaken to assess the effect of area of residence on the probability that women have had a Pap test within the past 2 years, after accounting for other socio-demographic factors. For women in the 1973-78 cohort, the probability of having a Pap test in the past 2 years was higher at Surveys 2, 3, 4 and 5 than at Survey 1, with the greatest difference being between Survey 1 and Survey 2. In contrast, the probability of having a Pap test decreased with each survey for women in the 1946-51 cohort. Area of residence was a significant factor for women in the 1973-78 cohort, but not for women in the 1946-51 cohort. Women in the 1973-78 cohort who lived in inner and outer regional areas were around 10% more likely to have had a Pap test within the two year time frame than women living in major cities. Other factors affecting the probability of having a Pap test in the last two years for this cohort were marital status, education, employment, health insurance and parity. Compared to married women, widowed/separated/divorced women were around 21% less likely to have a Pap test, and single women were around 56% less likely. Compared to women with no formal educational qualifications or with a school certificate only, women were less likely to have a Pap test in the last two years if they had achieved the higher school certificate, and more likely to have a Pap test if they had university or higher education. Women working less than full time were less likely to have a Pap test than women working full time. Women with private hospital insurance were more likely to have a Pap test than those who did not have this cover, and women were more likely to have a Pap test if they had 1-3 children (compared to no children), but not if they had more than 3 children. Fewer factors were associated with Pap tests among women in the 1946-51 cohort. Compared to married women, women were less likely to have a Pap test if they were separated, divorced or widowed, and much less likely to have a Pap test if they had remained single. Hospital insurance was associated with increased probability of having a Pap test, and women with children (1 or more births) were also more likely to have a Pap test than nulliparous women (no births).
- 79 -
Table 4-9 Factors associated with having a Pap test in the past 2 years. 1973-78 and 1946-51 cohorts. 1973-78 cohort Pap test
1946-51 cohort Pap test
Variable
OR (95% CI)
OR (95% CI)
Survey
1
1
Survey 1 (ref)
1
1
Survey 2
1.70 (1.58, 1.83)*
1.01 (0.95,1.08)
Survey 3
1.78 (1.64, 1.93)*
0.99 (0.93,1.06)
Survey 4
1.49 (1.36, 1.62)*
0.87 (0.81,0.93) *
Survey 5
1.44 (1.31, 1.58)*
0.87 (0.81,0.93) *
Area of residence (ARIA)** Major city
1 (reference)
Inner regional
1.24 (1.14, 1.33)*
Outer regional
1.34 (1.21, 1.49)*
Remote/v. Remote
1.21 (0.98, 1.50)
Marital status Married/de facto
1 (reference)
Sep/div/widow
0.79 (0.70, 0.90)*
1 0.82 (0.75,0.89) *
Single
0.45 (0.42, 0.47)*
0.50 (0.42,0.60) *
Education No formal qualification/sc
1 (reference)
HSC
0.81 (0.75, 0.88)*
Trade/diploma
1.02 (0.94, 1.11)
Higher educ.
1.10 (1.01, 1.20)*
Work Full time
1 (reference)
Part-time
0.83 (0.79, 0.88)*
Other
0.73 (0.69, 0.77)*
Health insurance No private insurance
1 (reference)
Private hospital insurance
1.14 (1.09, 1.20)*
1 1.38 (1.29,1.47) *
Parity 0 births
1 (reference)
1-3 births
1.545 (1.45, 1.66)*
1 1.52 (1.33,1.73) *
>3 births
1.22 (1.00, 1.48)
1.21 (1.04,1.42) *
*statistically significant p5 yrs/don'tknow/never
*Age 45-50 at Survey 1, 50-55 at Survey 3, 53-58 at Survey 4, and 56-61 at Survey 5
Figure 4-31 Self report of time since last Mammogram by women in 1946-51 cohort.
- 82 -
100%
Ease of obtaining a mammogram. Most women in the 1946-51 cohort rated the ease of obtaining a mammogram as good, very good or excellent. However, women in remote areas were less likely to give a favourable rating to this item than women in major cities. .
Figure 4-32 Ease of obtaining a Mammogram. 1946-51 cohort Survey 5
Factors associated with mammograms Further analyses were undertaken to assess the effect of area of residence on the probability that women have had a mammogram within the past 2 years, after accounting for other sociodemographic factors (see Table 4-10). Women in this cohort were more likely to have a mammogram over time, and as they aged, with women being around 4 times as likely to report a mammogram at Survey 5 as at Survey 1. Women in remote areas were more likely to have a mammogram in the last 2 years than women in major cities, an interesting finding in light of the finding that they were the most likely to report fair or poor access to this type of service. Other factors associated with having a mammogram in the past 2 years included education (women with tertiary or higher education were less likely to have had a mammogram) and marital status (widowed, divorced, separated and single women were less likely to have had a mammogram). Women with private hospital insurance were more likely to have had a mammogram, and women were less likely to have had a mammogram if they had 3 or more children.
- 83 -
Table 4-10 Factors associated with having a mammogram in the past 2 years. 1946-51 cohort. 1946-51 cohort Mammogram Variable
OR (95% CI)
Survey Survey 1
1 (reference)
Survey 2
1.44 (1.35, 1.54)*
Survey 3
2.69 (2.48, 2.93)*
Survey 4
3.38 (3.10, 3.69)*
Survey 5
3.77 (3.44, 4.13)*
Area of residence (ARIA+)** Major city
1 (reference)
Inner regional
0.92 (0.85, 0.99)*
Outer regional
1.04 (0.94, 1.14)
Remote/v. Remote
1.43 (1.19, 1.71)*
Marital status Married/de facto (ref)
1 (reference)
Sep/div/widow
0.80 (0.75, 0.85)*
Single
0.73 (0.63, 0.85)*
Education None/sc
1 (reference)
HSC
0.95 (0.88, 1.02)
Trade/diploma
0.95 (0.88, 1.02)
Higher educ.
0.81 (0.74, 0.87)*
Health insurance No private insurance
1 (reference)
Private hospital insurance
1.36 (1.30, 1.43)*
Parity 0 births
1 (reference)
1-3 births
1.01 (0.91, 1.12)
>3 births
0.83 (0.74, 0.94)*
*statistically significant p