Paper No. 992169 An ASAE Meeting Presentation
Laboratory Evaluation of Soil Moisture Sensors by
S. Proulx
R. Sri Ranjan
G. Klassen
Dept. of Biosystems Engineering University of Manitoba Winnipeg, MB R3T 5V6
Dept. of Biosystems Engineering University of Manitoba Winnipeg, MB R3T 5V6
Soils and Crops Branch Manitoba Agriculture Carman, MB R0G 0J0
Written for presentation at the 1999 ASAE/CSAE-SCGR Annual International Meeting Sponsored by the ASAE
Sheraton Centre Hotel Toronto, Ontario, Canada July 18-21,1999
SUMMARY: In irrigation water management, soil moisture content data is needed to ensure higher water use efficiencies and to achieve better yields. Properly scheduled irrigation can conserve water and energy and also minimize the potential for groundwater contamination. The objective of this project was to compare different kinds of soil moisture sensors for their accuracy, reliability, and ease of use. Five different probes, namely, VIRRIB, Aquaterr, Aqua-Tel, tensiometer, and Watermark sensors were tested in a laboratory scale weighing-type lysimeter under controlled conditions in the 17% to 34% volumetric water content range. Even though the Watermark slightly overestimated the water content, it followed the 1:1 line over a narrow range of 20-26% of water contents. The tensiometers were found to be reliable only in the 23-30% range. The VIRRIB sensors under-predicted the water content by 3-7% by volume over the entire range with wide variability. The Aquaterr readings were found to follow the 1:1 line in the 24-30% water content range. The Aqua-Tel sensors gave good estimates of volumetric water content below 30%. It was observed that the Aqua-Tel and Aquaterr were affected by the soil temperature. Further testing, however, is needed to determine the extent of the temperature effect. No single soil moisture sensor measured the water content accurately in the entire range. Each type had its own narrow range of water contents where the readings were close to the actual water content.
KEYWORDS: VIRRIB, Aquaterr, Aqua-Tel, tensiometer, Watermark, Sensors, Weighing-type lysimeter The author(s) is solely responsible for the content of this technical presentation. The technical presentation does not necessarily reflect the official position of ASAE, and its printing and distribution does not constitute an endorsement of views which may be expressed. Technical presentations are not subject to the formal peer review process by ASAE editorial committees; therefore, they are not to be presented as refereed publications. Quotation from this work should state that it is from a presentation made by (name of author) at the (listed) ASAE meeting. EXAMPLE: From Author's last name, Initials. "Title of Presentation". Presented at the Date and Title of meeting, Paper No. X. ASAE, 2950 Niles Rd., St. Joseph, MI 49085-9659 USA. For information about securing permission to reprint or reproduce a technical presentation, please send inquiries to ASAE. ASAE, 2950 Niles Rd., St. Joseph, MI 49085-9659 USA Voice: 616.429.0300 FAX: 616.429.3852 E-Mail:
Laboratory Evaluation of Soil Moisture Sensors S. Proulx, R. Sri Ranjan1, and G. Klassen
INTRODUCTION In irrigation water management, soil moisture content data is needed to ensure higher water use efficiencies and to achieve better yields. Properly scheduled irrigation can conserve water and energy and also minimize the potential for groundwater contamination. Several sources of information are available to help farmers make irrigation decisions. Weather measurements, weather forecasts, soil-water status, and plant measurements provide producers with useful data. Combinations of these are often used, with soil moisture being the most common reliable indicator of irrigation needs. Many methods such as gravimetric sampling, lysimeters, tensiometers, neutron probes, resistance meters, capacitance meters, heat dissipation sensors, time domain reflectometry (TDR), and infrared probes can be used to determine soil water conditions. The most suitable methods to monitor the need for irrigation have yet to be determined. The best methods should measure soil water accurately and quickly, should be appropriate for installation in potato fields, and should be easy to use. During the summer of 1998, a field study was carried out in two types of soils to evaluate the performance of tensiometers (Soilmoisture Equipment Corp., Model 2710AR), Watermark electrical resistance sensors, also called granular matrix sensors, (Irrometer Co.), Aqua-Tel electrical capacitance sensors (Automata Inc., model Aqua-Tel94-29), the Aquaterr portable capacitance probe (Aquaterr Instruments, model 200), and VIRRIB phase transmission sensors (Environmental Sensors Inc.). Different installation patterns, i.e. orientation of the sensors, were also included as treatments. Soil moisture data obtained with the different methods were compared with the gravimetric sampling. However, the 8% standard error of the volumetric water content of the samples collected from the field using the gravimetric method indicates a wide variability in water content of the soil under field conditions. Based on the results of the field study, further testing under controlled conditions was recommended (Proulx et al. 1998). Consequently, a laboratory study was carried out to test the sensors under controlled conditions.
1
The corresponding author’s e-mail:
[email protected] 2
The objective of the laboratory study was to evaluate the performance of soil moisture sensors under controlled soil moisture conditions. The same sensors that were used in the field study were compared using a weighing-type lysimeter filled homogeneously with soil from the field test site. LITERATURE REVIEW Despite the wide array of soil moisture sensors available in the market, very few studies comparing soil moisture sensors have been reported in the literature. Yoder et al. (1998) compared the performance of the Troxler neutron gage, Troxler Sentry 200-AP capacitance probe, Aqua-Tel capacitance sensors, time domain reflectometry, gypsum blocks, Watermark electrical resistance sensors, and Agwatronics heat dissipation blocks under controlled soil moisture conditions. The results of their study selected Aqua-Tel, Sentry, neutron gauge, and Watermark sensors in the order of decreasing performance for accuracy, reliability, durability and ease of installation. Their study was carried out in a 0.74 m high soil column whose weight was monitored using a load cell. When the depth of the soil column is high, it is difficult to maintain a uniform moisture content as a function of depth due to gravitational effects. In addition, it is much easier to dry a shallower soil more uniformly compared to a deeper soil. Therefore, in the present study, a shallower depth of soil was chosen to provide a uniform vertical distribution of moisture content. Eldredge et al. (1993) conducted an experiment in a potato field comparing the readings of soil water obtained with granular matrix sensors to tensiometer, neutron probe, and the results obtained by gravimetric sampling. The Watermark was found to match the performance of the tensiometers. However, they are more suited for automatically starting an irrigation system at known soil water potential. The conversion of soil water potential to volumetric water content requires the soil moisture characteristic curve for the particular soil. Phene et al. (1989) reported the use of a soil matric potential sensor (SMPS) for automatically initiating irrigation when the soil matric potential has reached a preset level. They found a linear response between -10 ± 3.3J/kg and -300 ± 5.5 J/kg (J/kg = kPa = centibars). Stieber and Shock (1995) evaluated the performance of Watermark sensors in potatoes growing in a silt loam soil. They found the ideal location of the sensors to be 0.15 m offset from the centre of the hill and buried at a depth of 0.1 - 0.2 m. The sensors responded within four hours of wetting and within 12 hours to drying. Sensors placed deeper than 0.3 m responded
3
slowly and inconsistently. However, the sensors placed below 0.3 m could be used to alert irrigators to increased deep percolation risk. Tensiometers and granular matrix sensors have been widely used and several research projects evaluated their performance as a tool for triggering irrigation events (Phene et al. 1989; McCann et al. 1992; Shock and Barnum 1993; Stieber and Shock 1995). However, very little information has been found in the literature on the VIRRIB, Aquaterr, and Aqua-Tel capacitance sensors. Litschmann (1991) tested the VIRRIB to verify accuracy, repeatability of results, independence of other effects, and long-term stability of the sensing device. The present study provides more information on these sensors. Theoretical basis of operation Gravimetric method The gravimetric method requires sampling of the soil and immediate weighing of the moist sample. The sample is then dried at 105 °C for 24 h in a convection oven and weighed again after cooling in a desiccator. The mass basis water content of the sample is calculated using:
θm =
mw ms
(1)
where: 2m
= gravimetric water content (decimal fraction),
mw
= mass of water contained in the sample (kg),
ms
= mass of dry soil in the sample (kg).
To determine the volumetric water content of the soil, the gravimetric water content is multiplied by the ratio of soil bulk density to water density. For a water density of 1000 kg/m3, the relationship is simplified as follows:
θv = θm • ρ b
(2)
where: 2v
= volumetric water content (decimal fraction),
Db
= bulk density of dry soil (kg@m3).
Tensiometer Tensiometers give direct measurements of the soil water potential which can also be called soil water tension or soil matric potential. The tensiometer consists of a ceramic cup connected to
4
a vacuum gauge by a rigid tube. The tube can vary in length allowing for measurement at various depths in the soil. Prior to installation, the tube is filled with de-aired water and the water is allowed to saturate the porous tip of the tensiometer. A suction pump is then attached to the tube to remove the dissolved air from the porous tip as well as the water column within the tensiometer to ensure that most of the dissolved air is evacuated from the system. Water is poured into the stem to top it up to the O-ring seal. The cap is screwed into place carefully without trapping any air in the tensiometer. The tensiometer is now sealed and ready to be installed. Once buried in the soil, the water contained in the porous cup reaches equilibrium with the soil water. Thus, in a completely saturated soil, the gauge of the tensiometer would indicate zero since the free soil water would be in equilibrium with the water contained in the tip. In unsaturated conditions, the soil contains less water and consequently has a higher capillary tension. This creates a tension on the water contained in the ceramic cup which releases water until the tension within the cup is equal to the tension existing in the surrounding soil. The reading on the gauge of the tensiometer then indicates the soil water tension. The tensiometer tested is manufactured by Soilmoisture Equipment Corp. (PO Box 30025, Santa Barbara, CA 93105, USA) and is distributed in Canada by Hoskin Scientific (239 East 6th Ave., Vancouver, B.C.). It can measure soil matric potential from saturation to approximately %85 kPa (Soilmoisture Equipment Corp., 1984). This is the limit at which the high soil water potential exceeds the air entry pressure of the porous ceramic cup causing air to break through the largest pores in the cup. At this point, the gauge will indicate zero and the tensiometer reading is no longer useful. At this stage, the tensiometer has to be refilled and a vacuum re-established prior to further use. Watermark granular matrix sensors Watermark sensors give indirect readings of the soil water potential based on the measurement of electrical resistance. This moisture sensor consists of two concentric electrodes embedded in a porous matrix. The matrix is composed of loose granular material held in place with a permeable membrane covered by a perforated metal case. A solid gypsum wafer divides the granular material in two sections. In the lower section of the sensor, the soil solution is allowed to move freely in and out of the sensor. In the upper section, however, the granular material is isolated from the surrounding soil. This way, the soil solution has to travel through the lower
5
section and the gypsum wafer, which will buffer the effect of salinity, before entering the section that contains the electrodes. The granular matrix sensor operates on the principle that the movement of water in a porous medium is a function of the pore sizes of the material and the electrical resistance of that medium is a function of its water content, which can also be expressed as water potential. This means that the movement of water in a granular matrix with pore sizes still remaining wet similar to that of the surrounding soil closely represents the movement of the soil solution. The electrical resistance of the sensor is therefore an indirect measurement of the soil water potential. Watermark sensors cover a range of water potentials from 0 to 200 kPa (Irrometer Co., Box 2424, Riverside, CA 92516, USA). Aqua-Tel and Aquaterr, electrical capacitance meters Capacitance type soil moisture sensors rely on the relationship between the dielectric constant and the water content of the soil. The dielectric constant of the soil is the dielectric constant of a combination of minerals, water, and air. The dielectric constant of water is 78, whereas it does not exceed 10 for most of the soil minerals and has a value of about 1 for air (Hanks and Ashcroft, 1980). A variation in water content changes the ratio of the mineral-water-air combination and therefore its dielectric constant. A capacitance sensor consists of a pair of electrodes connected to an oscillator. Once the electrodes have been positioned in the soil, the sensor is activated using radio frequency and the surrounding soil forms the dielectric of a capacitor completing an oscillating circuit (http://www.sowacs.com/sensors/capacitance.html, Sept. 1998). A change in the dielectric causes a shift in frequency that is measured as a change in electrical capacitance. The Aqua-Tel (Automata Inc., 10551 E. Bennett Road, Grass Valley, CA 95945-7806, USA) and the Aquaterr (Aquaterr Instruments Inc., 3459 Edison Way, Fremont, CA 94538, USA) are two types of capacitance sensors. The Aqua-Tel (Model: Aqua-Tel94-29) consists of two parallel electrodes attached to a small electronic module. The unit is buried in the soil for the entire season. The 0.83-m long electrodes are flat and made of stainless steel. The readings obtained with this sensor are converted to volumetric water content using the calibration curves for different soil types published by Automata Inc. The Aquaterr is a portable electrical capacitance probe. The electrodes are encapsulated in the tip of a rigid metal stem attached to the meter. Readings can be interpreted depending on the soil type using calibration curves provided by the manufactures.
6
VIRRIB The VIRRIB is a moisture sensor manufactured in the Czech Republic and distributed in North America by Environmental Sensors Inc. (PO Box 720698, San Diego, CA 92172-0698, USA). The sensor uses a DC current sent through the soil to measure its water content. VIRRIB gives the volumetric water content of the soil based on the proportional relationship that exists between the intensity of the output current and the volume of moisture (Litschmann, 1991). It reads within a range of 0 to 55% (Environmental Sensors Inc.). The sensor consists of two rod electrodes shaped as concentric circles with an outer ring of 0.28 m diameter and an inner ring of 0.20 m diameter.
METHODOLOGY
The different kinds of soil moisture sensors were tested under controlled conditions in a specially designed laboratory-scale lysimeter. Three sensors each were selected from AquaTel, VIRRIB, tensiometer, and Watermark for testing. One Aquaterr was used to measure the soil moisture content at three different positions within the lysimeter. The following sections describe the construction of the lysimeter, the layout of the sensors, and the calibration and data collection protocol.
Design of the lysimeter To maintain uniformity of moisture within the soil profile, the maximum depth of the soil within the lysimeter was limited to 0.2 m. This was well below the displacement pressure of the soil selected for testing. Therefore, the soil water was expected to be uniformly distributed anywhere within the soil profile. The lysimeter was designed with a hydraulic weighing system to facilitate the continuous monitoring of the water content of the soil (Fig.1). This design was preferred over the other weighing systems because of its simplicity and low cost. The soil container was an open box, consisting of a 1.1 m long, 1.1 m wide, and 0.27 m deep wooden box with an open bottom. The required dimensions of the container were selected based on the effective volume of each soil moisture sensors, i.e. the soil region that affects the measurements. Figure 1 also shows the location of the tensiometers and the Watermark sensors. The layout of the Aqua-Tel and VIRRIB sensors in the container is shown in Fig. 2. The interior of the wooden frame is lined with a polyethylene sheet to prevent the
7
wood from absorbing the water from the soil bulk. A steel grate was attached to the bottom of the box to provide support to the soil. A 0.013-m mesh acrylic grid, 0.013 m thick, was placed on the steel grate as a support for the permeable fibreglass mesh. The fibreglass mesh was in three layers to provide adequate support for the soil while allowing for good drainage and air exchange through the bottom. The 0.2 m layer of soil could dry both from the top and bottom surface. Another wood box, on which the soil container described above rests, constituted the drainage collector. One side of the box had an opening 0.14 m high along its entire length to provide an exit for the drained water as well as a channel for air to circulate through the soil. A polyethylene sheet collector stapled to the bottom of the soil bin, intercepted the water draining from the soil and led it outside the lysimeter. This was done to ensure that all the water within the lysimeter remained within the soil. The bottom wooden frame was fastened to a plywood sheet which acted as a base. The base provided more stability to the structure and uniformly distributed the weight of the lysimeter on the weighing device. The weighing system consisted of a hydraulic load cell connected to a manometer. An inner tube filled with water was used as the hydraulic load cell. The inner tube was made of butyl rubber and had an outside diameter of 0.915 m and an inside diameter of 0.485 m when totally deflated. The lysimeter was filled with soil brought from the field study site at the Manitoba Crop Diversification Centre at Carberry, Manitoba. The soil is a loam (31.5% sand, 42.2% silt, and 23.1% clay) from the Ramada series. A uniform bulk density of 1200 kg/m3 was achieved by packing the soil in the container in small equal sized lifts. The dry soil was uniformly added and packed in the lysimeter to ensure uniform bulk density within the test area. A calibration of the weighing system was required to establish a relationship between the mass of the lysimeter and the fluid pressure inside the hydraulic load cell. The weighing system was calibrated by placing weights incrementally, up to the maximum saturated soil weight. This relationship can be expressed in height of water-column as a function of change in weight of the soil and therefore the change in soil water content. The calibration curve was also verified by measuring the soil water content with gravimetric sampling for different hydraulic pressures read on the manometer during the course of the test. During the experiment, air was blown through the bottom of the soil to increase the drying rate. The fan was stopped and a
8
polyethylene sheet was used to cover the soil to prevent evaporation during the 12 hour time period allowed for equilibration of the soil moisture during each drying step.
Installation of the sensors Three sensors of each type were installed in the lysimeter. The spatial arrangement of the sensors is shown on fig. 3. The VIRRIB and Aqua-tel sensors were installed at a depth of 0.10 m while filling the soil box. The tensiometers and Watermark sensors were installed at a depth of 0.13m in a saturated condition. An area of the lysimeter was predetermined for the testing of the Aquaterr which is a portable probe.
Data collection protocol Data were collected 24 times over a period of 34 days. Soil samples were taken on five occasions for the gravimetric method. The location of each sample was randomly chosen and the location documented each time to avoid disturbing the soil too much. The Aquaterr required onsite-calibration for temperature. The probe was submerged into a bucket of water and the meter set to 100 between each set of readings. The temperature of the water used for calibration was monitored and kept within three Celsius of the soil temperature. The Watermark required that soil temperature be entered in the meter so that it automatically calibrated the sensor for temperature. The other moisture sensors did not require any onsite calibration.
Data conversion to volumetric water content Only the VIRRIB sensor gave direct readings of volumetric water content. The tensiometers and the Watermark sensor readings were in soil moisture tension units, centibars and kPa, respectively. These readings had to be converted to the volumetric water content using the soil moisture characteristic curve for the particular soil. This conversion was necessary to make the comparison with the lysimeter. The soil moisture characteristic curve, which shows the volumetric water content as a function of the capillary pressure, was determined using a pressure plate apparatus as well as the capillary cell method. The curve was used to convert tension readings to volumetric water content data. The data collected with the Aqua-Tel were converted to volumetric water content using a calibration equation developed by the authors. The equation was established from the
9
statistical analysis of the numerical values derived from the curves published by Automata Inc. From the statistical analysis of the calibration curves presented in the user manual, the volumetric water content value, 2v, was found to be dependent only on the meter readings, R, and the proportion of sand (%), S, with a significance of 97% (R=0.976). This relationship is expressed by the following equation, 2v = -2.698 + 66.237R - 170.003R3 + 154.197R4 + 4.257*10-8S4 The Aquaterr readings also had to be transformed to volumetric water content, 2v. The relationship between the meter readings and the volumetric water content was estimated based on data in the user manual published by the Aquaterr Instruments for a loam soil. The volumetric water content at the permanent wilting point was found to be 18.5% which corresponded to a reading of 55 in the meter. Similarly, at field capacity, a reading of 90 was taken to represent a volumetric water content of 37.0%. A reading of 100 corresponded to 55.1% by volume. The water content corresponding to the field capacity and permanent wilting point were read from the characteristic curves for a matric potential of 33 kPa and 1500 kPa, respectively. A new calibration curve was generated to translate the Aquaterr meter readings to volumetric water content of the soil.
RESULTS AND DISCUSSION
The sensor readings were compared with the lysimeter readings (gravimetric method) converted to the volumetric water content. The evaluation was carried out at moisture contents ranging from 17 to 34% by volume. Volumetric water contents measured with the different types of moisture sensors were plotted against those measured using the laboratory lysimeter as shown in figs. 4 and 5. Each point shown in these figures represents the average of the readings from three different sensors except for the Aquaterr which is portable. For the Aquaterr, however, each point represents the mean of readings taken at three different locations within the lysimeter on a given occasion. The error bars represent the standard error of the mean for each type of sensor. Wherever the error bars are not visible in the graphs, they are smaller than the height of the symbol. The standard error calculated for the water content measured with the lysimeter did not exceed 0.6% of volumetric water content. The tensiometers performed well in the 23-30% range of volumetric water content (Figure 4). The tensiometers did not give measurements lower than 23% of volumetric water
10
content, which corresponds to approximately -85 kPa, their limit of operation according to the manufacturer. It should be noted that the tensiometer readings remained at 23% when the actual water content ranged from 17% to 25%. Both tensiometers and Watermark sensors greatly overestimated volumetric water content above 31%. The Watermark sensors overestimated volumetric water content for the whole experiment although closely measuring volumetric water content in the 20-26% range. The Aquaterr probe performed well for volumetric water content in the 24-30% range . The large error bars signify the high variability of the readings. When the actual water content ranged from 17 to 24%, the Aquaterr reading ranged from about 18 to 21%. Therefore, the Aquaterr readings can be considered to be less sensitive for water contents below 24%. The Aqua-Tel sensors gave measurements closely matching the 1:1 line for volumetric water content below 30%. However, the Aqua-Tel readings were unresponsive at water contents higher than 30%. The VIRRIB sensors gave readings which were about 3-7% less than the actual water contents. One of the VIRRIB sensors gave very good results in the 18-24% range. Although only one of the three VIRRIB sensors gave good estimates of volumetric water content, all sensors gave measurements following the same trend.
CONCLUSIONS Tensiometer and Watermark sensor readings were converted from soil matric potentials to volumetric water contents using the soil moisture characteristic curve determined in the laboratory. The soil moisture characteristic curve was also used in the conversion of the Aquaterr readings. The performance of those sensors was, therefore, directly dependent on the accuracy of the soil moisture characteristic curve. Both the tensiometer and the Watermark sensor followed the 1:1 line only for a narrow range of water contents. Even though the Watermark slightly overestimated the water content, it followed the 1:1 line over a narrow range of 20% to 26% of water contents. The tensiometers were found to be reliable only in the 23% to 30% range. The error bars are relatively short, indicating that both tensiometer and Watermark sensors gave repeatable readings. The results obtained with the VIRRIB sensors indicate that the calibration of each sensor is critical. The VIRRIB sensors under-predicted the water content by 3% to 7% over the entire range. The Aquaterr readings were found to be less sensitive for water contents below
11
24%. The Aqua-tel sensors gave good estimates of volumetric water content below 30%. It was observed that the results were affected by soil temperature. Further testing, however, is needed to determine the extent of the temperature effect. No single soil moisture sensor seemed to measure the water content accurately in the entire range. Each type had its own narrow range of water contents where the readings were close to the actual water content. REFERENCES Eldredge, E.P., C.C. Shock, and T.D. Stieber. 1993. Calibration of granular matrix sensors for irrigation management. Agronomy Journal 85:1228-1232. Hanks, R.J. and G.L. Ashcroft. 1980. Applied Soil Physics: Soil Water and Temperature Applications, Logan, UT: Springer-Verlag. Litschmann, T. 1991. VIRRIB®: A soil moisture sensor and its application in agriculture. Communications in Soil Science and Plant Analysis 22(5&6): 409-418. McCann, I.R., D.C. Kincaid, and D. Wang. 1992. Operational characteristics of the Watermark model 200 soil water potential sensor for irrigation management. Applied Engineering in Agriculture 8(5):603-609. Phene, C.J., C.P. Allee, and J.D. Pierro. 1989. Soil matric potential sensor measurements in real-time irrigation scheduling. Agricultural Water Management 16:173-185. Proulx, S., R. Sri Ranjan, and G. Klassen. 1998. Evaluation of soil moisture sensors in potato fields. Presented at the September 24-26 North Central Region Intersectional Meeting, Paper No. SD98-118. ASAE, 2950 Niles Rd. St. Joseph, MI 49085-9659 USA. Shock, C.C. and J.M. Barnum. 1993. Calibration of soil sensors for potato irrigation. (Abstract) American Potato Journal 70:840. Stieber, T.D. and C.C. Shock. 1995. Placement of soil moisture sensors in sprinkler irrigated potatoes. American Potato Journal 72:533-543. Yoder, R.E., D.L. Johnson, J.B. Wilkerson, and D.C. Yoder. 1998. Soil water sensor performance. Applied Engineering in Agriculture 14(2):121-133.
12
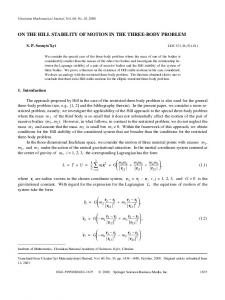
Figure 1 Weighing-type lysimeter with a drainage water collection system.
Figure 2 Layout of the Aqual-Tel and VIRRIB sensors during installation.
13
Figure 3.
Schematic layout of the soil moisture sensors inside the soil container (plan view). Tensiometers are identified by the letter T and Watermark sensors, by W. The shaded area represents the surface available for testing the Aquaterr.
14
Water content by the sensors (%)
40
Tensiometer Watermark
35
1:1
Lin
e
30 25 20 15 10 15
20 25 30 35 Actual volumetric water content (%)
Water content by the sensors (%)
Figure 4 Comparison of Tensiometer and Watermark sensors
40
Aquaterr Aqua-Tel VIRRIB
35
e Lin 1:1
30 25 20 15 10 15
20 25 30 35 Actual volumetric water content (%)
Figure 5 Comparison of Aquaterr, Aqua-Tel, and VIRRIB sensors. 15