Digest Journal of Nanomaterials and Biostructures
Vol. 6, No 2, April - June 2011, p. 643-652
PREPARATION OF POLYURETHANE MICROSPHERES BY ELECTROSPRAY TECHNIQUE S. VLADa*, C. CIOBANUa, M. BUTNARUb, D. MACOCINSCHIa, D. FILIPa, L. M. GRADINARUa, M. MANDRUc a ”Petru Poni” Institute of Macromolecular Chemistry, 41A Grigore Ghica Voda Alley, 700487, Iasi, Romania b Faculty of Medical Bioengineering, ’’Gr. T. Popa’’, University of Medicine and Pharmacy, 16 University Street, 700115 Iasi, Romania c Technical University “Gh. Asachi”, Department of Chemical Engineering and Environmental Protection, 73 Dimitrie Mangeron Street, 700050, Iasi, Romania
In this paper some polyurethane membranes were prepare by electrospraying process to obtain biocompatible materials. The polyurethanes utilized in this study were synthesized from hexamethylene diisocyanate (HDI), polytetramethylene ether glycol (PTMEG) and butanediol (BD) filled with different proportion of hydroxypropyl cellulose (HPC), by polyaddition in dimethylformamide (DMF) as solvent. Molar ratio of Polyether: Diisocyanate: Glycol of 1:4:3, provide a concentration of urethane groups about of 3x10⁻³ mole/g. These polyurethane membranes were made by electrospraying technique from a solution of 20% w/w, at 25 kV voltages and a distance between needle and ground collector about of 15 cm. The structure of polymers was confirmed by Fourier transform infrared spectroscopy (FT-IR) analysis. The morphology of electrospun membranes were analyzed by scanning electron microscopy (SEM). Thermogravimetric analysis (TGA) and differential scanning calorimetry (DSC) were used for thermal characterization. Contact angles measurements in connection with the study for biological behaviour was performed. (Received February 28, 2011; accepted March 21, 2011) Keywords: Polyetherurethane, Electrospraying, Hydroxypropyl cellulose, Biomedical applications.
1. Introduction The manufacture of a biomaterial scaffold is of great importance for successful tissue engineering. Micro and nanotechnologies find numerous applications in various fields and are particularly suitable for biomedical applications as diagnostic techniques, drugs delivery, and prostheses and implants [1-3]. International research attempt developed an important range of micro and nanomaterials aimed at improving health care and production of advanced medical devices [4, 5]. Electrospraying is a polymer spraying technique with an electric field, which would produce spheres of polymers in microscale to nanoscale [6-10]. Note the last time a great interest in using of polyurethanes as biomaterials [11-22]. Moreover, depending on polymer characteristics being used, a wide range of fabric properties such as strength, weight and porosity, surface functionality, etc. can be achieved. This technique also provides the capacity to lace together a variety of polymers to produce ultra-thin layers. Small amounts of drugs or bacterial agents can be add to the polymer solution and encapsulated in nonwoven mats [23]. Cellulose and they derivatives are of a great interest in obtaining new biomaterials. As a result, the composites based on cellulose derivatives are frequently used in design and construction of medical devices. Due to new properties of these polyurethane composites it is possible to design * Corresponding author:
[email protected]
644
new materials that offer better quality, such as specific biodegradability or biostability [24]. Therefore, introducing of natural components in a synthetic polymer matrix, have as result obtaining of biomaterials. So, owing to their biocompatibility and degradability, the polyurethane composites are recommended as membranes for dialysis, in cardio-vascular surgery as vascular prostheses, artificial heart components, orthopaedic prostheses etc [25]. The aim of this study is to prepare some polyurethane microspheres (PUMs) through electrospray technique. Due to high porosity and interconnected structure, the electrospun membranes are suitable for biomedical applications. 2. Experimental 2.1. Materials The materials used in this work were Terathane 1400 (polytetramethylene ether glycol PTMEG - generous gift from INVISTA BV, Nederland), Mw 1374 g/mol, mp 35-40 oC, water 115 ppm, hydroxyl number 81.7 mgKOH/g; 1,6 – hexamethylene diisocyanate - HDI –Fluka, Mw 168.2, bp 255 oC, d 1.05, nD20 1.453; 1,4-butane diol – BD – Fluka, Mw 90.12, nD20 1.446, d 1.017; hydroxypropyl cellulose - HPC- Aldrich, average Mw ~80,000, average Mn ~10,000, powder, 20 mesh particle size (99% through); N,N-dimethylformamide (DMF) - Fluka. Commercial DMF was dried over anhydrous K2C03, and then was distilled from calcium hydride (CaH2) and kept over 4 Å molecular sieves. Polyol and chain extender were checked for moisture and if it was necessary, it was lowered at 0.3%. Other chemicals were used as received, without further purification. 2.2. Characterization FT-IR spectra were measured on a Bruker Vertex 70 FT-IR instrument, equipped with a Golden Gate single reflection ATR accessory, spectrum range 600-4000 cm-1, at ambient temperature. Thermal stability was studied with Mettler Toledo TGA-SDTA 851e thermal analyser apparatus. All measurements were carried out in inert atmosphere under constant purging of nitrogen at a 20 mL/min flow rate. The weight of the sample used was situated between 3, respectively 5 mg. Thermogravimetric data were recorded in the temperature range of 25°C to 700°C, with 10 K/min heating rate. A Perkin-Elmer DSC-7 was used for thermal analysis and was operated under a nitrogen atmosphere with heating rate 10 oC/min and the temperature range was -100 to +20 oC. Contact angles were measured by the static drop technique at room temperature, using a KSV CAM 101 goniometer, equipped with a special optical system and a CCD camera connected to a computer to capture and analyse the contact angle (five measurements for each surface). The surface morphology was performed studying the samples by scanning electron microscopy (SEM). The measurements were taken using a Quanta 200 instrument equipped with an energy dispersive X-ray device, EDX. 2.3. Preparation of polyurethane solution Polymerization was carried out without adding catalyst (Scheme1). The polymer was prepared in a two-step polymerization process under nitrogen atmosphere. The molar ratio was 1: 4: 3 of polyether: diisocyanate: diol. In first step PTMEG, preliminary dehydrated under vacuum, was reacted with HDI to form a prepolymer. The reaction mixture was stirred at 80oC temperature for two hours. In next step the prepolymer was dissolved in DMF at a concentration of 40 wt.percent and then the solution was kept under stirring when the reaction mixture became viscous. In this moment the prepolymer solution was extended with BD and stirring was continued at room temperature other 2 hours. Finally, HPC was inserted, in the polyurethane solution and kept under
645
stirring 12 hours for homogenization, and then the solution it is diluted to a concentration of 20 % by weight. HO-[CH2-CH2-CH2-CH2-O]n-H + OCN-R1-NCO Diisocyanate Terathane (PTMEG), n=18.8 DMF OCN-R1-NH-CO-O-[CH2-CH2-CH2-CH2-O]n-OC-NH-R1-NCO Urethane prepolymer solution 1,4-butanediol
...-O-OC-HN-R1-NH-CO-O-[CH2-CH2-CH2-CH2-O]n-OC-NH-R1-NH-CO-O-CH2-CH2-CH2-CH2-O-... OR
+ OR H
HO O
O
n
Hydroxypropyl cellulose (HPC) n~50
OR Solution of PEU filled whit HPC were R: H or -CH2-CH-OH
R1: -(CH2)6-
CH3 Scheme 1. Scheme for obtaining of HPC-filled PEU
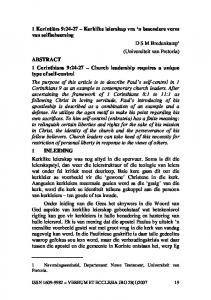
2.4. Electrospraying process The electrospraying apparatus must contain a needle or spinneret, high voltage power supply, and a grounded collector. Scheme demonstrates the basic components required to perform electrospraying as mentioned above. A syringe is filled with polymer solution which is fed through a needle into an electric field usually through the use of a syringe pump or gravity. A syringe pump allows the solution to be introduced into system at a precisely controlled rate. The polymer solution travels from the syringe into a metallic needle, which is connected to a high voltage power supply that is typically capable of generating voltage between 0 and 30 kV. In order to create an electric field the system must contain, along with the charged needle, a grounded plate (Fig. 1). This conductive plate completes a circuit and allows a strong electric field to be created between the needle and the plate. This grounded plate also serves as the collector for the completed microspheres web that is fabricated during the electrospraying process. Electrospraying was conducted at ambient conditions (typically 25 oC, relative humidity: 70 %). The solution was placed into a 10 mL glass syringe capped with a blunt needle (Type 20 G 11/2; inner diameter – ID=0.60 mm). The positive lead from a high voltage supply was connected via an alligator clip to the external surface of needle. An aluminium plate (diameter of 40 cm) was placed 15 cm from the tip of the needle as a static collector. The voltage was kept at 25 kV, using a High Voltage Power apparatus, type: HPC 140-35000 (0-35000 V; 0-4 mA) FUG Elektornik GmbH Rosenheim – Germany. Syringe is placed vertically and polymer flow solution was driven by gravity. All the PUMs were dried in a vacuum oven at 40 oC for 48 hrs to remove the residual solvent. All electrospraying procedures were carried out at 25 oC.
646
Fig. 1. Microspheres electrospraying schedule
3. Results and discussion 3.1. FT-IR spectral analysis Because of low range of HPC concentration from polyurethane composites, which is between 1-5% w/w, differences of FT-IR spectra corresponding to PUMs samples analysed are insignificant. Figure 2 illustrate the FT-IR spectra which confirm, in principal, the polyetherurethane structure. This is demonstrated by the disappearance of the signal corresponding NCO (isocyanate) group at 2260 cm -1. The other characteristics signals of polyetherurethane samples are: amide I bands (C=O stretch) at 1684 cm-1, amide II band (the joint vibration resulting from the combination of C-N and N-H) at 1538 cm-1, C-O stretch at 1262 cm-1, 1220 cm-1, 1105 cm-1, and 1064 cm-1, and NH stretch at 3318 cm-1. The peaks for CH2 stretch appear at 2938 cm-1, 2856 cm-1 and 2797 cm-1, respectively at 1477 cm-1 and 1369 cm-1 and CH2 rocking vibration at 781 cm-1.
647
Fig. 2. FTIR traces of PUMs
3.2. Thermogravimetric analysis Fig. 3 shows the obtained TG and DTG curves, while Table 1 present a summary of the important thermogravimetric characteristics obtained in this study. The same testing conditions were used for all samples analyzed. The onset degradation temperature was defined as the initial temperature of degradation, corresponding to the intersection of the tangent drawn at the inflection point of the decomposition step with the horizontal zero-line of the TG curve [26, 27]. Table 1. Thermogravimetric characteristics of representative samples
Stage of the thermal Tonseta Tpeakb Tendsetc Wd Mreside o o o degradation ( C) ( C) ( C) (%) (%) I 284.2 299.4 312.4 16.1 PEU-M II 333.0 351.1 374.5 24.3 1.7 III 398.8 418.5 468.0 57.9 I 288.2 312.9 325.4 19.0 PEU-HPC1 II 347.2 361.7 377.9 19.3 2.1 III 402.3 421.2 464.3 59.6 I 283.5 309.0 323.1 16.7 PEU-HPC5 II 342.4 362.5 378.8 25.2 2.4 III 404.5 430.6 464.1 55.7 a The onset temperatures of the polyurethane decomposition; b Thermal degradation peak temperatures of the samples decomposition; c The endset temperature in every stage; d Mass loss in every stage; e Weight loss of the samples after the end of the decomposition process. Sample
Generally, polyurethanes analyzed decompose in three stages and the temperature at which weight loss is maximum, ranges between 375-475 °C. The shape of the resulted curves suggests a complex degradation mechanism consisting in three successive global processes. The first two stages of decomposition were associated with the hard segment degradation (100-375 oC), and the last one, with the soft segment degradation (>375 oC). Increasing HPC content of the polyurethane samples has resulted in a slight increase in thermal stability.
648
Fig. 3. TG and DTG curves of PEU filled with HPC
3.3. Dynamic Scanning Calorimetry DSC analysis provide information about the amount of energy absorbed or released by a material as it is heated, cooled or held at constant temperature. This method was appropriate for the evaluation of the glass transition temperature. Figure 4 show illustrative DSC curves of PEU filled with HPC. The Tg values of samples with HPC are close, for example PEU_M have Tg= -51 oC, while PEU_HPC1 and PEU_HPC5 have Tg values around of -48 oC. Influence of HPC amount on Tg samples is insignificant.
Fig. 4. Representatives DSC traces of PEU filled with HPC
3.4. Scanning Electron Microscopy The SEM images were analyzed using the software Image J version 1.43u (available from the National Institute of Health, USA) to obtain the average size of microspheres and their distributions. Image J is an image processing software for determining edges of features that are of interest, calculating their area, proportion and other useful measurements. Suggestive images of PEU_HPC3 (polyetherurethane with 3% HPC) at different resolution are presented in Figs. 5 and 6.
649
Fig. 5. SEM image of polyetherurethane microspheres (PEU_HPC3, 2000x), left-original image; right- mask image
Fig. 5 present comparatively the original microscopic image and they corresponding mask returned by Image J, while Fig. 6 shows how to determine the selection of areas to analyze and calculate the distribution of microsphere average diameter.
Fig. 6. SEM image and microsphere size distribution of (PEU_HPC3, 5000x)Dm – average diameter
From diagram distribution (right image of Fig. 6) it is observed that >60% of the microspheres have average diameter less than 4 μm. This shows the good distribution of microspheres in the polyurethane membranes formed, which present high porosity and interconnected structure. 3.5. Biological study 3.5.1. Contact angles measurements The water contact angles measurements were made to observe the impact with the biological environment. The materials with good of wetting properties have a high possibility to be biocompatible. The amount of HPC in polyurethane composite influence contact angle value. Increasing cellulose content leads to lower contact angle, so the growth of wettability. Contribution of different percentages of HPC (1-5 % wt.) influences the performance of the biological membranes.
650
3.5.2. Fibrinogen adsorption Fibrinogen (FB) is a protein that plays a key role in blood clotting. The working protocol for determination of the fibrinogen adsorption is the same as that used in a previous study [13]. The adsorbed amount of FB was calculated with the following equation: AF = (Co – Ce)V/S
(1)
where: AF is adsorbed fibrinogen (mg/cm2), Co and Ce are the initial and equilibrium concentrations of FB solution (mg/ml), V is the volume of fibrinogen solution (ml) and S is the surface of the polyurethane sample (0.5 cm x 0.5 cm).
Fig. 8. Contact angles and fibrinogen adsorption of PUMs
The contact angles measurements and the experimental data related to the amount of adsorbed fibrinogen of polymer samples with a simple physiological solution (FB: 3.00 mg/ml) and mixed solution (FB: 3.00 mg/ml; BSA: 3.00 mg/ml) are presented in Fig. 8. It is evident that an increase of HPC amount of sample provokes a decrease of contact angles. A similar decline is observed in fibrinogen adsorption, more evident in mixed solution of FB+BSA. The differences between adsorptions of the fibrinogen simple solution and mixed solution suggest that the fibrinogen adsorption properties of the polyurethane samples, under physiological condition, are affected by the concurrent affinities for other plasma proteins, which do not disturb the haemostatic mechanisms. Good of wetting properties of the surface of polyurethane composite, offer a low interfacial tension with blood, provoking the decrease of fibrinogen adsorption and cell adhesion on the surface, similarly to biological tissues. 3.5.3. Determination of the blood clot weight There followed the phenomenon of coagulation, as the principle method for determining the time Howell-Gram method (modified in our laboratory), using whole blood. There determined the clot weight after triggering coagulation by recalcification with CaCl2. Whole blood utilized in this study was collected by venous puncture from a volunteer donor, healthy and non-smoker. The blood collected was combined with an anticoagulant (sodium citrate 3,8%) in ratio of 1/9 (v/v). Samples of polyurethane membranes, having size of 5x5 mm, were hydrated by incubation in 0.9% sodium chloride physiological solution for 30 min at room temperature. After that, each polyurethane sample was weighed and put on the bottom of sterile tissue culture Petri dish, over which added 0.1 ml of blood. The incubation was making in wet conditions, at temperatures of 37 oC, for 30 min. The reaction of coagulation is triggered by adding 0.05 ml of 0.025 M CaCl2 solution. The blood clot was stopped by adding 1 ml distilled water after 240 s (optimal time used). Fresh clot formed together with polyurethane sample it is extracted
651
from the Petri dish with a spatula, and excess of liquid is removed with filter paper and then weighed. The clot weight was determined as difference of final and initial weight of sample. A blank test, in the absence of polymer, was used for each experiment. The coagulation optimal time for a clot sized, easy to handle, but not to peak was of 240 s (4 min).
Fig. 9. Clot weight and relative clot weight of blank, collagen and PEU samples
Fig. 9 present the clot weight and relative clot weight on the film reported to the blank test, taken as 100, which was used as the degree of antithrombogenicity of the film - Imai method [28]. The blood clot weight after incubation time can be arranged in the following antithrombogenic order: Blank clot > PEU-HPC4 >PEU-HPC2 > PEU-M > Collagen film, so studied polyurethane samples did not affect several the clot formation mechanisms. 4. Conclusions In this study, some polyurethane membranes were synthesized by electrospraying process. Parameters of this technique and HPC proportion have an important influence on the morphological and biological performance of these polyetherurethane composites. With careful experimentation, PEU/HPC composite membranes containing microspheres could be produced. The presence of microspheres into polyurethane composites was confirmed by SEM photographs and size analysis distribution with Image J - image processing software. The information provided by SEM images can show if these membranes based on microspheres can be used for tissue engineering applications, particularly in the control of cell size. Mechanism of blood clot formation, positively influenced by increasing the concentration of HPC, and low amount of fibrinogen adsorbed confirm that polyurethanes, from this category, could be used in biomedical applications. Acknowledgement This work was supported by CNCSIS –UEFISCDI, project number PNII – IDEI code 988/2008, contract 751/2009.
652
References [1] P. Vermette, H. J. Griesser, G. Laroche, R. Guidoin, “Biomedical Applications of Polyurethane”, Eurekah.com, Landes Bioscience, Georgetown, Texas, USA (2001). [2] T. Thomson, “Polyurethanes as Specialty Chemicals: Principles and Applications”, CRC Press LLC (2003). [3] C.G. Mothe, C. R. De Araujo, Thermochim. Acta 357–358, 321 (2000). [4] V. G. Geethamma, J. Reethamma, S. Thomas, J. Appl. Polym. Sci. 55, 583 (1995). [5] J.P. Fisher, A. G. Mikos, J. D. Bronzino, “Tissue Engineering”, CRC Press LLC (2007). [6] R. Inai, M. Kotaki, S. Ramakrishna, Nanotechnology 16, 208 (2005). [7] M. M. Bergshoef, G. J. Vancso, Adv. Mater. 11, 1362 (1999). [8] Z. M. Huang, Y. Z. Zhang, M. Kotaki, S. Ramakrishna, Compos. Sci. Technol. 63, 2223 (2003). [9] M. M. Demir, I. Yilgor, E. Yilgor, Polymer 43, 3303 (2002). [10] C. L. Casper, J. S. Stephens, N. G. Tassi, D. B. Chase, J. F. Rabolt, Macromolecules 37, 573 (2004). [11] S. Vlad, C. Ciobanu, D. Macocinschi, D. Filip, A. Nistor, L. M. Gradinaru, I. Spiridon, J. Optoelectron. Adv. Mater., 11 (6) 907 (2009). [12] D. Macocinschi, D. Filip, S. Vlad, M. Cristea, M. Butnaru, J. Mater. Sci. Mater. Med., 20, 1659 (2009). [13] S. Vlad, M. Butnaru, D. Filip, D. Macocinski, A. Nistor, L. M. Gradinaru, C. Ciobanu, Dig. J. Nanomater. Bios. 5 (4) 1089 (2010). [14] S. Vlad, C. Ciobanu, D. Macocinschi, D. Filip, I. Spiridon, J. Optoelectron. Adv. M., 11 (8)1160 (2009). [15] D. Filip, S. Vlad, D. Macocinschi, J. Optoelectron. Adv. M., 11(5) 681 (2009). [16] S. Vlad, D. Filip, D. Macocinschi, I. Spiridon, A. Nistor, L. M. Gradinaru, V. E. Musteata, Optoelectron. Adv. Mat., 4 (3) 407 (2010). [17] D. Macocinschi, D. Filip, S. Vlad, Polym. Compos., 31, 1956 (2010). [18] D. Macocinschi, C. Tanase, D. Filip, S. Vlad, A. Oprea, Mater. Plast., 47(3) 286 (2010). [19] D. Macocinschi, D. Filip, S. Vlad, M. Cristea, V. Musteata, S. Ibanescu, J. Biomater. Appl., DOI: 10.1177/0885328210394468 (2011). [20] V. E. Musteata, D. Filip, S. Vlad, D. Macocinschi, Optoelectron. Adv. Mat., 4 (8) 1187 (2010). [21] M. Butnaru, D. Macocinschi, C. D. Dimitriu, S. Vlad, D. Filip, V. Harabagiu, Optoelectron. Adv. Mat., 5 (2) 172 (2011). [22] S. Vlad, M. Cristea, C. Ciobanu, D. Macocinschi, D. Filip, A. Nistor, L. M. Gradinaru, , J. Optoelectron. Adv. M.,12 (11) 2278 (2010). [23] A. Frenot, I. S. Chronakis, Curr. Opin. Colloid In. 8, 64 (2003). [24] B. D. Ratner, A. S. Hoffman, F. J. Schoen, J. E. Lemons, Biomaterials Science: An Introduction to Materials in Medicine, Academic Press (1996). [25] N. Lamba, K. Woodhouse, S. Cooper, Polyurethanes in Biomedical Applications, New York, CRC Press (1998). [26] K. Nakamura, T. Hatakeyama, H. Hatakeyama, Polym. Adv. Technol., 3, 151 (1992). [27] H. Hatakeyama, Y. Izuta, K. Kobashigawa, S. Hirose, I. Hatakeyama, Macromol. Symp. 130, 127 (1998). [28] Y. Imai, Y. Nose, J. Biomed. Mater. Res. 6, 165 (1972).