A Gorilla gorilla gorilla (233). A Pan paniscus (242). - A Pongo abeli (230). âA Nomascus leucogenys (224). - A Chlorocebus sabaeus (226). âA Macaca ...
V. harveyi Luxo. AMRHGSQOFLIKPCEADRLAVfVNNAIRKAtKIK--- NEaDNPgNQNYGGFIGSSQTMQQVYRTIDSAASSKASIFITGESGTGKEVCAEAIHAASKRG.
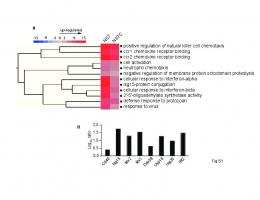
Rodrigo GarcÃa-Morales, Claudia E. Moreno, Ernesto I. Badano, Iriana Zuria, Jorge. Galindo-González, Alberto E. Rojas-MartÃnez & Eva S. Ãvila-Gómez. S1 Fig.
Masimo Sp02. Basis (n=77) HR. Masimo vs. CTRU: r=0.90; P
6. Connect silicon tubes. 7. Bonding PDMS device and a coverslip. 8. Load cells. Medium/Cell suspension. Inlet. Outlet. Coverslip. Plasma-activated surface. B.
meat-type quail in Brazil meat-type quail in France meat-type quail in Hungary commercial commercial quail from. Japanese company. 2012~. 2015. Microsat- ...
Falster, symbolized 'AA' on the x axis . The red bars correspond to genotypes homozygous for the Veyo allele., symbolized 'BB' on the x axis. The purple bars ...
Drosophila_melanogaster_Q9VCU4 G-RI YRQQ--. CL - HPKR--- CADVEDL LLD MAS G---- ..... Bos taurus Q5E9Q1 LTEYSKELSY NVTRRKGYDQ | VPKI LKI EL.
-o- anti-Ly6G. --o- anti-Ly6G. 300. 350. 250. 300. 250. O SH. E 200. Neutrophils (x108). o n 0 0 0 D). (jw/6d) de-1. TNF-a (pg/ml). 150. 100. HOO-. 100. QH*. 50.
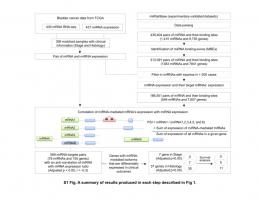
439,404 pairs of miRNA and their binding sites. (1,410 miRNAs and 9,793 genes). 395 matched samples with clinical information (Stage and Histology).
FLAG-tagged AR expressed in HEK293 cells and GST-tagged Ack1 was ... GST-Ack1 bound to beads for overnight, beads were washed followed by IB with anti-.
75 50 Total T cells CD62L- CD44+ T cells CD62L+ CD44- T cells
25 0
d9
d0
d1
d3
d5
d76
**
**
d5
d7
d9
7
** *
6
**
5 4
d0
d1
d3
d5
d7
d9
CD39+ CD8+ T cells [log10]
CD39+ CD4+ T cells [log10]
C 7
**
6 * 5 4
d0
d1
d3
d0
d1
d3
d9
7
CD73+ CD8+ T cells [log10]
CD73+ CD4+ T cells [log10]
D
6
5
d0
d1
d3
d5
d7
d9
7 6 5 4
d5
d7
d9
S1 Fig: CD62L and CD44 expression profiles of T cells during the course of L. monocytogenes infection Wildtype mice were i.v. infected with 1×10⁵ LmOVA. At different time points post infection, spleen cells were analyzed by flow cytometry and changes in expression profile as well as percentages and numbers of different T-cell subsets were determined. (A) Representative dot plots for CD4 and CD8 gated cells. (B) Percentages of naive CD62L+CD44— and activated CD62L—CD44+ CD4+ and CD8+ T cells. Values give the mean ± SEM for 3 independently analyzed mice per time point and are representative for 3 independent experiments. (C, D) Numbers of total, CD62L+CD44—, and CD62L—CD44+ cells for CD39+ (C) and CD73+ (D) CD4+ and CD8+ T cells. Values give the mean ± SEM for 6 mice per group pooled from 2 independent experiments. Unpaired t test, comparison with day 0 (only shown for total T-cell populations), * p