SUPPORTING INFORMATION Characterization of Electrical Current-Generation Capabilities from Thermophilic Bacterium Thermoanaerobacter pseudethanolicus Using Xylose, Glucose, Cellobiose, or Acetate with Fixed Anode Potentials Bradley G. Lusk*,∞,a and Qaiser Farid Khan, ∞,a,b Prathap Parameswaran,a,1 Abdul Hameed,b Naeem Ali,b Bruce E. Rittmann,a Cesar I. Torres*,a,c
a
Swette Center for Environmental Biotechnology, The Biodesign Institute at Arizona State University, P.O. Box
875701, Tempe, AZ 85287 – 5701, USA; bDepartment of Microbiology, Quaid-I-Azam University, Islamabad, 45320, Pakistan; cSchool for Engineering of Matter, Transport and Energy, Arizona State University, 501 E Tyler Mall, Tempe, AZ 85287, USA; ∞Authors contributed equally to experimental work. Corresponding authors: Cesar Torres and Bradley Lusk e-mail:
[email protected] e-mail:
[email protected] 8 figures, 10 pages
1
Present address: Department of Civil Engineering, Kansas State University, Manhattan, 2123 Fiedler Hall, Manhattan, KS 66502, USA
S1
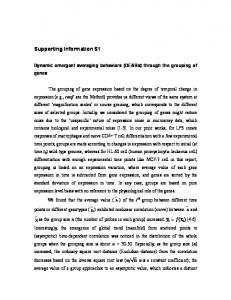
Figure S1. Initial growth of current density of the xylose-fed electrochemical cell.
S2
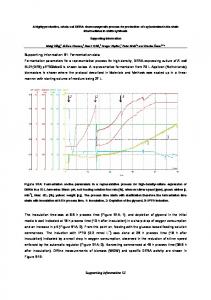
Figure S2. Derivative of the LSCV at 1 mV s-1 for the xylose-fed electrochemical cell.
S3
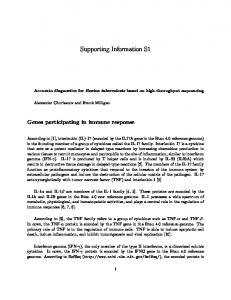
Figure S3. Results for the xylose-fed electrochemical cell operated in batch for ~66 days. Orange circles indicate pH, black line indicates current density, the purple square indicates xylose, red squares indicate lactate, and blue diamonds indicate acetate.
S4
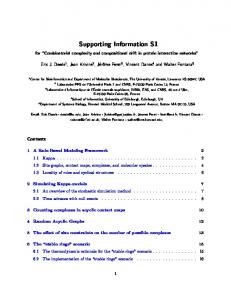
Figure S4. Results for the glucose-fed electrochemical cell operated in batch for ~55 days. Orange circles indicate pH, black line indicates current density, yellow dashes indicate glucose, red squares indicate lactate, and blue diamonds indicate acetate.
S5
Figure S5. Results for the cellobiose-fed electrochemical cell operated in batch for ~11 days. Orange circles indicate pH, black line indicates current density, green boxes with Xs indicate cellobiose, red squares indicate lactate, and blue diamonds indicate acetate.
S6
Figure S6. A reactor fed with 10 mM acetate operated in batch for 13 days showed no significant current density.
S7
Figure S7. Current increase shown after 10 mM acetate was spiked into a xylose-fed reactor that had reached a current density of 0.1 A m-2.
S8
A
B
S9
C
Figure S8. Fraction of electrons captured as current, acetate, lactate and initial substrate are shown as a percentage of the total electrons present in the initial substrate. A. shows the results for 20 mM xylose-fed electrochemical cell from Figure 04 in the main text. B. shows the results for 10 mM glucose-fed electrochemical cell from Figure 05 in the main text. C. shows the results for 7.5 mM cellobiose-fed electrochemical cell from Figure 06 in the main text.
S10