Supporting Information for: Carbon Dioxide Emission Factors for U.S. Coal by Origin and Destination. Submitted to Environmental Science and Technology Jeffrey C. Quick Utah Geological Survey, PO Box 146100, Salt Lake City, Utah 84114-6100, USA email:
[email protected], telephone: 801-537-3372 Contents: 1 figure, 8 tables, 68 pages. Outline The development of CO2 emission factors for U.S. coal ............................................. S2 Net and gross energy .................................................................................................... S3 Causes of variation of the CO2 emission factor ........................................................... S4 Coal rank Sulfur Macerals Minerals Main data sets .............................................................................................................. S5 COALQUAL IGS FERC-and EIA-423 Determination of coal rank ........................................................................................ S10 Other data sets ............................................................................................................ S11 ICR and FERC580 EIA 906/920 U.S. Customary Units ................................................................................................ S11 References .................................................................................................................. S13 Appendix .................................................................................................................... S19 Table AS1. Emission factors by origin state and county ........................................... S20 Table AS1a. (SI units) Table AS1b. (U.S. customary units) Table AS2. Emission factors by destination state and power plant ............................ S36 Table AS2a. (SI units) Table AS2b. (U.S. customary units) S1
The development of CO2 emission factors for U.S. coal. The origin, tonnage, heating value, ash yield, S content, and coal rank class (lignite, subbituminous, bituminous, or anthracite) of coal shipments delivered to U.S. power plants are reported (1, 2), but the coal C content is not. Consequently, CO2 emission factors are used in greenhouse gas inventories to estimate CO2 emissions from coal combustion (3, 4). Early inventories (5, 6) used a single factor for all coal. Subsequent studies (7, 8, 9, 10) showed that the CO2 emission factor varies with coal rank. Accordingly, the Intergovernmental Panel on Climate Change (IPPC) recommended rank-specific emission factors (11), which were calculated from unpublished coal analyses for coals of unknown origin (8). Hong and Slatick (9) cite an unpublished study of 5426 U.S. coal assays collected by the disbanded U.S. Bureau of Mines as the basis of rank-specific CO2 emission factors for coal-producing states. These factors were used to calculate the sector-specific emission factors, which were used in U.S. greenhouse gas inventories until 2002 (4) when new factors calculated from the U.S. Geological Survey COALQUAL data (12) were adopted. Table S1 shows some emission factors for U.S. coal. Emission factors for coal produced in other countries have been reviewed by Smith (13), Heite et al., (14) and Herold (15). New emission factors and approaches continue to be developed (16, 17). Table S1. Some CO2 emission factors for U.S. coal (kg CO2/GJ) by coal rank classification. Hong and Slatick (9)
a
EPA (1)
This Study
anthracite 98.91 97.76 98.19 bituminous 88.20 88.26 88.56 subbituminous 91.97 91.10 92.05 lignite 92.97 92.99 91.40 a. These values were introduced in 2002. In 2008, EPA increased the lignite emission factor to 92.35 kg CO2/GJ, but the older value is listed here because it continues to be widely used (for example, in the greenhouse gas reporting rule (18)).
Net and gross energy Emission factors shown in table S1 are reported on a gross energy basis; a net energy basis is more common in other countries. The net heating value (MJ/kgnet) may be calculated from approximation formulae, such as: MJ/kgnet = MJ/kggross – 0.2142×(0.1119M + H), where Btu, M (% moisture), and H (% hydrogen, excluding H in S2
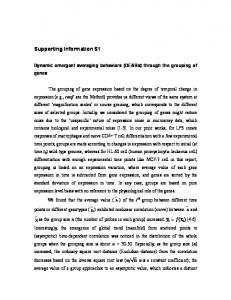
moisture) are on a moist, whole-coal basis (19). If coal oxygen (O) and nitrogen (N) assays are also available, an exact formula: MJ/kgnet = MJ/kggross – (0.21215×Hdry – 0.00077×Odry – 0.00089×Ndry)×(1-0.01M) – 0.02443×M, may be used (20). However, data needed to use these formulae are rarely reported. Thus, the net heating value of coal is sometimes assumed to be 5% less than the gross heating value (11). This assumption is reasonable for subbituminous A rank U.S. coal, but if used for CO2 emission inventories, will systematically underestimate emissions from lower rank coal and overestimate emissions from higher rank coal (14, 21). The difference between CO2 emission factors expressed on net and gross energy bases is more accurately illustrated in figure S1.
Figure S1. The difference between CO2 emission factors expressed on a net energy basis (■) and a gross energy basis (○) systematically varies with the ASTM rank of 65 U.S. coal samples; modified with permission from (21).
S3
Causes of variation of the CO2 emission factor Coal rank. Variation of the CO2 emission factor with coal rank is well established (7, 8, 9, 11, 21) and is illustrated in figure S1 for U.S. coal using the ASTM classification of coal by rank (22). Examination of figure S1 also shows substantial variation within coal rank classes (lignite, subbituminous, bituminous, anthracite). As discussed in the manuscript, this variation limits the reliability of emission factors specified by coal rank class. It is worth noting that there are many different coal rank classification systems, so what is bituminous coal in one country, may be subbituminous in another. For example, coal produced from Louisiana (table SA1) is lignite according to U.S. protocol (17.45 MJ/kg lbmoist, ash-free (11, 23)). Sulfur. Several studies (7, 14, 24) have shown that sulfur in coal reduces the CO2 emission factor. Winschel (7) explicitly examined the effect of sulfur in practical combustion systems and noted that the reduction in CO2 emissions may be offset by parasitic energy demand from S emission controls. Offsets due to CO2 from carbonate sorbents have also been considered (24). As discussed in the manuscript, these considerations are complicated by hydrogen associated with the organic S fraction, which enhances the CO2 emission reduction due to S. Macerals. Variation of maceral content can also influence CO2 emissions (21, 24, 25). However, the effect of maceral abundance on CO2 emissions is less certain than that due to S because the maceral analyses are rarely reported for commercial U.S. coal. In general, CO2 emission factors for Inertinite>Vitinite>Liptinite within a single coal sample. Inertinite abundance in commercial Australian bituminous coal has been shown to cause a 4.8 kg CO2/GJ variation (24). Maceral assemblages isolated by density fractionation from five Kentucky bituminous coals have been shown to vary by more than 8.6 kg CO2/GJ (25). Minerals. Carbon dioxide from the endothermic decomposition of carbonate minerals during coal combustion are expected to increase the CO2 emission factor (21). Although carbonate minerals are relatively rare in U.S. coal they can have a significant effect on CO2 emissions elsewhere (26). In practical combustion systems abundant
S4
mineral matter may also increase CO2 emissions due to loss of sensible heat from the boiler in flyash, bottom ash, or slag, as well as increased parasitic energy consumption by pulverization mills; more work is required to evaluate these possibilities. Main data sets COALQUAL. The COALQUAL data (12) include comprehensive assays for 7432 U.S. coal samples collected from drill holes, mines, exploration pits, and outcrops (table S2). Details of the COALQUAL reporting conventions and assay procedures are fully explained in text that accompanies the data (27). Several details are worth noting. Hydrogen values include H in coal moisture. This reporting convention has significance for the calculation of heating values from elemental composition. Many samples were partially dried prior to analysis. This assay procedure precludes an accurate rank determination for most of the samples, which is why, in part, text that accompanies the data (27, p.10) emphatically states: “THE USGS MAKES NO CLAIMS AS TO THE ACCURACY OF COAL RANK CALCULATED FROM PARAMETERS OF PROXIMATE AND ULTIMATE ANALYSES.” Table S2. Description of COALQUAL data.
1 2
Location Information Geologic Information
State, county, latitude, longitude, province, region, field, district, USGS map (quadrangle) name. Formation, group, bed, member, zone, depth, bed thickness, system, geologic age.
Collection Information
Collector name, drill hole/mine name, estimated rank, and laboratory submission date.
Laboratory
U.S. Bureau of Mines, Geochemical Testing Co., State lab, USGS lab, Dickinson Laboratories Inc.
Sample Type
Channel, drillcore, weathered channel, outcrop.
Data Type
Single sample assay, physical composite assay, calculated composite assay, partial composite assay, partial bed split.
ASTM1 Analyses
(whole-coal basis) moisture, heating value, ash, volatile matter, CHNOS,2 ash fusion temperatures, free swelling index, sulfur forms, air-dry-loss, equilibrium moisture, and Hardgrove grindability.
USGS Analyses
(residual-moisture basis) USGS method ash, 11 major and minor ash oxides, and up to 62 trace elements.
American Society for Testing and Materials Carbon, Hydrogen, Nitrogen, Oxygen, and Sulfur
S5
Hower et al., (28) advise users of published coal quality data to consider the sample origin, collection protocol, and assay reliability. Accordingly, only COALQUAL samples that originate from coal producing counties were selected. Likewise, samples collected from weathered outcrops were ignored, and assay results were tested for reliability. COALQUAL is a geological database, which necessarily requires sample information such as a precise location, depth, bed thickness, formation, and age. Such information can rarely be assured for samples collected from commercial coal shipments. Consequently, COALQUAL does not include samples of commercially produced coal that is burned at power plants. Moreover, about 13% of the COALQUAL samples originate from counties with no coal production; although geologically significant, these samples are not representative of coal burned at power plants and were excluded from this study. About 10% of the samples included in COALQUAL are weathered. Weathering at the outcrop can increase coal moisture and O (29, 30), and change the relative abundance of H and C (31, 32). Although weathering usually reduces the heating value, dynamic variation of the heating value has also been observed (33, 34). These sometimesprofound compositional changes make CO2 emission factors calculated for weathered coal unreliable proxies for commercial coal production. Accordingly, samples collected from outcrops or identified as weathered coal were ignored. Weathered coal is not always easy to identify in the field. Because severe weathering inevitably reduces the free swelling index (35, 36), a few samples with both elevated moisture and a diminished free swelling index were also ignored. A Mott-Spooner test was used to evaluate the reliability of the heating value and elemental (C, H, O, S) assays. This test is appropriate because results of these assays are used to calculate the CO2 emission factor. The test reports the difference between the measured heating value and a heating value calculated from the elemental composition (37). Analytical error is likely where the Mott-Spooner difference is more than ±0.58 MJ/kg (38). About 10% of the COALQUAL records exceed this threshold and were ignored. Table S3 shows a tabulation of selected and ignored COALQUAL data records.
S6
Table S3. Tabulation of selected and ignored COALQUAL data records. 7,432 ORIGINAL RECORDS 18 nominal data or not representative1 75 FSI and moisture indicate weathering1 656 weathered or outcrop coal1 717 failed Mott-Spooner test1 843 lack carbon or heating value assays1 5,118 SELECTED RECORDS 12 from Illinois1 939 from non-producing counties1,2 1
4,167 RECORDS used ignored.
IGS. Twelve COALQUAL data records from Illinois were replaced by more numerous data records from the Illinois Geological Survey (39). With one exception, the same criteria used to select COALQUAL data records were applied to the IGS data. Unlike Mott-Spooner values for COALQUAL data, which were normally distributed around a median value near zero, Mott-Spooner difference values for the IGS data were normally distributed around a median near –0.31 MJ/kg, so selection thresholds were modified to +0.27 and –0.90 MJ/kg. The non-zero median is consistent with moisture in occluded pores, low inertinite content, and abundant organic sulfur but more work is required to support a definitive explanation. Ultimately, IGS data for 651 coal samples from 17 counties were used to characterize the in-ground quality of Illinois coal (table S4). Table S4. Tabulation of selected and ignored Illinois Geological Survey data records. 5,837 ORIGINAL RECORDS 3197 lack carbon or heating value assays1 1191 uncertain location or not from Illinois1 160 failed Mott-Spooner test1 15 not coal1 7 likely weathered1 1,267 SELECTED RECORDS 616 from non-producing counties1 651 RECORDS used 1 ignored.
S7
FERC and EIA 423. The FERC-423 data (40) originate from the Federal Energy Regulatory Commission (FERC) Form 423, monthly survey of fossil-fueled electric utilities (41). Among other things (table S5), the FERC-423 data include county origin, tonnage, heating value, ash, and S values for coal shipments delivered to utility power plants with generation capacities of 50 MW or more. About half of the year 1999, FERC-423 data records were selected for this study (table S6). Records for liquid, gaseous, and other non-coal fuels were ignored, as were records for imported coal and domestic coal of uncertain state or county origin. Except for the CO2 emission factor, the county-average produced coal quality values were weighted by shipment tonnage, state and rank-class averages for produced coal were weighted by county production tonnage, and state averages for delivered coal were weighted by shipment tonnage. The CO2 emission factors were weighted by energy (tons × MJ/kg value). Table S5. List of data fields in the 1999, FERC-423 data. Company Plant Year Month District State County Mine Type Region (plant) State (plant) Generic Fuel Specific Fuel Contract Type
Contract Expire Quantity Btu Sulfur Ash Cost
Code for the name of utility parent company. Code for the name of the utility power plant. Reporting year. Reporting month. U.S. Bureau of Mines coal-producing district U.S. state-of-origin (coal). U.S. county-of-origin (coal). Surface or underground coal mine. Regional location of the electric utility. State location of the electric utility. Type of fuel (solid, liquid, gaseous). Bituminous, subbituminous, lignite, fuel oil, natural gas, etc. Simple contract, contract with escalator, new, firm (gas), interruptible gas, spot and off peak gas, spot coal, or spot oil. Indicates if the contact expires within 24 months. Tons in coal shipment (short tons). Heating value (gross Btu/lb, as-shipped). Sulfur content (weight%, as-shipped). Ash value (weight%, as-shipped). Cents per million British thermal units (total, includes transportation and taxes).
S8
Table S6. Tabulation of selected and ignored 1999, FERC-423 data records. 35,886
20,096
19,493
1
ORIGINAL RECORDS 15,790 Liquid or gas1 20,096 Solid fuel SOLID FUEL RECORDS 116 Imported coal1 146 Uncertain origin1 231 Petroleum coke1 68 Refuse1 42 Wood1 19,493 Coal SELECTED RECORDS 20 Anthracite 15,948 Bituminous 235 Lignite 3,290 Subbituminous
ignored.
Although fuel receipts reported in the 1999 FERC-423 data include over 99% of the coal delivered to electric utility power plants, non-utility power plants (independent power producers and combined heat and power plants) are not reported in this data set. These non-utility power plants received 51 Tg of coal (~5%) of the total 852 Tg delivered to U.S. power plants >50 MW during 1999 (42). Also not included is information on the quality of coal exports, shipments to coke and industrial plants, and coal delivered to institutions and homes. Despite these deficiencies, the 816 Tg of coal is reported in the 1999 FERC-423 data represents more than 80% of total 1999 U.S. production. The geographic extent of the FERC-423 data is even more impressive; during 1999, the 190 counties included in FERC-423 produced over 98% of U.S. coal production. As noted, about 5% of the coal delivered to U.S. power plants during 1999 was not reported with the FERC-423 data. Since then, the market share of independent power producers, which do not report on FERC-423, has increased. During 2005 about 27% of the coal delivered to U.S. power plants was not reported on FERC-423. Beginning in 2002, information on the amount and quality of this coal has been reported with the EIA423 data (43), which lack coal prices but are otherwise similar to the FERC-423 data. Consequently, FERC-423 and EIA-423 data were combined to tabulate the quality and
S9
amount of coal delivered to U.S. coal-fired power plants (>50MW) during 2005. These combined data include more than 23,000 records for 918 Tg of coal shipped to 479 power plants. Selection criteria applied to the combined data were similar to those applied to the 1999 FERC-423 data, except that records for imported coal and coal of uncertain origin were included; CO2 emission factors for these shipments were estimated using equation 5. Rank designations reported with FERC-423 data are anecdotal; no guidance on how to determine rank is provided with the FERC Form-423 instructions (41). Consequently, the ASTM rank designations determined in this study, although largely calculated from FERC-423 data, sometimes differ from rank designations reported with these data. Rank designations reported with the related EIA-423 data are likewise uncertain because rank classification rules in the EIA-423 instructions (44) show overlapping indicative Btu ranges for lignite and subbituminous rank classes. Determination of coal rank In this paper, the rank of coal produced from 223 counties (table AS1) was determined in general accordance with the ASTM standard (22). The ASTM Btum,mmf rank parameter was calculated from the tonnage-weighted ash, S, and heating values for produced coal (mostly FERC-423 data). Because fixed carbon (FC) is not reported for produced coal, the ASTM FCd,mmf rank parameter was calculated from FC, ash, S, and moisture values for in-ground coal (mostly COALQUAL data). Note that, because FCd,mmf is on a dry basis, it is not affected by the partial drying of COALQUAL assay specimens that precludes a reliable rank determination for most COALQUAL data records. The agglomerating character, which is used to distinguish certain bituminous and anthracite coals, is also not reported for produced coal. For these distinctions, western U.S. coal (Alaska, Arizona, Colorado, Montana, New Mexico, North Dakota, Utah, and Wyoming) and coal from counties with >89% FCd,mmf was assumed to be nonagglomerating, whereas the remaining coal was assumed to be agglomerating. Finally, the coal rank class was geographically inferred for 11 counties that lack appropriate assay data.
S10
Other data sets ICR and FERC-580. The 33 coal-producing counties that are not included in the FERC-423 data produced 17.6 Tg of coal during 1999 (~1.5% of total production). Average produced coal quality for 11 of these counties, which together produced 13.2 Tg coal, was calculated from the ICR and FERC-580 data. The ICR data originate from an Information Collection Request issued by the EPA (45) to inform the Clean Air Mercury Rule. The ICR data include the county origin as well as dry-basis, ash, S, Hg, Cl, and heating values for about every third coal shipment to power plants ≥ 25 MW during 1999. Estimated moisture values (46) were used to adjust the ICR data to an as-shipped basis. The FERC-580 data (47) contain 7905 records for commercial coal shipments delivered to certain power plants ≥ 50 MW between 1992 and 1999. These data include countyorigin, shipment tonnage, heating value, ash, S, and moisture values reported on the FERC Form 580, biannual survey of investor-owned, interstate electric power plants. EIA-906/920 data. These data (48) report generation and fuel consumption at the power plant and were used to estimate the quantity of coal shipped from transfer stations to certain power plants (mostly Tennessee Valley Authority plants). Equations in U.S. customary units. The CO2 emission factor (lbs CO2/million Btu) was calculated as: lbs CO2/million Btu =
C 10 6 × × 3.6642 Btu lb 100
(1)
where C is wt.% carbon of the coal, Btu/lb is British thermal units per lb coal, and 3.6642 is the gravimetric factor to convert C to CO2 An adjusted S value (Sadj) was calculated as:
S adj = S prod
S ⎛ ⎞ 100 ⎜ Btu in − grd − 4050 × in − grd ⎟ × ⎜ ⎟ 100 ⎠ 100 − S in − grd ⎝ × S ⎞ ⎛ 100 ⎜ Btu prod − 4050 × prod ⎟ × ⎟ ⎜ 100 ⎠ 100 − S prod ⎝
(2)
where Sprod is the weight percent S of the produced coal, Btuin-grd is the average Btu/lb value for the in-ground coal by origin county, Btuprod is the Btu/lb value for coal produced from that county, 4050 is the Btu/lb contribution from sulfur, and Sadj is the S11
weight percent S required for the in-ground coal to have the same S emission factor as the produced coal. An adjusted C content (Cadj) was calculated as:
C adj = C in − grd ×
(100 − S )
(100 − S
adj
in − grd
)
(3)
where Cin-grd is the county-average C content of in-ground coal, Sin-grd is the corresponding in-ground S content, and Sadj is from equation 2. An adjusted Btu/lb value (Btuadj) was calculated as: S in − grd ⎛ Btu adj = ⎜⎜ Btu in − grd − 4050 × 100 ⎝
S adj ⎞ 100 − S adj ⎟× + 4050 × ⎟ 100 − S 100 in − grd ⎠
(4)
For high volatile A bituminous and lower rank coal the CO2 emission factor was estimated as: lbs CO2 million Btu = 252.9 − 1.647 × S ef − 5.862 E −3 × Btu m ,mmf + 1.821E −7 × Btu m2 ,mmf
(5)
where Sef is the S emission factor (lbs S/million Btu) for the produced coal, and Btum,mmf is the moist, mineral-matter-free Btu/lb rank parameter for produced coal. For medium volatile bituminous and higher rank coal the CO2 emission factor was estimated as: lbs CO2 million Btu = 336.0 − 0.7647 × S ef − 3.843 × FC d ,mmf + 2.857 E −2 × FC d2, mmf
(6)
where Sef is the S emission factor (lbs S/million Btu) for the produced coal, and FCd,mmf is the dry, mineral-matter-free fixed-carbon rank parameter. An approximation formula to calculate the net heating value is: Btu/lbnet = Btu/lbgross – 92.08×(0.1119M + H), where Btu, M (% moisture), and H (% hydrogen, excluding H in moisture) are on a moist, whole-coal basis.
S12
An exact formula to calculate the net heating value can be used if coal oxygen (O) and nitrogen (N) values are also available: Btu/lbnet = Btu/lbgross – (91.21×Hdry –0.33×Odry – 0.38×Ndry)×(1-0.01M) – 10.50×M References
(1)
U.S. Energy Information Administration. Form FERC-423 Database, Monthly Cost and Quality of Fuels for Electric Plants Data; EIA: Washington, DC, 2007; www.eia.doe.gov/cneaf/electricity/page/ferc423.html.
(2)
U.S. Energy Information Administration. Form EIA-423 Database, Monthly Nonutility Fuel Receipts and Fuel Quality Data; EIA: Washington, DC, 2007; www.eia.doe.gov/cneaf/electricity/page/eia423.html.
(3)
U.S. Energy Information Administration. Emissions of Greenhouse Gases in the United States 2005; EIA: Washington, DC, 2006; www.eia.doe.gov/oiaf/1605/ggrpt/index.html.
(4)
U.S. Environmental Protection Agency. Inventory of U.S. Greenhouse Gases and Sinks 1990-2005, report 430-R-07-002; EPA: Washington, DC, 2007; www.epa.gov/climatechange/emissions/usinventoryreport.html.
(5)
Marland, G.; Rotty, R. M. Carbon dioxide emissions from fossil fuels - a procedure for estimation and results for 1950-1982. Tellus, 1984, 36B, 323–261.
(6)
Marland, G.; Pippin, A. United States emissions of carbon dioxide to the Earth's atmosphere by economic activity. Energy Systems and Policy, 1990, 14, 319–336.
(7)
Winschel, R. A. The relationship of carbon dioxide emissions with coal rank and sulfur content. J. Air Waste Manage. Assoc., 1990, 40, 861–865.
(8)
Grubb, M.; Brackley, P.; Ledic, M.; Mathur, A.; Rayner, S.; Russell, J.; Tanabe, A. Energy Policies and the Greenhouse Effect, volume two - Country Studies and Technical Options; Dartmouth Publishing Company: Hants, UK, 1991.
(9)
Hong, B. D.; Slatick, E. R. Carbon dioxide emission factors for coal. Energy Information Administration, Quarterly Report, Jan-March 1994, report DOE/EIA-0121(94/1Q); EIA: Washington, DC, 1994.
S13
(10)
Marland, G.; Boden, T.; Andres, R. J. Carbon dioxide emissions from fossil fuel burning – emission coefficients and the global contribution of eastern European countries. Időjárás, 1995, 99 (3-4), 157–170.
(11)
Houghton, J. T., Meira Filho, L. G., Lim, B., Tréanton, K., Mamaty, I., Bonduki, Y., Griggs, D. J., Callander, B. A., Eds. Greenhouse Gas Inventory Reference Manual, Revised 1996 IPCC Guidelines For National Greenhouse Gas Emissions; Intergovernmental Panel on Climate Change: Geneva, Switzerland, 1997.
(12)
Bragg, L. J.; Oman, J. K.; Tewalt, S. J.; Oman, C. L.; Rega, N. H.; Washington, P. M.; Finkelman, R. B. Coal Quality (COALQUAL) Database – Version 2.0, OpenFile Report 97-134; U.S. Geological Survey, Energy Resources Program: Reston, Virginia, 1997; www.energy.er.usgs.gov/products/databases/CoalQual/intro.htm.
(13)
Smith, I.M., Greenhouse Gas Emission Factors for Coal – The Complete Fuel Cycle, IEACR/98; International Energy Agency, Coal Research, London, UK, ISBN 92-9029-297-0, 1997.
(14)
Hiete, M.; Berner, U.; Richter, O. Calculation of global carbon dioxide emissions: Review of emission factors and a new approach taking fuel quality into consideration; Global Biogeochemical Cycles, 2001, 15 (1), 169-181.
(15)
Herold, A. Comparison of CO2 Emission Factors for Fuels used in Greenhouse Gas Inventories and Consequences for Monitoring and Reporting Under the EC Emissions Trading Scheme, ETC/ACC technical paper 2003/10; The European Topic Centre on Air and Climate Change, Bilthoven, The Netherlands, 2003; www.air-climate.eionet.europa.eu/reports.
(16)
Jeon, E.; Myeong, S.; Sa, J.; Kim, J.; Jeong, J. Greenhouse gas emission factor development for coal-fired power plants in Korea; Applied Energy, 2010, 87, 205210.
(17)
Roy, J.; Sarkar, P.; Biswas, S.; Choudhury, A. Predictive equations for CO2 emission factors for coal combustion, their applicability in a thermal power plant and subsequent assessment of uncertainty in CO2 estimation; Fuel, 2009, 88 (5) 792-798.
S14
(18)
U.S. Environmental Protection Agency. Mandatory reporting of greenhouse gases, final rule, Federal Register of October 30, 2009, 56260–56519; EPA: Washington, DC, 2009; www.epa.gov/climatechange/emissions/ghgrulemaking.html.
(19)
Stultz, S. C., Kitto, J. B., Eds. Steam, its Generation and Use, 40th ed.; Babcock and Wilcox Co.: Barberton, Ohio, 1992.
(20)
Bowling, C. M. Determination of net calorific value at constant pressure from gross calorific value measured at constant volume in a bomb calorimeter on coal, Research Report D-05-1013; American Society for Testing and Materials:West Conshohocken, Pennsylvania, [1989?].
(21)
Quick, J. C.; Glick, D. C. Carbon dioxide from coal combustion - variation with rank of U.S. coal. Fuel, 2000, 79, 803–812.
(22)
American Society for Testing and Materials. Method D388-90, Standard classification of coals by rank, Annual Book of ASTM Standards v.05.05, 193– 197, ASTM: West Conshohocken, Pennsylvania, 1990.
(23)
United Nations Statistics Division. Energy Statistics Yearbook 2004 (definitions); UN: New York, 2007; www.unstats.un.org/unsd/energy/yearbook/def_english.htm#SOLIDS.
(24)
Quick, J. C.; Brill, T. C. Provincial variation of carbon emissions from bituminous coal -influence of inertinite and other factors. Int. J. Coal Geol., 2002, 49, 263– 275.
(25)
Sakulpitakphon, T.; Hower, J. C.; Taulbee, D. N. Predicted CO2 emissions from maceral concentrates of high volatile bituminous Kentucky and Illinois coal. Int. J. Coal Geol., 2003, 54, 185–192.
(26)
Vamvuka, D.; Galetakis, M., Carbon Dioxide Emissions from Coal-Fired Power Plants in Greece in Relation to Mined Lignite Quality, Energy and Fuels, in press, DOI: 10.1021/ef900702b.
(27)
U.S. Geological Survey. Definitions of parameters in the U.S. Geological Survey Coal Quality database; USGS: Reston, Virginia, 1997; www.energy.er.usgs.gov/products/databases/CoalQual/Docs/techinfo.pdf . S15
(28)
Hower, J. C.; Griswold, T. B.; Pollock, J. D. Caveats on the use of published coal quality data. CQ, 1989, 8 (2), 49–51.
(29)
Ingram, G. R.; Rimstidt, D. J. Natural weathering of coal. Fuel, 1984, 63, 292– 296.
(30)
Mathews, W. H.; Bustin, R. M. Changes associated with natural in-situ weathering of a coking coal from southeastern British Columbia. Fuel, 1984, 63, 548–550.
(31)
Suggate, R. P. New Zealand Coals, Bulletin 134; Department of Scientific and Industrial Research: Wellington, New Zealand, 1959.
(32)
Chandra, D. Reflectance and microstructure of weathered coals. Fuel, 1962, 41, 185–193.
(33)
Rees, O. W.; Coolican, F. C.; Pierron, E. D.; Beeler, C. W.; Effects of outdoor storage on Illinois steam coal, Circular 313; Illinois State Geological Survey: Champlain, Illinois, 1961.
(34)
Liotta, R.; Brons, G.; Isaacs, J. Oxidative weathering of Illinois No. 6 coal. Fuel, 1983, 62, 781–791.
(35)
Gray, R. J.; Rhoads, A. H.; King, D. T. Detection of oxidized coal and the effects of oxidation on the technological properties. Transactions of the Society of Mining Engineers, 1976, 260, 334–340.
(36)
Marchioni, D.L. The detection of weathering in coal by petrographic, reheologic and chemical methods. Int. J. Coal Geol., 1983, 2, 231–259.
(37)
Mott, R. A.; Spooner, C. E. The calorific value of carbon in coal – the Dulong relationship. Fuel, 1940, 19, 226–231 and 242–251.
(38)
Given, P. H.; Weldon, D.; Zoeller, J. H., Calculation of calorific values of coals from ultimate analyses - theoretical basis and geochemical implications. Fuel, 1986, 65, 849–854.
(39)
Illinois Geological Survey. Coal Mines, Coal Geology and Resource Data; IGS: Champlain, Illinois, 2007; www.isgs.uiuc.edu/maps-data-pub/coal-maps.shtml.
S16
(40)
U.S. Energy Information Administration. Form FERC-423 Database, Monthly Cost and Quality of Fuels for Electric Plants Data; EIA: Washington, DC, 2007; www.eia.doe.gov/cneaf/electricity/page/ferc423.html.
(41)
U.S. Federal Energy Regulatory Commission. Monthly report of cost and quality of fuels for electric plants (form and instructions; OMB No. 1902-0024; FERC: Washington, DC, 2007; www.ferc.gov/docs-filing/eforms/form-423/form423.pdf.
(42)
U.S. Energy Information Administration. Table 4.1, Consumption of Fossil Fuels for Electricity Generation by Type of Power Producer, 1990 through 2001; Electric Power Annual 2001 data tables; EIA: Washington, DC, 2003; www.eia.doe.gov/cneaf/electricity/epa/epa_sum.html.
(43)
U.S. Energy Information Administration. Form EIA-423 Database, Monthly Nonutility Fuel Receipts and Fuel Quality Data; EIA: Washington, DC, 2007; www.eia.doe.gov/cneaf/electricity/page/eia423.html.
(44)
U.S. Energy Information Administration. Form EIA-423 instructions, EIA: Washington, DC, 2007; www.eia.doe.gov/cneaf/electricity/page/forms.html#e423.
(45)
U.S. Environmental Protection Agency. Electric Utility Steam Generating Units Section 112 Rule Making, Relevant Technical Data - Coal Analysis Results (four data files with associated text); EPA: Washington, DC, 2003; www.epa.gov/ttn/atw/combust/utiltox/utoxpg.html.
(46)
Quick, J. C.; Tabet, D. E.; Wakefield, S.; Bon, R. L. Optimizing technology to reduce mercury and acid gas emissions from electric power plants - a GIS study of coal chemistry, DOE contract DE-FG26-03NT41901; Utah Geological Survey: Salt Lake City, Utah, 2005; www.geology.utah.gov/emp/mercury/index.htm.
(47)
U.S. Energy Information Administration. The Coal Transportation Rate Database; EIA: Washington, DC, 2003; www.eia.doe.gov/cneaf/coal/ctrdb/database.html.
S17
(48)
U.S. Energy Information Administration. Form EIA-906 and EIA 920 Database; EIA: Washington, DC, 2008; www.eia.doe.gov/cneaf/electricity/page/eia906_920.html.
S18
Appendix
Data Tables Table AS1. Carbon dioxide emission factors for U.S. coal by origin state and county, 1999. Table AS1a. (SI units) Table AS1b. (U.S. customary units) Table AS2. Carbon dioxide emission factors for U.S. coal by destination state and power plant, 2005. Table AS2a. (SI units) Table AS2b. (U.S. customary units)
S19
In-ground coal
Explanation of Table SA1 headings
S20
ASTM %Fixed Carbon, dry, mineral-matter-free basis, numeric county average (ASTM 1990 rank parameter)
% Carbon, moist basis, numeric county average
C FC dmmf
% Sulfur, moist basis, numeric county average
% Ash, moist basis, numeric county average
Heating Value, numeric county average; gross, moist-basis British thermal units per pound coal (Btu/lb) multiplied by 0.002326 to convert to megajoules per kilogram (MJ/kg).
S
Ash
MJ/kg or Btu/lb
Number of data records
Warwick, P.D., Hook, R.W., 1995, International Journal of Coal Geology, v.28, p. 303-342.
WH n
Keystone Coal Industry Manual (1975 edition, McGraw-Hill Inc., New York, 996 p; or 2001 edition, Intertec Publishing Corp., Chicago Illinois, 737 p.)
Source of data, selected records from: COALQUAL, U.S. Geological Survey, Open-File Report 97-134, at: Illinois Geological Survey, coal resource data at:
State of coal origin, some states are divided according to historical (U.S. Bureau of Mines) convention. Coal quality values are weighted by county tonnage; the CO2 emission factor is weighted by energy (tons times heating value) County of coal origin, In-ground coal quality values are unweighted; produced and delivered values are weighted by tonnage, except for the CO2 emission factor, which is weighted by energy (tons times heating value)
KEY
IGS
Data CQ
County
STATE
Carbon dioxide emission factors for U.S. coal by origin state and county Table SA1a shows SI units. Table SA1b shows US customary units.
Produced coal 1999 (by origin)
l s b an
rank
MJ/kg m,mmf or Btu/lb m,mmf
S
Ash
MJ/kg or Btu/lb
n
ICR
lignite subbituminous bituminous anthracite
S21
Apparent ASTM rank class, with noted exceptions, determined using the produced Btu m,mmf and in-ground FC d,mmf values, assuming all western US coal is non-agglomerating
ASTM Heating Value, gross British thermal units per pound, moist, mineral-matter-free basis (Btu/lb m,mmf; ASTM 1990 rank parameter). Multiplied by 0.002326 to convert to moist, mineralmatter-free megajoules per kilogram (MJ/kg).
% Sulfur, moist basis
% Ash, moist basis
Heating Value, average moist-basis gross British thermal units per pound coal (Btu/lb). Multiplied by 0.002326 to convert to megajoules per kilogram (MJ/kg).
Number of data records
Source of data, selected records from: FERC-423, Monthly cost and quality of fuels for electric power plants, data at: FERC-580, Coal transportation rate data base for 1992-1999, at: 1999 Information Collection Request, raw data at: (4 zipped files, see "relevant technical data - coal analysis results"), compiled and adjusted to a moist basis at: (see final report appendicies).
Data 423 580
Produced Tons coal mine production reported in table 4 of the Coal Industry Annual 1999, at: . Thousand short tons of coal (Tons (1000)) multiplied by 0.9072 to convert to thousand metric tons (gigagrams, Gg)
Gg or Tons (1000)
Delivered coal 2005 (by origin)
S
Ash
MJ/kg or Btu/lb
n
Gg or Tons (1000)
d e f
c
b
a
notes
kg CO2/GJ or lbs CO2 per million Btu
C and Heating Value for in-
ASTM Heating Value and S
FC d,mmf for in-ground coal,
ASTM Heating Value and S
S22
% Sulfur, moist basis
% Ash, moist basis
Heating Value,moist-basis gross British thermal units per pound coal (Btu/lb). Multiplied by 0.002326 to convert to megajoules per kilogram (MJ/kg).
Number of data records
Tons of coal delivered to electric power plants during 2005, thousand short tons reported in the FERC-423 and EIA-423 data sets for 2005 . The year 2005 quality data for this coal are also from these data sets, which are at: and,
Carbon dioxide emission factor calculated from equation 5 using for produced coal. Carbon dioxide emission factor calculated from equation 6 using and S for produced coal. Carbon dioxide emission factor calculated from equation 5 using for in-ground coal. Carbon dioxide emission factor calculated from equation 1using ground coal (not adjusted for S). rank from adjacent or nearby counties rank uncertain
Carbon dioxide emission factor, pounds CO2 per million gross Btu, weighted by energy (produced tons times produced heating value) and, except where noted, calculated using equation 1 using in-ground C and Btu values that were adjusted with equations 2 and 3 to comport with the sulfur content of the produced coal. Multiplied by 0.42992 to convert to kilograms CO2 per gigajoule (kg CO2/GJ).
b
S23
Carbon dioxide emission factor calculated from equation 5 using ASTM Heating Value for delivered coal and S for delivered coal. Carbon dioxide emission factor calculated from equation 6 using FC dmmf for in-ground coal and S for delivered coal.
ASTM Heating Value, gross British thermal units per pound, moist, mineral-matter-free basis (Btu/lb m,mmf; ASTM 1990 rank parameter). Multiplied by 0.002326 to convert to moist, mineralmatter-free megajoules per kilogram (MJ/kg m,mmf).
MJ/kg m,mmf or Btu/lb m,mmf
notes a
Carbon dioxide emission factor, pounds CO2 per million gross Btu weighted by energy (delivered tons times delivered heating value). Except where noted, calculated with equation 1 using using in-ground C and Heating Value(s) (according to the county origin of each coal shipment) that were adjusted with equations 2 and 3 to comport with the sulfur content of the coal shipment (deilvered coal). Multiplied by 0.42992 to convert to kilograms CO2 per gigajoule (kg CO2/GJ).
kg CO2/GJ or lbs CO2 per million Btu
STATE County ALABAMA Bibb Cullman Fayette Jackson Jefferson Marion Tuscaloosa Walker Winston ALASKA Yukon-Koyukuk ARIZONA Navajo ARKANSAS Johnson Sebastion Scott COLORADO Delta Fremont Garfield Gunnison La Plata Mesa Moffat Montrose Rio Blanco Routt ILLINOIS Christian Franklin Gallatin Jackson Jefferson Logan Macoupin McDonough Montgomery Perry Randolph Saint Clair Saline Schuyler Vermilion Wabash Washington White Williamson unknown INDIANA Clay
2 86 1 67 3 313 161 9
10
10
4 2 1
n
26 7 16 35 4 4 47 2 8 40
40 54 29 10 28 129 125
48 19 13 15 65 1 37 1 8 1 43
12
Data
CQ CQ CQ CQ CQ CQ CQ CQ CQ
CQ
CQ
CQ CQ CQ
CQ CQ CQ CQ CQ CQ CQ CQ CQ CQ
IGS IGS IGS IGS IGS IGS IGS
IGS IGS IGS IGS IGS IGS IGS IGS IGS IGS IGS
CQ
MJ/kg
26.12
24.08 26.19 25.87 25.18 28.57 25.30 26.08 24.86 25.90 27.72 27.23
24.15 27.61 29.10 27.67 27.37 24.19 23.64
24.03 26.23 25.89 27.78 29.66 27.28 22.82 29.38 24.84 25.57
33.13 33.34 31.82
25.65
18.48
32.38 29.03 32.15 31.58 31.83 30.04 29.22 30.41
Ash 9.0
11.5 10.3 11.4 12.9 10.5 10.5 9.7 11.1 10.8 9.0 12.0
11.5 9.3 10.7 10.0 9.9 12.2 13.2
9.4 7.8 11.5 10.9 9.2 14.3 9.6 8.4 12.7 9.2
6.1 5.4 10.3
7.7
10.3
3.9 12.7 8.6 8.9 3.0 12.2 12.0 4.9
S 2.8
3.7 3.1 4.3 3.7 2.6 2.9 2.7 1.8 3.8 2.9 3.1
3.5 2.1 3.7 2.8 1.3 3.8 4.2
0.8 1.1 0.7 0.6 0.7 1.2 0.5 0.8 0.5 1.0
1.7 0.7 2.0
0.5
0.3
0.8 2.6 0.7 1.6 0.8 2.1 1.7 1.2
C 62.6
57.6 62.7 61.3 60.0 68.5 60.9 62.2 59.6 61.6 66.6 65.7
57.9 66.6 69.2 66.1 66.7 57.7 56.2
58.7 64.2 62.7 67.1 71.2 65.7 56.7 74.3 60.8 62.3
83.2 83.1 78.2
63.0
46.2
78.2 69.0 79.1 76.3 76.8 71.8 70.2 73.5
FC d,mmf 58.3
60.9 52.2 52.1 52.2 54.1 58.2 60.0
55.8 57.6 53.8
54.8 59.5 59.6 59.4 59.4 55.9 55.9
56.3 57.2 59.2 58.3 60.1 58.5 58.0 64.3 56.9 56.6
86.6 79.3 77.3
53.6
45.8
61.7 58.4 74.7 68.6 59.6 62.3 61.6 60.7
Data
Gg
n
Ash
423
699 1,176 3,071 2,111 19 30,848 64
423 423 423 423 423 423 423 423 423 423 423
423 423 423 423 423 423
423 423 423 423 423 423 423
8,398
4,198 740 3,417 2,126 4,157 458 1,540 2,210 2,283
223 259 7,065 326 1,213 8,949 36,668 65
10
216 1 21 22 15 46 20
1 3 140 57 117 36 72 23 17 91 25
2 22 121 12 10 124
127
423
25.85 25.90
28.25 26.28 25.17 25.70 24.85 27.45 22.81
29.52 26.26 23.88 25.09 23.65 25.94 26.61 28.39 26.62 29.33 26.10 27.80 24.35 24.22 22.97 24.92 25.60 25.71
27.26
S24
9.2 9.6
7.5 6.0 8.7 10.3 10.6 7.6 19.5
8.2 12.1 6.1 19.8 10.9 9.2 8.6 6.1 8.0 9.2 10.5 6.5 9.4 8.2 14.5 8.4 9.6 9.2
9.0
8.4 7.1
2.3 2.2
1.5 2.8 1.3 1.5 2.9 2.9 2.4
0.9 0.5 0.4 0.8 0.4 0.5 2.2 1.0 1.8 2.6 2.8 1.1 3.1 1.7 2.9 3.4 2.9 2.8
0.5
0.5 0.4
0.5 0.5 1.5
0.9 1.7 1.0 0.3
0.9
1.7
1.1 1.4
29.00
30.86 28.22 27.85 28.97 28.17 30.08 28.88
30.45 29.20 32.73 29.59 29.93 27.21 26.63 27.30 27.53 28.70 28.69
32.43 30.25 25.57 31.98 26.84 28.85
30.23
30.38
28.44
33.46 32.75 32.09
33.00
32.51
33.24
b
b b b b b b b
b b b b b b b b b b b
b b s b b b
b
s
b b b b b
b b b
b b b
32
423
25.81 28.04
9.6 9.6 5.9
12.0 13.4 11.7 10.3
12.9
12.6
12.6 14.8
S
27,207 1,559 220 7,395
25.48 25.48 33.17
29.06 27.90 27.98 18.48
28.36
27.99
28.48 27.84
MJ/kg m,mmf an b
423
24
82 35 5
423 423 580 423
103
423
42
2
rank
6,333 41 5,790 2,999 308 1,420 1,420 10,693 10,693 20 16 4
17,695 41 423 74 2,109 423
MJ/kg
notes
kg CO2 per GJ d d
d, f
d, e
87.85 88.03
88.22 88.28 87.87 87.99 87.35 88.01 88.45
87.90 88.50 91.15 92.56 89.78 89.50 87.98 88.74 88.53 87.51 87.46 89.38 87.66 88.04 87.89 a 87.79 87.70 87.33
89.67 89.66 89.78 d, f 88.60
88.73 88.44 87.89 87.99 88.62 91.63 91.63 90.04 90.04 91.89 92.01 91.34
88.16 87.91 a 88.45 d, e 87.33
62 23 10
2,396 226 50 24,898 72
4
55 20
1,189 1,330
2 31 5 8 325
72 157
1,920 5,258 14 761 53 249 9,837
5 43 68
135 12 12 177
12 306
102
22
24
15 60
58 23 32
129 544 1,161
6,297 377 1,943 7,937 25,115
242 9,885
37 29,193 2,513
11,619 11,619 37
273 2,406
4,559 106 2,335
9,908 229 12
Delivered coal 2005 (by origin)
Gg
Produced coal 1999 (by origin)
n
In-ground coal
27.55 22.22 24.48 25.95 26.91
25.24 25.93
24.79 22.84 25.97 27.89 28.11
24.60 24.40
26.75 28.55 26.12
23.77 24.84 22.47 25.80 26.44
25.98 27.64
22.48 25.90 27.44
25.38 25.38 22.48
27.85 27.54
30.60 28.29 29.22
29.38 28.33
MJ/kg
Table SA1a. Carbon dioxide emission factors for U.S. coal by origin state and county, 1999, SI units.
Ash 6.4 16.6 8.2 8.8 6.5
7.3 10.3
8.1 14.3 8.7 7.1 8.1
8.9 8.3
6.7 8.1 10.1
6.7 19.4 11.8 10.9 8.5
11.1 8.7
27.9 9.2 8.3
9.7 9.7 27.9
12.4 13.8
13.4 14.4 13.2
13.4 13.0
S 3.1 2.0 1.2 2.3 2.0
1.6 1.5
3.3 2.7 2.9 1.1 2.1
3.3 2.3
0.9 2.5 2.8
0.4 0.9 0.5 0.5 2.3
0.6 0.5
1.5 0.5 0.5
0.5 0.5 1.5
1.4 1.5
1.7 0.7 1.3
1.6 1.8
MJ/kg m,mmf 29.03
29.73 27.15 26.88
27.46 29.27
27.30 26.93 28.80 30.26 30.95
27.35 26.89
28.87 31.46 29.47
25.64 31.50 25.75 29.25
29.54 30.57
30.19
32.29
28.38
32.27 32.47
35.97 33.57 34.19
33.07
kg CO2 per GJ
87.97 88.57 89.24 a 87.88 88.09
87.75 87.98
87.83 87.65 87.29 88.26 88.05
87.62 87.85
88.83 87.52 87.46
91.16 92.55 89.75 89.48 87.92
88.75 88.59
90.01 89.55 89.62
90.04 90.04 90.01
87.73 88.04
87.37 90.15 88.60
87.86 87.70 a
notes
STATE County Daviess Dubois Gibson Greene Knox Owen Parke Pike Spencer Sullivan Vanderburgh Vigo Warrick unknown KANSAS Bourbon Linn KENTUCKY E Bell Boyd Breathitt Carter Clay Floyd Greenup Harlan Jackson Johnson Knott Knox Laurel Lawrence Lee Leslie Letcher Magoffin Martin Menifee Morgan Owsley Perry Pike Pulaski Rockcastle Whitley unknown KENTUCKY W Butler Christian Crittenden Daviess Hancock
Data
28.84 29.96 29.62 30.89
29.63 30.69
50 21 2 27 8 12 14 18 13 32 5 35 16 14 23
11 8 37 59
4 18
4 1
6 2
CQ CQ CQ CQ CQ CQ CQ CQ CQ CQ CQ CQ CQ CQ CQ
CQ CQ CQ CQ CQ CQ CQ
CQ CQ
CQ CQ
26.04 26.58
29.77 27.71
31.04 29.28 23.08 30.68 30.97 28.89 29.92 31.90 31.37 28.67 28.91 29.70 30.64 28.89 28.82
31.18 26.93 29.69
48 4 26
CQ CQ CQ
28.53
26.95 26.29
2 25
6
27.33 26.03 27.68 27.56 26.93 26.28 27.22 27.24 26.66
n
3 2 4 3 5 1 14 14 9
MJ/kg
CQ CQ
CQ CQ CQ CQ CQ CQ CQ CQ CQ CQ CQ CQ CQ
Ash 7.9 7.2
3.5 8.0
5.7 6.9
8.5 8.7 10.4 9.1
8.9 10.6 23.6 9.0 5.2 9.8 10.1 5.0 5.4 9.3 6.7 10.4 10.0 10.6 11.3
8.2 10.7 9.0
14.2
9.6 9.7
12.5 14.3 7.3 9.1 8.3 6.8 8.5 7.3 10.2
S 1.9 1.8
0.9 2.8
1.0 2.0
2.1 2.1 1.7 1.4
2.6 1.5 4.1 1.6 1.3 1.8 1.0 1.9 2.1 1.5 1.0 1.5 1.1 1.1 1.0
1.5 1.7 1.3
4.7
3.3 3.4
6.0 4.2 2.5 2.9 1.8 1.8 3.3 3.0 2.3
C 62.9 63.7
71.2 65.7
72.1 73.5
69.1 71.7 70.9 74.3
73.5 70.4 54.6 73.7 74.4 69.5 72.2 76.1 74.9 69.2 70.0 71.4 73.6 69.7 70.0
74.5 64.7 71.6
66.7
64.1 63.0
64.1 62.1 66.0 66.1 65.6 62.8 65.1 65.3 64.0
FC d,mmf 58.1 59.2
57.3 56.7
60.7 59.2
57.4 59.4 58.5 61.3
58.3 59.9 53.9 59.6 60.1 58.2 59.1 59.3 59.4 57.9 60.1 59.0 61.1 58.9 60.4
60.2 57.7 58.7
56.6
55.6 58.7
57.4 57.2 55.7 55.5 62.1 57.4 56.9 59.7 58.2
Gg 733
302
26,836
245
34 28 11,746 31,352
10,439
7,316 8,354
7,724 4 1,074 9,819 474 45 123
78 4,462
2,224
371 99,833 4,293
371
3,199 3,544
196 3,974 185 1,433
3,214 66 5,342 4,619 5,012
Data 423 423
423
423
39 1
44
29
2 9 482 1342 39
66 429 3 4 26 2 66 297 49 322
423 423 580 423 423 423 423 423 423 423 423 423 423 423
31 268 12 350
113 34 105
25
99 43
102 153 93 7 17 124 3 62
116
n
423 423 423 423
423 423 423
423
423 423
423 423 423 423 423 423 580 423
423
25.91 27.58
24.38
26.50
29.12
26.35 29.54 28.85 29.33 29.28
27.88 29.09 29.15 26.87 28.63 31.16 29.00 30.12 28.61 28.05
28.30 28.78 28.84 29.80
25.47 29.12 29.37 28.78 28.06
25.47
24.95 25.87
25.93 25.67 25.83 26.84 27.73 26.39 25.65 25.49
26.23
MJ/kg
Ash S25
9.2 7.8
16.7
13.0
7.8
15.0 7.9 10.3 9.6 9.5
11.5 9.9 8.9 11.9 9.4 5.4 9.8 7.6 10.5 11.7
11.1 10.3 12.2 8.7
19.6 9.8 9.0 10.2 12.0
19.6
9.2 9.9
8.9 9.4 9.4 7.8 6.7 9.5 8.7 9.6
8.0
S 2.9 3.7
4.3
3.2
1.0
0.6 1.7 1.0 1.0 1.3
1.3 1.1 0.7 1.5 1.0 0.7 1.1 1.4 1.2 0.8
1.0 0.9 0.9 1.0
4.1 1.0 1.4 0.8 1.0
4.1
1.1 3.6
2.3 1.8 2.4 1.1 2.1 3.4 1.9 1.8
1.9
MJ/kg m,mmf 28.91 30.32
29.98
31.86
31.47 32.41 32.52 32.77 32.73
31.90 32.67 32.29 30.95 31.92 33.13 32.50 32.91 32.37 32.16
32.22 32.43 33.30 32.99
32.63 32.40 32.30
32.62
27.73 29.16
28.80 28.64 28.87 29.36 30.00 29.59 28.38 28.51
28.80
rank b b
b
b
b b b b b
b b b b b b b b b b b b b b b
b b b
b
b b
b b b b b b b b b b
notes
kg CO2 per GJ 88.26 87.23
86.19
86.77
88.06
88.21 87.84 87.90 88.24 88.02 a
87.21 88.28 87.92 88.14 88.02 d, e 88.26 88.38 87.68 87.56 88.63 88.87 88.16 87.94 88.45 89.08
86.17 a 88.23 87.62 88.36 88.41
86.17
87.75 87.79
88.37 a 86.00 d, e 87.94 87.55 87.96 89.46 87.51 87.62 88.21 88.12
Delivered coal 2005 (by origin)
589 1021 14 7 20 554
12,416 17,488 290 60 374 7,048 23,375 9 17 31 2
32 5 39 318 31 278 1 3
1,118 14 303 6,384 329 5,126 12 9
5
3 2 7
473 1 28 266 26
154 44 31 1 57 173
11
9 66 4 20 5 85 26 2
180 27 74
111
9,058 7 593 7,308 181
74,175 2,268 356 403 9 1,032 1,990
207 2,406 1 464 64 3,113 1,224 12 97 97
11,573 1,478 1,766
2,519
Gg
Produced coal 1999 (by origin)
n
In-ground coal
26.71
28.81 29.14 27.30 27.41 28.96 27.25 26.62 28.14 29.11 28.15
27.81 28.14 27.46 29.24 27.59 28.29 29.39 27.38
29.31 29.67 28.44 28.82 28.82
28.78 29.53 26.86 28.86 27.98 28.74 28.83
24.42 26.23 24.77 25.15 27.42 25.17 26.08 24.90 27.60 27.60
25.97 25.87 26.12
26.60
MJ/kg
Table SA1a. Carbon dioxide emission factors for U.S. coal by origin state and county, 1999, SI units.
Ash 8.7
10.4 10.3 12.6 10.4 10.5 13.4 11.2 8.5 10.0 10.6
11.1 11.2 12.5 10.3 12.0 10.7 12.3 12.7
10.0 9.5 9.4 11.1 10.8
10.7 9.0 11.0 11.1 12.5 10.4 10.5
7.7 8.7 9.1 12.3 8.2 8.8 11.3 5.4 12.6 12.6
9.1 8.7 7.3
7.0
S 2.3
1.1 1.1 1.6 0.8 1.5 1.1 3.1 2.2 1.1 2.3
0.9 1.5 1.2 1.1 0.9 0.9 0.9 1.0
1.0 1.0 1.2 1.2 1.2
1.1 1.1 1.0 1.4 0.8 1.3 1.1
1.8 2.8 1.3 3.4 2.3 1.4 4.0 0.7 3.5 3.5
2.4 2.5 1.3
2.1
MJ/kg m,mmf 29.60
31.15 32.70 31.93
32.53 32.85 31.69 30.92 32.78 31.92
31.67 32.11 31.84 32.97 31.78 32.05 33.96 31.79
32.92 33.13 31.73 32.84 32.72
32.79 30.60 32.87 32.41 32.47 32.60
32.18
26.70 29.08 27.51 29.17 30.21 27.87 29.93 26.48
28.93 28.66 28.42
28.89
kg CO2 per GJ 87.62
87.88 88.21 88.00 a 89.22 87.92 88.23 a 86.87 87.22 87.35 87.54 a
88.63 88.60 88.12 88.00 88.52 89.05 88.13 a 88.10
88.15 88.10 88.30 88.37 87.53
88.18 87.68 88.27 88.31 88.36 a 87.12 88.21
87.52 87.81 88.40 87.57 87.86 a 87.66 87.67 89.75 a 86.00 86.00
87.91 87.33 88.32
88.23 a
notes
STATE County Henderson Hopkins McLean Muhlenberg Ohio Union Webster unknown LOUISIANA De Soto Red River MARYLAND Allegany Garrett MISSISSIPPI Choctaw MISSOURI Barton Bates MONTANA Big Horn Musselshell Powder River Richland Rosebud NEW MEXICO Cofax McKinley San Juan NORTH DAKOTA McLean Mercer Oliver OHIO Athens Belmont Carroll Columbiana Coshocton Gallia Guernsey Harrison Holmes Jackson Jefferson Mahoning Meigs Monroe Morgan Muskingum Noble Perry
1
6 32
1
6 3
61 6 65 7 39
6 50 61
1 45 4
3 92 11 22 31 20 59 24 12 23 18 13 2 24
19 30 20
CQ CQ
CQ CQ
KEY
CQ CQ
CQ CQ CQ CQ CQ
CQ CQ CQ
CQ CQ CQ
CQ CQ CQ CQ CQ CQ CQ CQ CQ CQ CQ CQ CQ CQ
CQ CQ CQ
Data
6 21 2 13 29 15 11
n
CQ CQ CQ CQ CQ CQ CQ
MJ/kg
28.01 28.48 26.74
27.66 28.05 28.83 28.47 28.42 26.70 27.93 29.10 29.24 25.96 28.03 28.54 25.01 28.50
15.10 16.35 16.42
31.11 22.66 20.98
20.35 23.45 17.48 15.55 19.90
28.50 24.34
12.10
30.77 30.33
18.50
25.32 26.78 26.86 26.66 26.93 26.22 28.03
Ash 9.8 13.7 11.0
9.2 14.4 11.1 12.5 8.6 12.1 13.0 10.4 8.0 11.3 13.1 14.2 19.2 14.5
5.7 7.8 5.9
9.2 15.5 18.3
6.0 7.9 6.6 6.2 8.4
15.6 19.8
14.7
11.8 13.7
5.2
12.1 13.5 10.5 13.6 12.8 12.9 11.7
S 4.0 3.8 3.3
1.8 3.6 2.8 3.7 3.7 4.0 3.8 2.6 3.7 2.9 2.8 3.2 3.0 4.3
0.5 0.9 0.6
0.5 0.8 0.6
0.6 0.8 0.5 0.4 1.0
5.6 4.9
0.6
1.2 2.1
1.4
3.7 4.4 3.2 5.3 3.9 4.9 4.2
C 66.3 67.3 63.7
66.6 66.5 68.6 67.3 67.4 63.3 65.9 69.8 69.1 62.4 67.2 67.5 59.4 66.9
38.3 41.9 42.3
74.7 54.5 51.3
50.9 58.4 44.4 40.3 49.8
66.7 57.7
76.1 73.8
45.9
60.9 63.1 63.5 62.4 63.5 61.8 66.0
FC d,mmf 54.4 55.6 55.1
55.1 55.9 55.9 57.8 55.0 54.4 55.2 57.8 54.0 55.9 59.1 56.3 56.4 54.5
54.0 53.7 52.5
59.5 53.5 54.3
56.8 60.2 54.8 53.3 58.5
61.7 56.5
79.6 75.7
50.2
55.1 55.3 56.5 55.2 55.4 55.6 57.7
Gg 249 12,237 26,450 1,058 10,988 14,405 28,246 6,525 17,524 4,197 20,394 6 4,887 145 457 91 200 62 2,555 158 1,290 650 7 4,074 445 989 601 650 870
2,679 2,028 650 3,481 396 3,085 16 16 356 66 289 37,288 24,801
1,149 6,765 530 3,073 119 6,422 7,743
Data 423 423 423 423 423 423 423 423 423 423 423 423 423 580 423 423 423
423 423 423
423 423 423
423 423
423
423 423
423 423
423 423
423 423 423 423 423 423 423
n 129 16 119 13 12 1 73 17 24 12 8 12 24 6 12 24 25
12 59 48
14 84 24
10 51
261
11 11
18 45
12 11
60 140 9 41 5 78 117
28.87 28.09 28.56 27.87 25.74 25.59 28.34 26.83 25.41 27.69 23.80 26.10 28.38 26.82 26.83 26.89 26.15
15.62 19.87 21.99 27.55 22.46 21.22 15.28 14.40 15.52 15.65 27.38
25.18 27.15 24.73 20.97 21.57
16.19 16.13 16.38 28.56 27.85 28.65 12.10
24.65 26.21 24.18 23.28 26.15 27.19 28.05
MJ/kg
Ash S26
9.7 12.6 9.7 7.6 11.9 14.3 10.2 10.8 12.7 11.5 19.1 12.3 10.2 12.3 12.7 13.9 11.6
8.0 9.6 19.7 15.6 15.6 23.2 9.2 11.3 8.5 8.8 11.1
16.4 12.5 17.3 6.8 5.3
12.5 12.2 13.3 15.3 15.0 15.4 14.7
12.9 13.3 15.8 24.4 11.2 9.3 11.5
S 3.9 3.5 2.4 2.7 2.8 2.0 2.6 3.6 3.5 2.3 3.5 3.5 4.4 4.7 4.6 4.6 2.7
0.5 0.8 0.7 0.6 0.6 0.8 0.7 0.7 0.7 0.9 3.5
3.6 3.2 3.7 0.5 0.4
0.9 1.0 0.7 1.8 1.3 1.9 0.6
3.4 3.2 3.5 5.3 3.9 2.8 2.7
MJ/kg m,mmf 32.51 32.76 32.03 30.50 29.69 30.38 32.05 30.57 29.64 31.79 30.16 30.32 32.18 31.24 31.40 31.97 30.05
16.38 17.08 17.27
33.17 27.01 28.42
17.08 22.18
22.88
31.61 30.65
33.37 34.52
18.57 19.13
28.83 30.79 29.36 32.06 29.98 30.39 32.23
rank b b b b b b b b b b b b b b b b b b
l l l
b b b
l s
s
b b
l
b b
l l
b b b b b b b
kg CO2 per GJ notes
94.86 91.88 88.95 87.99 88.29 89.58 93.87 92.86 94.13 94.23 87.05 88.24 d, e 86.79 86.93 87.05 87.24 87.28 86.95 87.85 86.54 87.92 87.98 86.43 86.95 86.00 86.14 a 86.51 86.27 87.51
92.27 92.61 a 91.22 89.33 90.58 89.17 95.38 95.38 c, d, f 87.14 86.42 87.32 91.83 91.79
88.15 86.76 86.38 85.58 86.37 87.04 86.69
Delivered coal 2005 (by origin)
113 6 94 171 117
3,733 442 4,351 6,359 2,091 1,998 1,998 0 7,326 737 6,589 3,268 3,268 494 3 491 34,178 22,160 49 3 240 11,726 25,963
71 36 36 119 84 57
13
382 2,778 5,500 2,129 628 552
267
302 58
7 242
31 3
12 48 48
9,159 16,804 21,742 7,006 9,252 5,484 23,233 63 8,221
85 29
313 2 1 11 75
4 23
12
70 80
25 1
48 117
2,247 4,094
Gg
Produced coal 1999 (by origin)
n
In-ground coal
26.24 26.61
29.49
26.16 27.89
28.27
28.80 27.06 28.93
22.30 21.73 15.24 14.54 15.48 15.73 28.53 26.41 28.66
26.70 23.94 26.36 27.86 25.01 16.04 16.04 15.77 28.24 26.69 28.41 11.85 11.85 25.21 28.39 25.19 20.82 21.38 24.31 20.75 15.74 19.86 21.93
24.93 26.89
MJ/kg
Table SA1a. Carbon dioxide emission factors for U.S. coal by origin state and county, 1999, SI units.
Ash 14.7 12.5
10.3
11.3 10.5
10.3
8.4 10.4 8.8
16.0 20.6 9.6 11.2 8.9 8.6 9.6 13.2 9.7
10.6 17.9 9.0 10.2 15.3 13.2 13.2 14.0 13.6 19.1 13.0 15.6 15.6 15.2 15.3 15.2 7.0 5.7 7.0 5.8 8.5 9.3 19.0
12.1 12.5
S 4.0 3.7
4.0
3.7 2.3
2.8
2.3 2.8 3.6
0.7 0.8 0.7 0.6 0.7 0.9 3.5 1.5 4.1
3.0 3.2 2.8 3.1 3.2 1.1 1.1 0.6 1.8 1.7 1.9 0.5 0.5 3.5 3.2 3.5 0.5 0.4 0.5 0.4 0.5 0.7 0.7
3.4 3.4
MJ/kg m,mmf 31.50 31.01
33.48
30.00 31.63
32.01
31.84 30.67 32.22
30.82 32.30
16.53 17.10 17.32
26.97 27.98
22.78 26.31 22.14 17.32 22.09
34.27 30.35
14.23
33.78 33.22
18.69 18.57
30.31 29.86 29.31 31.50 30.15
28.84 31.33
kg CO2 per GJ 86.44 87.21
86.15
87.91 87.99
87.77
87.07 87.20 87.15
88.26 89.59 93.79 92.89 94.15 94.26 87.05 88.29 86.71
86.52 86.48 87.01 86.58 87.10 a 92.43 92.43 a 91.26 89.29 90.45 89.17 95.61 95.61 a 87.39 86.48 87.39 91.84 91.79 91.40 93.08 94.87 91.91 89.11
88.17 86.73
notes
STATE County Stark Tuscarawas Vinton Washington unknown OKLAHOMA Craig Haskell Latimer Le Flore Okmulgee Rogers PA ANTHRACITE Carbon Columbia Dauphin Lackawanna Luzerne Northumberland Schuylkill Sullivan PENNSYLVANIA Allegheny Armstrong Beaver Bradford Bedford Butler Cambria Centre Clarion Clearfield Elk Fayette Greene Huntingdon Indiana Jefferson Lawrence Lycoming Somerset Tioga Venango Washington Westmoreland unknown TENNESSEE Anderson Campbell Claiborne Cumberland Fentress
7 7 2 7 1 3
2 1 4
14 7 7 4
13 14 9 1 4 33 26 4 18 64 70 46 30 1 67 34 21 3 70 4 4 33 12
12 10 10
1
CQ CQ CQ CQ CQ CQ
CQ CQ CQ
CQ CQ CQ CQ
CQ CQ CQ CQ CQ CQ CQ CQ CQ CQ CQ CQ CQ CQ CQ CQ CQ CQ CQ CQ CQ CQ CQ
CQ CQ CQ
CQ
Data
17 42 42 3
n
CQ CQ CQ CQ
MJ/kg
29.36
31.16 30.23 32.63
29.04 30.28 29.56 30.43 32.03 29.72 30.88 30.90 29.80 29.86 29.31 30.38 29.02 31.05 30.08 30.96 29.36 31.10 30.04 29.70 30.09 29.23 29.78
29.41 30.12 29.54 29.70
30.06 30.26 26.51
29.90 33.08 28.33 30.52 30.93 29.21
28.10 28.76 26.88 29.42
Ash 9.6
7.7 8.0 4.2
13.0 11.2 11.8 13.8 9.6 10.6 11.4 11.6 11.9 14.1 13.4 13.1 14.7 12.7 13.9 9.8 11.1 11.7 13.0 14.5 8.9 12.6 14.3
11.7 13.2 12.6 13.5
11.0 10.6 22.2
11.2 6.0 17.0 12.1 3.5 12.4
11.3 8.5 11.5 11.5
S 2.8
1.8 1.9 1.0
1.9 3.0 2.9 0.7 2.4 2.4 1.9 1.8 3.4 2.5 2.4 3.2 2.9 0.8 2.1 2.1 2.9 1.5 2.1 0.9 4.2 2.7 2.7
0.7 1.0 1.5 0.7
0.6 0.5 0.8
4.4 1.2 4.8 1.6 1.8 4.3
3.2 3.4 3.7 3.5
C 69.8
74.6 72.8 78.0
69.4 72.0 70.2 76.0 78.8 71.1 75.2 74.9 70.3 72.2 70.0 72.7 68.8 76.6 72.8 74.3 69.8 77.1 73.8 72.9 71.0 69.6 71.5
80.9 78.5 80.2 76.4
82.6 81.5 67.6
70.1 80.6 67.0 75.7 74.4 68.9
66.7 68.0 63.7 69.6
FC d,mmf 60.7
62.0 60.5 61.2
60.2 60.9 58.0 80.9 81.8 60.5 75.4 74.6 58.4 72.6 63.3 68.1 60.2 79.7 70.4 64.4 58.4 81.6 79.9 76.8 56.1 58.2 67.9
95.8 93.4 84.7 95.4 95.4 92.3 95.3 90.2
57.8 73.6 59.6 80.3 61.7 61.6
55.8 54.6 53.5 57.3
Gg
Data 102 47 16 181 2 193 57
10 1 61 12
423 423 423 423 423
84 8,764 430
2,756 83 423 797 ICR 1,113 423 232 423 3
36 255 30 25 658
423 423 423 423 423 423 423
1 28 54
10 251 14
2 2 50 14 5
12
17 11 1 28
4 59 32
423 423 423
423 423 423
423 ICR ICR 423 423
423 ICR ICR ICR 423 423
423 423 423
n
4,608 1,047 77 232 4,388
2 516 1,255 5 386 2,986 408 257 34,516
1,506 176 557 105 462 5 201 4,312 42 508 2 9 989 797 1,911 54 64,997 11 4,834 191
501 729 1,025
29.21 28.71 28.56 29.90 29.22
31.21 30.61 29.11
24.67 28.99
28.40 28.97
29.69 28.98 29.10 29.22 30.42
29.68 28.15 29.07
30.00 28.22 25.31 17.01 20.38 29.89 27.81 28.71 27.85
30.22 22.87
28.84 28.57 28.62 29.53 28.42
29.24 26.81 26.38
MJ/kg
Ash S27
9.6 9.6 9.3 7.7 11.1
9.6 7.1 11.9
22.6 13.9
14.6 12.2
9.3 13.3 10.5 9.7 7.7
10.7 12.4 13.0
6.6 10.31 16.8 39.0 31.8 9.5 8.9 13.3 12.0
9.2 24.5
14.5 11.7 16.1 13.5 16.2
8.1 11.3 10.4
S 1.2 1.3 1.1 1.4 0.9
1.3 1.5 2.0
0.8 2.0
1.8 1.7
1.5 1.9 1.6 1.7 1.9
1.1 3.3 2.1
1.4 0.6 0.6 0.6 0.5 1.9 1.4 1.9 1.6
3.9 0.6
3.4 3.4 3.3 3.7 3.4
2.3 3.3 3.0
MJ/kg m,mmf 32.13 31.82 32.71 33.26
34.93 33.24 33.57
32.68 34.26
33.86 33.53
33.12 33.98 32.93 32.77 33.31
33.64 32.75 34.00
30.86 33.70 32.11
32.39 31.80 30.97 29.35 30.95
33.85
32.98 34.97 34.88 34.74
32.18 30.75 29.87
rank b b b b b
b b b
b b b b b
b b b b b b b b b
b b b
an an b an an an an an
b b b b b b
b b b
kg CO2 per GJ notes d d d b, d
d, f
87.98 87.82 88.50 87.51 88.18 a 87.12 d, e
87.29 87.54 88.15
88.72 87.99 87.14 d, e 90.97 89.97
90.51 87.38 89.18 88.84 d 87.03 88.81 87.71 88.14 87.18
88.44 86.17 88.60 87.03 90.32 88.16 86.56 98.94 100.69 98.70 93.44 98.34 100.84 95.59 99.66 94.29 87.68 87.76 87.41 87.34
87.32 86.64 87.06
30 1,638 176 453 17,300 7 6,261 444 4 110 649 2 29 3,322 130 7,877 1,469 48 420 838 42
121 472
4 31 59 9
23 284 39 148 654 7 136 83 3 28 60 6 21 142 50 79
47 14
51 149 29 1
1 13 3 27 140 39 127 7
48
441
2,778 2 56 1 111 1,262 21 1,324 2 42,903 1,795 1,797 280 5
27
356
96 2,244 13 797
29 22 8
Delivered coal 2005 (by origin)
Gg
Produced coal 1999 (by origin)
n
In-ground coal
28.06 26.64 20.40 27.57 30.32 17.89 26.67 27.89 24.03 24.97 26.98 17.17 25.62 30.09 22.61 28.29 29.65 28.99 29.31 29.98 29.08
24.69 14.39
14.90 14.70 15.58 19.35 13.95 14.28 17.84 15.48 15.81 28.64 27.92 27.54 27.86 30.10
22.87
28.19
26.78 30.34 26.59 25.25
MJ/kg
Table SA1a. Carbon dioxide emission factors for U.S. coal by origin state and county, 1999, SI units.
Ash 12.3 16.3 33.3 14.6 7.8 39.7 18.4 13.0 17.8 21.5 18.1 37.3 14.7 7.8 21.9 12.4 8.9 10.2 9.1 8.6 10.4
20.8 44.1
40.5 42.8 32.8 27.5 47.5 41.8 30.5 39.0 35.8 12.0 12.6 15.9 12.6 8.2
28.5
16.3
10.0 7.4 13.0 23.0
S 2.4 1.7 1.7 2.8 2.0 0.8 2.2 1.8 2.5 1.0 1.8 0.5 2.9 1.6 1.2 1.7 1.4 1.7 1.4 1.3 0.7
2.8 1.6
0.4 0.5 0.4 0.7 0.5 0.4 0.5 0.4 0.4 2.0 2.0 2.9 2.1 1.5
1.5
4.1
3.2 2.7 2.0 2.7
MJ/kg m,mmf 32.72 32.59 33.14 32.82
32.50 32.40 31.84 32.96 33.27 31.36 33.53 32.57 29.92 32.56 33.72 28.84 30.67 32.98 29.62 32.65
32.00 27.53
32.22 33.57 32.38 33.13
27.37 24.17 27.64 28.71 26.14 26.54 26.89 25.88
33.21
34.59
30.19 33.16 31.07
kg CO2 per GJ
86.74 88.83 87.46 87.78 87.15 90.26 88.55 87.95 87.11 90.91 89.98 89.94 86.68 87.51 88.28 87.78 a 87.83 87.71 88.44 87.52 88.35 a
87.39 88.82
100.14 100.57 98.59 93.38 100.72 100.74 95.55 99.72 94.26 87.64 87.61 87.09 87.20 91.23
90.78
88.34
87.01 86.92 87.78 89.57
notes
STATE County Morgan Scott Sequatche TEXAS Atascosa Freestone Harrison Hopkins Leon Milam Panola Robertson Rusk Titus Webb UTAH Carbon Emery Sevier unknown VIRGINIA Buchanan Dickenson Lee Russell Scott Tazewell Wise Wythe unknown WASHINGTON King Lewis Thurston WEST VIRGINIA N. Barbour Braxton Brooke Cabell Grant Harrison Lewis Marion Marshall Mineral Monongalia Preston Tyler Tucker Upshur Webster Wood
1 2 7 2
6
4 5
9 52 7
55 41 24 25 9 25 68 4
8
1
26 2 1
1 6 13 3
1 8 1
6 7 16
CQ CQ CQ CQ
CQ
CQ WH
CQ CQ CQ
CQ CQ CQ CQ CQ CQ CQ CQ
KEY
CQ
CQ CQ CQ
KEY CQ CQ CQ
KEY CQ CQ
CQ CQ CQ
Data
2 8 2
n
CQ CQ CQ
MJ/kg
29.66 30.18 32.03
29.02 31.77
31.31 29.88 31.81
30.95 30.94 29.54
19.35
27.39
32.59 31.18 30.87 31.23 30.75 32.63 32.10 26.08
29.13 28.25 25.08
17.76 28.91
18.98
17.44 18.85 18.84 17.85
30.92 30.17 31.00
Ash 13.0 10.4 6.0
13.8 10.4
7.6 10.7 6.6
9.5 6.6 6.6
14.5
10.8
7.4 9.8 9.9 10.0 9.9 6.8 7.2 25.2
8.7 8.7 13.9
11.8 12.8
12.1
22.4 7.5 8.6 15.9
8.1 9.5 8.3
S 2.5 2.3 1.0
2.2 1.5
2.9 2.8 1.6
2.5 1.7 1.5
0.4
0.6
1.0 1.3 1.7 0.8 1.4 0.9 1.2 0.9
0.7 0.8 0.9
0.7 1.2
1.1
2.2 0.7 1.0 1.0
1.1 2.5 0.7
C 72.4 72.1 77.6
69.4 76.5
74.4 71.1 76.5
73.7 74.1 71.3
48.1
79.3 75.1 74.0 75.9 74.0 79.8 77.3 64.9
69.9 67.8 61.4
44.6 66.7
47.0
42.9 47.2 47.5 45.0
74.5 72.0 74.8
FC d,mmf 75.0 60.2 66.6
84.0 61.3 70.9
84.0 57.7 57.1 60.0
60.4 59.2 60.0
51.3
49.6
70.8 63.8 60.1 65.0 60.3 72.3 63.9 75.7
51.8 52.7 55.8
49.9
47.7
47.7 49.1 50.8 48.6
62.1 60.9 66.1
234 2,159 4,946
468 6,455 1 1,031 10,341 44 5,848 1,229
1,492
35,188 938
4 95 156
44 181 6 343 76
423 423 580 423 423 580 423 423
39 108
35 2 48
12 5
20 742
423 423
423 423 423
423 423
423 423
1,878 12,705
3,720 4 3,717
145 109 128 98
28.62 29.96 29.08
29.91 28.29 28.69 29.99 30.40
28.69 29.27
18.15 18.10 29.17 30.65 29.09 28.63
18.16
29.47 29.85
30.36 31.36 30.29 29.40 28.98
S28
13.5 10.2 12.0
9.8 11.7 14.8 9.0 9.4
13.8 11.1
15.1 14.6 10.9 8.9 12.9 10.5
15.1
10.7 9.9
8.9 6.9 8.9 9.5 14.1
9.4 9.1 10.1 8.3
27.23 27.34 27.59 26.45
423 423 423 423
Gg 29,296 9,667 3,781 907 357
Data 128 97 37
18.2 16.5 13.4 18.1 13.4 19.0
16.33 16.03 15.12 15.75 15.12 13.57
12 12 12 12 12 11
11 12 12
9.1 11.5 14.5 16.8 26.8 15.4 14.3
29.77 28.67 28.84 15.22 12.27 14.90 15.31
Ash
3 12 12
n
7 423 152 423 369 423 48,148 3,084 423 4,510 423 3,397 423 1,929 8,361 ICR 5,648 423 7,047 423 1,465 423 5,658 423 6,837 423 213 23,926 7,528 423 10,436 423 5,961 423
MJ/kg
S 1.7 1.9 0.9
2.8 3.7 1.7 2.2 1.4
1.7 3.3
0.9 0.9 2.7 1.3 1.4 3.7
0.9
0.7 1.1
1.0 0.8 1.2 0.9 0.7
0.4 0.5 0.4 0.4
1.1 1.1 1.1 0.9 1.1 0.5
1.6 1.4 0.9 1.0 1.8 0.7 1.2
MJ/kg m,mmf 33.65 33.81 33.49
33.68 32.66 34.27 33.40 33.94
33.87 33.49
34.02 33.92 32.56
21.68 21.49
33.39 33.53
33.92 33.59 32.84 34.25
30.37 31.00 29.07
20.31 19.50 17.66 19.67 17.66 17.07
17.22 17.87 18.09
33.13 32.82 34.27
rank b b b
b b b b b b b b
b b b
b s s
b b
b b b b
b b b
l l l l s s l s l l b
b b b
kg CO2 per GJ d, f
a a a
d,f a
notes
89.65 87.72 88.77
91.89 86.87 87.17 87.79 86.65 91.93 87.64 88.26
a b
d, e
b
91.22 88.71 c, f 91.23 a 90.86 87.51 87.64 87.84 87.79
89.68 88.21
88.67 89.24 88.30 88.10 89.06
88.08 87.81 88.36 91.83 89.99 91.55 92.21 92.37 91.57 90.55 92.97 92.08 92.97 92.07 84.49 88.47 88.01 88.05 89.86
Delivered coal 2005 (by origin)
767 2,171 78
2,743 11,654 8 6,900 685 990
39,570 1,281 126 281 54 202 4,815
4,794
19,087 7,784 4,968 6,320 16 16,492 2,689 825 1,454 1,010 61 178 10,178 9 89 4,794
5,169
146 120 8
149 197 4 523 62 54
113 8 22 6 18 174
12
149 76 126 23 3 12 611 1 9
244 92 101 6
12
24 12 12
12 24 12
41,546 3,020 10,295 3,854
5,566 11,700 1,942
12
120
Gg
Produced coal 1999 (by origin)
n
In-ground coal
29.24 28.84 26.88
28.46 28.78 27.85 29.37 30.19 29.14
28.80 29.44 28.89 28.27 27.79 22.65 28.62
18.26
26.32 27.00 25.61 26.04 28.04 29.30 29.06 29.90 29.19 28.86 30.00 29.54 29.36 30.01 29.71 18.26
14.10
14.11 15.98 16.02
15.19 12.25 16.04 15.46
29.05
MJ/kg
Table SA1a. Carbon dioxide emission factors for U.S. coal by origin state and county, 1999, SI units.
Ash 11.4 12.1 14.2
12.0 10.7 14.9 10.5 9.4 11.2
11.2 10.5 11.5 11.5 12.6 14.7 12.3
15.3
12.7 13.1 16.2 9.4 8.0 11.2 11.2 11.3 9.2 13.9 9.7 12.2 11.2 9.5 10.0 15.3
19.2
19.6 13.7 15.4
16.3 22.7 15.1 13.8
9.6
S 1.7 1.1 1.0
2.3 2.7 2.0 2.2 1.6 0.7
2.1 1.2 1.2 2.2 0.9 1.4 3.6
0.8
0.6 0.7 0.7 0.4 0.6 1.0 0.9 1.3 0.9 0.8 0.9 0.5 1.0 0.6 0.9 0.8
0.5
1.4 1.4 1.1
1.2 2.4 1.0 0.9
1.7
MJ/kg m,mmf 33.48 33.25 31.84
32.69 32.72 33.38 33.25 33.71 33.20
33.28 33.09 32.40 32.22 27.05 33.26
21.89
33.12 34.19 32.46 34.04 33.60 34.08 33.47 33.48 33.40
31.40 31.04 28.99 30.72
17.78
17.95 18.75 19.20
16.43 19.14 18.16
32.52
kg CO2 per GJ
87.75 88.71 88.31 a
87.90 87.23 a 91.82 b 87.62 88.20 88.31 a
87.66 87.64 87.88 88.23 88.29 a 91.89 b 86.79
91.19 a
88.57 87.94 87.96 89.85 88.78 a 88.44 89.19 88.26 88.11 89.02 88.35 89.72 88.23 91.31 88.18 a 91.19
92.09
90.31 92.03 a 92.09 a
91.56 89.51 91.44 92.38
87.73
notes
STATE County unknown WEST VIRGINIA S. Boone Clay Fayette Greenbrier Kanawha Lincoln Logan McDowell Mercer Mingo Nicholas Raleigh Randolph Wayne Wyoming unknown WYOMING Campbell Carbon Converse Johnson Lincoln Sheridan Sweetwater unknown IMPORT Columbia Indonesia Russia Venezuela UNKNOWN unknown
33 15 55
61 31 8 35 35 34 4 2 32
97 89 5 31 9 51 47
CQ CQ CQ
CQ CQ CQ CQ CQ CQ CQ CQ CQ
CQ CQ CQ CQ CQ CQ CQ
Data
37
n
CQ
MJ/kg
17.92 22.49 21.08 22.43 25.18 18.67 22.96
30.83 33.24 31.87 31.44 31.83 32.23 32.80 28.12 32.74
32.18 32.23 30.24
29.94
Ash 8.1 12.7 7.2 4.1 10.1 8.7 7.3
9.6 6.4 10.1 7.3 7.0 8.3 5.0 11.0 7.5
7.2 6.9 10.4
10.9
S 0.7 1.1 0.5 0.3 0.5 0.9 1.1
1.0 0.9 0.7 0.9 0.9 1.1 0.8 1.5 0.9
0.9 1.1 1.0
1.3
C 45.0 55.6 53.0 56.4 61.6 47.3 57.1
74.3 81.9 79.0 76.0 77.0 78.8 79.6 67.8 80.6
77.8 78.3 73.0
72.0
FC d,mmf 52.8 56.8 51.3 58.7 56.3 51.8 55.9
62.8 79.1 81.9 63.0 65.5 74.2 68.5 57.5 78.6
67.3 74.1 60.9
62.1
12 24
423
2562 125 225
231 45
864 136 311 3 580 20 217 9 1 687 160 27
n
423
423 423 423
305,834 267,434 2,474 23,262 3,919 69 8,676
423 423
6,062 8,198
Gg
423 423 423 423 423 423 423 423 423 423 423 423
Data
108,131 27,471 6,202 1,832 298 13,594 324 8,696 4,369 9 17,689 3,740 9,647
21.73
23.21
20.15 20.02 25.02 20.05
27.76 31.51
28.75 28.86 28.72 28.62 30.40 28.21 26.48 28.49 32.00 20.15 28.53 28.95 26.65
MJ/kg
Ash S29
10.1
4.9
5.3 5.1 6.3 6.0
11.4 6.9
11.9 11.0 12.2 11.7 9.7 13.2 14.7 12.1 6.0 5.6 11.6 11.6 19.7
S 0.5
0.7
0.3 0.3 0.6 0.3
0.8 0.7
0.8 0.8 0.9 1.1 0.9 0.8 0.8 0.8 0.7 0.3 0.7 1.0 1.0
MJ/kg m,mmf 24.40
24.52
21.20 26.88 21.42
31.72 34.10
32.81 33.13 32.83 34.04 32.93 31.52 32.84 34.26 21.44 32.68 33.16 33.98
rank s s s
s b s
b b
b b b b b b b b b b b b
kg CO2 per GJ notes
89.60 92.81 d, e 91.37
92.06 92.13 90.76 92.17
88.49 90.29
88.76 88.25 88.23 a 88.53 89.12 88.57 88.46 a 88.34 90.32 90.85 88.61 88.57 89.62
Delivered coal 2005 (by origin)
8,355 516 21,709 15,926 1,936 67 3,779 9,313 9,313
494 340 45 1 241 35 94
8,270 5,898 827 7 4,163 461 1,167 346,220 319,236 22 15,542 40 2,509
108
388 24 2 138
50 7
3988 4 288 1 12
297 20
509
8,319 5,670 211
1003 19 77
186
6,817 55,162 19,194 155 820
Gg
Produced coal 1999 (by origin)
n
In-ground coal
21.74 20.32 27.07 27.10 23.08 27.50 29.01 29.34 29.34
28.34 28.21 29.03 28.49 28.28 29.70 27.77 20.19 20.10 24.19 20.58 20.77 23.34
28.31 30.29
28.39
28.40 28.41 28.47 28.74 29.74
MJ/kg
Table SA1a. Carbon dioxide emission factors for U.S. coal by origin state and county, 1999, SI units.
Ash 10.1 5.2 6.1 6.4 2.3 9.0 6.6 10.4 10.4
12.2 13.7 11.6 10.2 10.9 10.1 12.7 5.2 5.0 6.3 5.4 5.0 4.8
12.4 9.0
12.4
11.5 12.1 11.7 12.4 9.9
S 0.5 0.3 0.6 0.6 0.2 0.5 0.6 2.1 2.1
0.7 0.9 1.3 0.5 0.8 0.7 1.2 0.3 0.3 0.5 0.3 0.3 0.9
0.7 1.8
0.8
0.9 0.8 0.8 0.8 1.1
MJ/kg m,mmf 33.23
29.15 23.72 30.49 31.30
24.40 21.52
21.26 25.97 21.85 21.95 24.64
32.67 33.16 33.30 32.05 32.09 33.38 32.25
32.73 33.68
32.82
32.65 33.25 33.38
32.49
kg CO2 per GJ 91.37 91.91 89.17 89.12 91.01 88.88 88.66 87.54 87.54
a
a a a a
a
88.60 88.58 89.57 89.03 88.49 90.28 88.15 a 92.10 92.14 90.79 92.19 92.10 89.54
88.36 89.99
88.57
88.31 a 88.46 88.25 88.25 a 88.53
notes
STATE County ALABAMA Bibb Cullman Fayette Jackson Jefferson Marion Tuscaloosa Walker Winston ALASKA Yukon-Koyukuk ARIZONA Navajo ARKANSAS Johnson Sebastion Scott COLORADO Delta Fremont Garfield Gunnison La Plata Mesa Moffat Montrose Rio Blanco Routt ILLINOIS Christian Franklin Gallatin Jackson Jefferson Logan Macoupin McDonough Montgomery Perry Randolph Saint Clair Saline Schuyler Vermilion Wabash Washington White Williamson
2 86 1 67 3 313 161 9
10
10
4 2 1
n
26 7 16 35 4 4 47 2 8 40
40 54 29 10 28 129 125
48 19 13 15 65 1 37 1 8 1 43
Data
CQ CQ CQ CQ CQ CQ CQ CQ CQ
CQ
CQ
CQ CQ CQ
CQ CQ CQ CQ CQ CQ CQ CQ CQ CQ
IGS IGS IGS IGS IGS IGS IGS
IGS IGS IGS IGS IGS IGS IGS IGS IGS IGS IGS
Btullb
10,351 11,261 11,122 10,826 12,283 10,878 11,211 10,689 11,137 11,918 11,708
10,384 11,869 12,510 11,897 11,768 10,401 10,162
10,332 11,275 11,132 11,942 12,754 11,727 9,809 12,631 10,681 10,993
14,243 14,335 13,680
11,028
7,945
13,922 12,482 13,821 13,578 13,683 12,916 12561 13,074
Ash 11.5 10.3 11.4 12.9 10.5 10.5 9.7 11.1 10.8 9.0 12.0
11.5 9.3 10.7 10.0 9.9 12.2 13.2
9.4 7.8 11.5 10.9 9.2 14.3 9.6 8.4 12.7 9.2
6.1 5.4 10.3
7.7
10.3
3.9 12.7 8.6 8.9 3.0 12.2 12.0 4.9
S 3.7 3.1 4.3 3.7 2.6 2.9 2.7 1.8 3.8 2.9 3.1
3.5 2.1 3.7 2.8 1.3 3.8 4.2
0.8 1.1 0.7 0.6 0.7 1.2 0.5 0.8 0.5 1.0
1.7 0.7 2.0
0.5
0.3
0.8 2.6 0.7 1.6 0.8 2.1 1.7 1.2
C 57.6 62.7 61.3 60.0 68.5 60.9 62.2 59.6 61.6 66.6 65.7
57.9 66.6 69.2 66.1 66.7 57.7 56.2
58.7 64.2 62.7 67.1 71.2 65.7 56.7 74.3 60.8 62.3
83.2 83.1 78.2
63.0
46.2
78.2 69.0 79.1 76.3 76.8 71.8 70.2 73.5
FC dmmf 60.9 52.2 52.1 52.2 54.1 58.2 60.0
55.8 57.6 53.8
54.8 59.5 59.6 59.4 59.4 55.9 55.9
56.3 57.2 59.2 58.3 60.1 58.5 58.0 64.3 56.9 56.6
86.6 79.3 77.3
53.6
45.8
61.7 58.4 74.7 68.6 59.6 62.3 61.6 60.7
Data
Tons (1000)
423
423 423 423 423 423 423 423 423 423 423 423
423 423 423 423 423 423
216 1 21 22 15 46 20
1 3 140 57 117 36 72 23 17 91 25 12,146 11,300 10,823 11,047 10,682 11,802 9,806
12,693 11,288 10,267 10,786 10,169 11,154 11,440 12,206 11,445 12,609 11,220 11,954 10,468 10,414 9,877 10,715 11,004 11,053
127 2 22 121 12 10 124
11,719
32
10,955 10,955 14,259
12,492 11,996 12,027 7,945
12,191
12,034
12,245 11,971
Btu/lb 11,095 12,055
24
82 35 5
423 423 580 423
103
9,257 423 423 770 423 1,296 423 3,385 423 2,327 423 21 423
4,627 816 3,767 2,344 4,582 505 1,698 2,436 2,516
246 285 7,788 359 1,337 9,864 40,419 72
2 42
n
423
29,990 1,718 423 242 8,151 423
6,981 45 6,382 3,306 339 1,565 1,565 11,787 11,787 22 18 4
19,505 45 423 82 2,325 423
Ash S30
7.5 6.0 8.7 10.3 10.6 7.6 19.5
8.2 12.1 6.1 19.8 10.9 9.2 8.6 6.1 8.0 9.2 10.5 6.5 9.4 8.2 14.5 8.4 9.6 9.2
9.0
8.4 7.1
9.6 9.6 5.9
12.0 13.4 11.7 10.3
12.9
12.6
12.6 14.8
S 1.5 2.8 1.3 1.5 2.9 2.9 2.4
0.9 0.5 0.4 0.8 0.4 0.5 2.2 1.0 1.8 2.6 2.8 1.1 3.1 1.7 2.9 3.4 2.9 2.8
0.5
0.5 0.4
0.5 0.5 1.5
0.9 1.7 1.0 0.3
0.9
1.7
1.1 1.4
rank
Btu/lb mmmf 13,266 12,134 11,974 12,456 12,113 12,931 12,416
13,090 12,554 14,069 12,720 12,869 11,700 11,449 11,735 11,834 12,339 12,334
13,944 13,004 10,993 13,748 11,537 12,404
b b b b b b b
b b b b b b b b b b b
b b s b b b
13,059 b b 12,998 b
an b
12,228 b
s
14,189 b b 14,386 b 14,080 b 13,797 b
14,293 b b 13,978 b
notes
lbs CO2 per million Btu 205.2 205.3 204.3 204.6 203.1 204.7 205.7
204.4 205.8 212.0 215.3 208.8 208.1 204.6 206.4 205.9 203.5 203.4 207.9 203.9 204.8 204.4 a 204.2 204.0 203.1
208.5 208.5 208.8 d, f 206.0
206.3 205.7 d, e 204.4 204.6 206.1 213.1 213.1 d, f 209.4 209.4 213.7 214.0 d 212.4 d
205.0 204.4 a 205.7 d, e 203.1
2 31 5 8 325 55 20 62 23
1,310 1,466 2,641 250
72 157
2,116 5,796 15 839 59 274 10,843
5 43 68
135 12 12 177
12 306
102
22
24
15 60
58 23 32
12
142 600 1,280
6,941 415 2,142 8,749 27,684
266 10,896
41 32,179 2,770
12,808 12,808 41
300 2,652
5,025 117 2,574
10,921 252
Tons (1000)
Delivered coal 2005 (by origin)
n
Produced coal 1999 (by origin)
11,845 9,552
10,849 11,148
10,657 9,821 11,165 11,992 12,085
10,576 10,492
11,500 12,272 11,228
10,221 10,680 9,660 11,091 11,369
11,169 11,884
9,663 11,133 11,799
10,911 10,911 9,663
11,973 11,840
13,157 12,161 12,562
12,631 12,179
Btu/lb
In-ground coal
6.4 16.6
7.3 10.3
8.1 14.3 8.7 7.1 8.1
8.9 8.3
6.7 8.1 10.1
6.7 19.4 11.8 10.9 8.5
11.1 8.7
27.9 9.2 8.3
9.7 9.7 27.9
12.4 13.8
13.4 14.4 13.2
13.4 13.0
Ash
Table SA1b. Carbon dioxide emission factors for U.S. coal by origin state and county, 1999, U.S. customary units.
S 3.1 2.0
1.6 1.5
3.3 2.7 2.9 1.1 2.1
3.3 2.3
0.9 2.5 2.8
0.4 0.9 0.5 0.5 2.3
0.6 0.5
1.5 0.5 0.5
0.5 0.5 1.5
1.4 1.5
1.7 0.7 1.3
1.6 1.8
Btu/lb mmmf 12,784 11,672
11,804 12,582
11,737 11,578 12,382 13,009 13,305
11,759 11,562
12,410 13,526 12,672
11,024 13,544 11,070 12,573
12,700 13,143
12,980
13,884
12,202
13,875 13,959
15,462 14,431 14,701
14,220
lbs CO2 per million Btu 204.6 206.0
204.1 204.6
204.3 203.8 203.0 205.3 204.8
203.8 204.3
206.6 203.5 203.4
212.0 215.2 208.7 208.1 204.5
206.4 206.0
209.3 208.3 208.4
209.4 209.4 209.3
204.0 204.7
203.2 209.7 206.0
204.3 203.9 a
notes
STATE County unknown INDIANA Clay Daviess Dubois Gibson Greene Knox Owen Parke Pike Spencer Sullivan Vanderburgh Vigo Warrick unknown KANSAS Bourbon Linn KENTUCKY E Bell Boyd Breathitt Carter Clay Floyd Greenup Harlan Jackson Johnson Knott Knox Laurel Lawrence Lee Leslie Letcher Magoffin Martin Menifee Morgan Owsley Perry Pike Pulaski Rockcastle Whitley unknown
Data
12,398 12,883 12,734 13,279
12,740 13,194
50 21 2 27 8 12 14 18 13 32 5 35 16 14 23
11 8 37 59
4 18
CQ CQ CQ CQ CQ CQ CQ CQ CQ CQ CQ CQ CQ CQ CQ
CQ CQ CQ CQ CQ CQ CQ
13,343 12,589 9,923 13,189 13,315 12,420 12,862 13,715 13,487 12,327 12,427 12,770 13,174 12,420 12,392
13,404 11,580 12,765
48 4 26
CQ CQ CQ
11,585 11,301
2 25
12,264
11,751 11,192 11,900 11,850 11,578 11,300 11,702 11,710 11,464
3 2 4 3 5 1 14 14 9
6
11,230
n
12
Btullb
CQ CQ
CQ CQ CQ CQ CQ CQ CQ CQ CQ CQ CQ CQ CQ CQ
Ash 5.7 6.9
8.5 8.7 10.4 9.1
8.9 10.6 23.6 9.0 5.2 9.8 10.1 5.0 5.4 9.3 6.7 10.4 10.0 10.6 11.3
8.2 10.7 9.0
14.2
9.6 9.7
12.5 14.3 7.3 9.1 8.3 6.8 8.5 7.3 10.2
9.0
S 1.0 2.0
2.1 2.1 1.7 1.4
2.6 1.5 4.1 1.6 1.3 1.8 1.0 1.9 2.1 1.5 1.0 1.5 1.1 1.1 1.0
1.5 1.7 1.3
4.7
3.3 3.4
6.0 4.2 2.5 2.9 1.8 1.8 3.3 3.0 2.3
2.8
C 72.1 73.5
69.1 71.7 70.9 74.3
73.5 70.4 54.6 73.7 74.4 69.5 72.2 76.1 74.9 69.2 70.0 71.4 73.6 69.7 70.0
74.5 64.7 71.6
66.7
64.1 63.0
64.1 62.1 66.0 66.1 65.6 62.8 65.1 65.3 64.0
62.6
FC dmmf 60.7 59.2
57.4 59.4 58.5 61.3
58.3 59.9 53.9 59.6 60.1 58.2 59.1 59.3 59.4 57.9 60.1 59.0 61.1 58.9 60.4
60.2 57.7 58.7
56.6
55.6 58.7
57.4 57.2 55.7 55.5 62.1 57.4 56.9 59.7 58.2
58.3
Tons (1000)
423 423 423 423 423 423 580 423
423 423
Data 423 423 423 423
270 423
37 31 12,947 34,559
86 423 4,918 423 423 8,514 423 4 1,184 423 10,823 423 522 580 50 423 136 423 423 8,064 423 9,209 423 423 11,507 423
409 423 110,045 4,732 423 423 2,452 423
409
3,526 423 3,907 423
216 4,380 204 1,580
34,004 70 3,543 73 5,888 5,092 5,525
n 29
12,518
11,327 12,700 12,402 12,608 12,590
11,987 12,508 12,534 11,552 12,308 13,397 12,467 12,948 12,302 12,061
66 429 3 4 26 2 66 297 49 322 2 9 482 1342 39
12,167 12,373 12,400 12,813
S31
7.8
15.0 7.9 10.3 9.6 9.5
11.5 9.9 8.9 11.9 9.4 5.4 9.8 7.6 10.5 11.7
11.1 10.3 12.2 8.7
19.6 9.8 9.0 10.2 12.0
19.6
10,949 10,949 12,520 12,629 12,374 12,063
9.2 9.9
8.9 9.4 9.4 7.8 6.7 9.5 8.7 9.6
9.2 9.6 8.0
Ash
10,726 11,124
11,150 11,037 11,104 11,540 11,920 11,345 11,029 10,958
31 268 12 350
113 34 105
25
99 43
102 153 93 7 17 124 3 62
10 116
Btu/lb 11,114 11,137 11,276
S 1.0
0.6 1.7 1.0 1.0 1.3
1.3 1.1 0.7 1.5 1.0 0.7 1.1 1.4 1.2 0.8
1.0 0.9 0.9 1.0
4.1 1.0 1.4 0.8 1.0
4.1
1.1 3.6
2.3 1.8 2.4 1.1 2.1 3.4 1.9 1.8
2.3 2.2 1.9
rank
Btu/lb mmmf b b b b b
b b b b b b b b b b b b b b b
13,697 b
13,531 13,934 13,979 14,090 14,073
13,717 14,045 13,884 13,304 13,724 14,244 13,974 14,150 13,918 13,827
13,852 13,944 14,317 14,183
14,028 b 13,931 b 13,888 b
14,023 b
11,921 b 12,535 b
12,466 b 12,383 b b 12,380 b 12,313 b 12,410 b 12,623 b 12,897 b 12,719 b 12,199 b 12,258 b
notes
lbs CO2 per million Btu 204.8
205.1 204.3 204.4 205.2 204.7 a
202.8 205.3 204.5 205.0 204.7 d, e 205.3 205.5 203.9 203.6 206.1 206.7 205.0 204.5 205.7 207.2
200.4 a 205.2 203.8 205.5 205.6
200.4
204.1 204.2
204.3 204.7 205.5 a 200.0 d, e 204.5 203.6 204.6 208.1 203.5 203.8 205.1 204.9
11,954 12,099 11,805 12,570 11,862 12,162 12,635 11,773 12,387 12,527 11,738 11,782 12,452 11,717
32 5 39 318 31 278 1 3
1,232 15 333 7,037 363 5,651 13 10
13,686 589 19,277 1021 320 14 66 7 413 20 7,769 554
12,602 12,754 12,229 12,391 12,392
473 1 28 266 26
9,984 8 654 8,055 199
12,373 12,695 11,548 12,407 12,031 12,355 12,395
10,500 11,277 10,649 10,810 11,790 10,819 11,211 10,703 11,866 11,866
11,165 11,121 11,230
10,526 11,155 11,570 11,438
154 44 31 1 57 173
11
9 66 4 20 5 85 26 2
180 27 74
4 111
10
81,762 2,500 393 444 10 1,138 2,194
228 2,652 1 512 70 3,431 1,349 13 107 107
12,757 1,629 1,947
55 27,445 79 2,776
Tons (1000)
Delivered coal 2005 (by origin)
n
Produced coal 1999 (by origin)
Btu/lb
In-ground coal
10.4 10.3 12.6 10.4 10.5 13.4
11.1 11.2 12.5 10.3 12.0 10.7 12.3 12.7
10.0 9.5 9.4 11.1 10.8
10.7 9.0 11.0 11.1 12.5 10.4 10.5
7.7 8.7 9.1 12.3 8.2 8.8 11.3 5.4 12.6 12.6
9.1 8.7 7.3
8.2 8.8 6.5 7.0
Ash
Table SA1b. Carbon dioxide emission factors for U.S. coal by origin state and county, 1999, U.S. customary units.
S 1.1 1.1 1.6 0.8 1.5 1.1
0.9 1.5 1.2 1.1 0.9 0.9 0.9 1.0
1.0 1.0 1.2 1.2 1.2
1.1 1.1 1.0 1.4 0.8 1.3 1.1
1.8 2.8 1.3 3.4 2.3 1.4 4.0 0.7 3.5 3.5
2.4 2.5 1.3
1.2 2.3 2.0 2.1
Btu/lb mmmf 13,984 14,124 13,625 13,292 14,094 13,725
13,614 13,804 13,689 14,176 13,662 13,778 14,602 13,668
14,155 14,242 13,643 14,118 14,066
14,098 13,157 14,133 13,933 13,958 14,014
13,836
11,479 12,504 11,828 12,541 12,988 11,983 12,867 11,384
12,437 12,321 12,219
12,482 12,419
11,558
lbs CO2 per million Btu
204.4 205.1 204.6 a 207.5 204.5 205.2 a
206.1 206.1 204.9 204.6 205.9 207.1 205.0 a 204.9
205.0 204.9 205.4 205.5 203.6
205.1 203.9 205.3 205.4 205.5 a 202.6 205.2
203.5 204.2 205.6 203.7 204.3 a 203.9 203.9 208.7 a 200.0 200.0
204.4 203.1 205.4
207.5 a 204.4 204.9 205.2 a
notes
STATE County KENTUCKY W Butler Christian Crittenden Daviess Hancock Henderson Hopkins McLean Muhlenberg Ohio Union Webster unknown LOUISIANA De Soto Red River MARYLAND Allegany Garrett MISSISSIPPI Choctaw MISSOURI Barton Bates MONTANA Big Horn Musselshell Powder River Richland Rosebud NEW MEXICO Cofax McKinley San Juan NORTH DAKOTA McLean Mercer Oliver OHIO Athens Belmont Carroll Columbiana Coshocton Gallia Guernsey Harrison Holmes
6 2 6 21 2 13 29 15 11
1
6 32
1
6 3
61 6 65 7 39
6 50 61
1 45 4
3 92 11 22 31 20 59 24 12
CQ CQ CQ CQ CQ CQ CQ CQ CQ
CQ CQ
CQ CQ
KEY
CQ CQ
CQ CQ CQ CQ CQ
CQ CQ CQ
CQ CQ CQ
CQ CQ CQ CQ CQ CQ CQ CQ CQ
Data
4 1
n
CQ CQ
Btullb
11,893 12,058 12,394 12,242 12,218 11,480 12,009 12,511 12,571
6,491 7,028 7,060
13,375 9,741 9,019
8,750 10,082 7,516 6,686 8,555
12,251 10,465
5,200
13,228 13,039
7,955
11,197 11,427 10,886 11,513 11,550 11,462 11,576 11,272 12,053
12,797 11,913
Ash 9.2 14.4 11.1 12.5 8.6 12.1 13.0 10.4 8.0
5.7 7.8 5.9
9.2 15.5 18.3
6.0 7.9 6.6 6.2 8.4
15.6 19.8
14.7
11.8 13.7
5.2
7.9 7.2 12.1 13.5 10.5 13.6 12.8 12.9 11.7
3.5 8.0
S 1.8 3.6 2.8 3.7 3.7 4.0 3.8 2.6 3.7
0.5 0.9 0.6
0.5 0.8 0.6
0.6 0.8 0.5 0.4 1.0
5.6 4.9
0.6
1.2 2.1
1.4
1.9 1.8 3.7 4.4 3.2 5.3 3.9 4.9 4.2
0.9 2.8
C 66.6 66.5 68.6 67.3 67.4 63.3 65.9 69.8 69.1
38.3 41.9 42.3
74.7 54.5 51.3
50.9 58.4 44.4 40.3 49.8
66.7 57.7
76.1 73.8
45.9
62.9 63.7 60.9 63.1 63.5 62.4 63.5 61.8 66.0
71.2 65.7
FC dmmf 55.1 55.9 55.9 57.8 55.0 54.4 55.2 57.8 54.0
54.0 53.7 52.5
59.5 53.5 54.3
56.8 60.2 54.8 53.3 58.5
61.7 56.5
79.6 75.7
50.2
58.1 59.2 55.1 55.3 56.5 55.2 55.4 55.6 57.7
57.3 56.7
Tons (1000)
Data
275 13,489 29,156 1,166 12,112 15,878 31,135 7,192 19,317 4,626 22,480 7 5,387 160 504 100 221 68 2,816 174
2,953 2,236 717 3,837 436 3,401 18 18 392 73 319 41,102 27,338
423 423 423 423 423 423 423 423
423 423 423
423 423 423
423 423
423
423 423
423 423
423 423
808 423 423 1,267 423 7,457 423 584 423 3,387 423 131 423 7,079 423 8,535 423
333 423
29,581
n 129 16 119 13 12 1 73 17
12 59 48
14 84 24
10 51
261
11 11
18 45
12 11
39 1 60 140 9 41 5 78 117
44
12,414 12,075 12,280 11,980 11,067 11,001 12,185 11,535
6,714 8,542 9,453 11,845 9,654 9,124 6,570 6,189 6,674 6,728 11,771
S32
9.7 12.6 9.7 7.6 11.9 14.3 10.2 10.8
8.0 9.6 19.7 15.6 15.6 23.2 9.2 11.3 8.5 8.8 11.1
16.4 12.5 17.3 6.8 5.3
12.5 12.2 13.3 15.3 15.0 15.4 14.7
6,962 6,937 7,042 12,278 11,974 12,317 5,200 10,826 11,673 10,632 9,016 9,273
9.2 7.8 12.9 13.3 15.8 24.4 11.2 9.3 11.5
11,138 11,856 10,597 11,268 10,396 10,009 11,243 11,689 12,061
16.7
13.0
Btu/lb 10,481
Ash
11,395
S 3.9 3.5 2.4 2.7 2.8 2.0 2.6 3.6
0.5 0.8 0.7 0.6 0.6 0.8 0.7 0.7 0.7 0.9 3.5
3.6 3.2 3.7 0.5 0.4
0.9 1.0 0.7 1.8 1.3 1.9 0.6
2.9 3.7 3.4 3.2 3.5 5.3 3.9 2.8 2.7
4.3
3.2
rank
Btu/lb mmmf
l l
b b b b b b b b b
13,975 14,082 13,769 13,112 12,764 13,063 13,779 13,145
7,044 7,343 7,425
b b b b b b b b b
l l l
14,260 b 11,613 b 12,217 b
7,344 l 9,536 s
9,839 s
13,590 b 13,178 b
l
14,348 b 14,842 b
7,982 8,223
12,431 13,034 12,394 13,238 12,624 13,783 12,890 13,066 13,855
12,890 b
lbs CO2 per million Btu notes
220.6 213.7 206.9 204.6 205.3 208.3 218.3 215.9 218.9 219.1 202.4 205.2 d, e 201.8 202.2 202.4 202.9 203.0 202.2 204.3 201.3
214.6 215.4 a 212.1 207.7 210.7 207.4 221.8 221.8 c, d, f 202.6 201.0 203.1 213.6 213.5
205.2 202.9 205.0 201.8 200.9 199.0 200.9 202.4 201.6
200.4
201.8
113 6 94 171 117
4,115 487 4,797 7,009 2,305 2,202 2,202 0 8,076 813 7,263 3,603 3,603 545 3 541 37,674 24,427 54 3 265 12,926 28,619
7 242 71 36 36 119
421 3,062 6,063 2,347
12 48 48
10,096 18,523 23,966 7,723 10,198 6,045 25,610 69 9,062
85 29
313 2 1 11 75
4 23
12
70 80
25 1
5 48 117
3 2 7
2 2,477 4,512
25,766 10 19 34
Tons (1000)
Delivered coal 2005 (by origin)
n
Produced coal 1999 (by origin)
12,155
12,382 11,634 12,436
9,586 9,342 6,552 6,251 6,656 6,763 12,267 11,355 12,321
11,478 10,294 11,331 11,978 10,754 6,895 6,895 6,782 12,142 11,474 12,216 5,096 5,096 10,837 12,206 10,828 8,952 9,190 10,452 8,921 6,767 8,539 9,428
11,485 10,716 11,561
11,443 12,099 12,517 12,102
Btu/lb
In-ground coal
10.3
8.4 10.4 8.8
16.0 20.6 9.6 11.2 8.9 8.6 9.6 13.2 9.7
10.6 17.9 9.0 10.2 15.3 13.2 13.2 14.0 13.6 19.1 13.0 15.6 15.6 15.2 15.3 15.2 7.0 5.7 7.0 5.8 8.5 9.3 19.0
8.7 12.1 12.5
11.2 8.5 10.0 10.6
Ash
Table SA1b. Carbon dioxide emission factors for U.S. coal by origin state and county, 1999, U.S. customary units.
S 2.8
2.3 2.8 3.6
0.7 0.8 0.7 0.6 0.7 0.9 3.5 1.5 4.1
3.0 3.2 2.8 3.1 3.2 1.1 1.1 0.6 1.8 1.7 1.9 0.5 0.5 3.5 3.2 3.5 0.5 0.4 0.5 0.4 0.5 0.7 0.7
2.3 3.4 3.4
3.1 2.2 1.1 2.3
Btu/lb mmmf 13,762
13,688 13,185 13,850
13,251 13,885
7,108 7,354 7,447
11,597 12,031
9,794 11,311 9,518 7,447 9,499
14,733 13,048
6,118
14,524 14,284
8,035 7,986
13,030 12,838 12,600 13,543 12,962
12,727 12,398 13,468
13,391 14,059 13,725
lbs CO2 per million Btu 204.1
202.5 202.8 202.7
205.2 208.3 218.1 216.0 218.9 219.2 202.4 205.3 201.7
201.2 201.1 202.4 201.4 202.6 a 215.0 215.0 a 212.2 207.6 210.3 207.4 222.3 222.3 a 203.2 201.1 203.2 213.6 213.5 212.6 216.5 220.6 213.7 207.2
203.8 205.1 201.7
202.0 202.8 203.1 203.6 a
notes
STATE County Jackson Jefferson Mahoning Meigs Monroe Morgan Muskingum Noble Perry Stark Tuscarawas Vinton Washington unknown OKLAHOMA Craig Haskell Latimer Le Flore Okmulgee Rogers PA ANTHRACITE Carbon Columbia Dauphin Lackawanna Luzerne Northumberland Schuylkill Sullivan PENNSYLVANIA Allegheny Armstrong Beaver Bradford Bedford Butler Cambria Centre Clarion Clearfield Elk Fayette Greene Huntingdon Indiana Jefferson Lawrence Lycoming
19 30 20 17 42 42 3
7 7 2 7 1 3
2 1 4
14 7 7 4
13 14 9 1 4 33 26 4 18 64 70 46 30 1 67 34 21 3
CQ CQ CQ CQ CQ CQ CQ
CQ CQ CQ CQ CQ CQ
CQ CQ CQ
CQ CQ CQ CQ
CQ CQ CQ CQ CQ CQ CQ CQ CQ CQ CQ CQ CQ CQ CQ CQ CQ CQ
Data
23 18 13 2 24
n
CQ CQ CQ CQ CQ
Btullb
12,485 13,020 12,708 13,083 13,772 12,779 13,274 13,285 12,812 12,835 12,601 13,060 12,475 13,349 12,931 13,309 12,624 13,372
12,644 12,950 12,699 12,768
12,925 13,010 11,397
12,856 14,220 12,180 13,119 13,297 12,558
12,040 12,246 11,496 12,083 12,363 11,556 12,647
11,160 12,050 12,268 10,752 12,254
Ash 13.0 11.2 11.8 13.8 9.6 10.6 11.4 11.6 11.9 14.1 13.4 13.1 14.7 12.7 13.9 9.8 11.1 11.7
11.7 13.2 12.6 13.5
11.0 10.6 22.2
11.2 6.0 17.0 12.1 3.5 12.4
9.8 13.7 11.0 11.3 8.5 11.5 11.5
11.3 13.1 14.2 19.2 14.5
S 1.9 3.0 2.9 0.7 2.4 2.4 1.9 1.8 3.4 2.5 2.4 3.2 2.9 0.8 2.1 2.1 2.9 1.5
0.7 1.0 1.5 0.7
0.6 0.5 0.8
4.4 1.2 4.8 1.6 1.8 4.3
4.0 3.8 3.3 3.2 3.4 3.7 3.5
2.9 2.8 3.2 3.0 4.3
C 69.4 72.0 70.2 76.0 78.8 71.1 75.2 74.9 70.3 72.2 70.0 72.7 68.8 76.6 72.8 74.3 69.8 77.1
80.9 78.5 80.2 76.4
82.6 81.5 67.6
70.1 80.6 67.0 75.7 74.4 68.9
66.3 67.3 63.7 66.7 68.0 63.7 69.6
62.4 67.2 67.5 59.4 66.9
FC dmmf 60.2 60.9 58.0 80.9 81.8 60.5 75.4 74.6 58.4 72.6 63.3 68.1 60.2 79.7 70.4 64.4 58.4 81.6
95.8 93.4 84.7 95.4 95.4 92.3 95.3 90.2
57.8 73.6 59.6 80.3 61.7 61.6
54.4 55.6 55.1 55.8 54.6 53.5 57.3
55.9 59.1 56.3 56.4 54.5
Tons (1000)
Data
12,209 12,457 10,607
102 47 16
5,079 423 1,154 423 85 256 423
12,764 12,460 12,510 12,564 13,077
36 255 30 25 658
12,758 12,104 12,499
S33
22.6
14.6 12.2
9.3 13.3 10.5 9.7 7.7
10.7 12.4 13.0
12,899 6.6 12134 10.31 10,880 16.8 7,311 39.0 8,764 31.8 12,850 9.5 11,955 8.9 12,344 13.3 11,972 12.0
9.2 24.5
14.5 11.7 16.1 13.5 16.2
12,398 12,283 12,304 12,697 12,220 12,993 9,834
12.7 11.5 19.1 12.3 10.2 12.3 12.7 13.9 11.6 8.1 11.3 10.4
Ash
10,922 11,904 10,231 11,221 12,200 11,531 11,534 11,559 11,241 12,569 11,525 11,342
423 423 423 423 423
10 251 14
2 2 50 14 5
12
17 11 1 28
24 12 8 12 24 6 12 24 25 4 59 32
n 1 28 54
423 423 423
423 ICR ICR 423 423
423 ICR ICR ICR 423 423
423 423 423 423 423 580 423 423 423 423 423 423
Btu/lb
423 423 423
2 569 1,383 6 426 3,291 450 283 38,047
1,660 194 614 116 509 5 222 4,753 46 560 2 10 1,090 878 2,107 60 71,646 12 5,328 210
1,422 717 8 4,491 490 1,090 663 717 959 552 804 1,130
S 0.8
1.8 1.7
1.5 1.9 1.6 1.7 1.9
1.1 3.3 2.1
1.4 0.6 0.6 0.6 0.5 1.9 1.4 1.9 1.6
3.9 0.6
3.4 3.4 3.3 3.7 3.4
3.5 2.3 3.5 3.5 4.4 4.7 4.6 4.6 2.7 2.3 3.3 3.0
Btu/lb mmmf b b b b b b b b b b b b
rank
14,557 b 14,413 b b 14,052 b
14,462 b 14,081 b 14,615 b b 14,240 b 14,610 b 14,159 b 14,090 b 14,321 b
13,268 b 14,488 b 13,804 b
13,927 13670 13,313 12,618 13,305
an an b an an an an an
b b b b b 14,554 b
14,178 15,033 14,996 14,936
12,745 13,666 12,965 13,034 13,833 13,432 13,502 13,743 12,920 13,834 13,220 12,842
lbs CO2 per million Btu notes
206.3 204.6 202.6 d, e 211.6
210.5 203.2 207.4 206.6 d 202.4 206.5 204.0 205.0 202.7
205.7 200.4 206.0 202.4 210.1 205.0 d, f 201.3 230.1 234.2 d 229.5 d 217.3 d 228.7 b, d 234.5 222.3 231.8 219.3 203.9 204.1 203.3 203.1
204.5 204.6 201.0 202.2 200.0 200.3 a 201.2 200.6 203.5 203.1 201.5 202.5
33 1,806 194 499 19,070 8 6,902 489 5 121
134 521
23 284 39 148 654 7 136 83 3 28
47 14
51 149 29 1
1 13 3 27 140 39 127 7
48
486
3,062 2 61 1 122 1,391 23 1,459 3 47,292 1,978 1,981 308 6
27
393
29 22 8
106 2,474 14 879
13
294
31 3
84 57
693 608
333 64
Tons (1000)
Delivered coal 2005 (by origin)
n
Produced coal 1999 (by origin)
12,065 11,453 8,771 11,854 13,034 7,690 11,466 11,989 10,332 10,734
10,614 6,187
6,404 6,320 6,700 8,318 5,999 6,141 7,669 6,655 6,797 12,313 12,005 11,838 11,976 12,940
9,833
12,121
11,512 13,044 11,431 10,856
11,280 11,439
12,677
11,247 11,992
Btu/lb
In-ground coal
12.3 16.3 33.3 14.6 7.8 39.7 18.4 13.0 17.8 21.5
20.8 44.1
40.5 42.8 32.8 27.5 47.5 41.8 30.5 39.0 35.8 12.0 12.6 15.9 12.6 8.2
28.5
16.3
10.0 7.4 13.0 23.0
14.7 12.5
10.3
11.3 10.5
Ash
Table SA1b. Carbon dioxide emission factors for U.S. coal by origin state and county, 1999, U.S. customary units.
S 2.4 1.7 1.7 2.8 2.0 0.8 2.2 1.8 2.5 1.0
2.8 1.6
0.4 0.5 0.4 0.7 0.5 0.4 0.5 0.4 0.4 2.0 2.0 2.9 2.1 1.5
1.5
4.1
3.2 2.7 2.0 2.7
4.0 3.7
4.0
3.7 2.3
Btu/lb mmmf 13,971 13,929 13,688 14,170 14,303 13,481 14,417 14,002 12,862 14,000
13,757 11,836
13,854 14,431 13,920 14,243
11,766 10,392 11,881 12,345 11,237 11,408 11,560 11,128
14,278
14,873
12,980 14,258 13,358
13,544 13,330
14,394
12,896 13,599
lbs CO2 per million Btu 201.7 206.6 203.4 204.1 202.7 209.9 205.9 204.5 202.6 211.4
203.2 206.6
232.9 233.9 229.3 217.2 234.2 234.3 222.2 231.9 219.2 203.8 203.7 202.5 202.8 212.2
211.1
205.5
202.4 202.1 204.1 208.3
201.0 202.8
200.4
204.5 204.6
notes
STATE County Somerset Tioga Venango Washington Westmoreland unknown TENNESSEE Anderson Campbell Claiborne Cumberland Fentress Morgan Scott Sequatche TEXAS Atascosa Freestone Harrison Hopkins Leon Milam Panola Robertson Rusk Titus Webb UTAH Carbon Emery Sevier unknown VIRGINIA Buchanan Dickenson Lee Russell Scott Tazewell Wise Wythe unknown WASHINGTON King Lewis Thurston WEST VIRGINIA N. Barbour Braxton
12 10 10
1 2 8 2
1 2 7 2
6
4 5
9 52 7
55 41 24 25 9 25 68 4
8
1
26 2
CQ CQ CQ
CQ CQ CQ CQ
CQ CQ CQ CQ
CQ
CQ WH
CQ CQ CQ
CQ CQ CQ CQ CQ CQ CQ CQ
KEY
CQ
CQ CQ
Data
70 4 4 33 12
n
CQ CQ CQ CQ CQ
Btullb
13,306 13,300
8,319
11,777
14,010 13,406 13,274 13,424 13,221 14,029 13,802 11,212
12,526 12,146 10,784
7,636 12,430
8,162
7,497 8,105 8,099 7,672
12,623 13,295 12,969 13,328
13,399 12,995 14,029
12,917 12,768 12,939 12,568 12,804
Ash 9.5 6.6
14.5
10.8
7.4 9.8 9.9 10.0 9.9 6.8 7.2 25.2
8.7 8.7 13.9
11.8 12.8
12.1
22.4 7.5 8.6 15.9
9.6 8.1 9.5 8.3
7.7 8.0 4.2
13.0 14.5 8.9 12.6 14.3
S 2.5 1.7
0.4
0.6
1.0 1.3 1.7 0.8 1.4 0.9 1.2 0.9
0.7 0.8 0.9
0.7 1.2
1.1
2.2 0.7 1.0 1.0
2.8 1.1 2.5 0.7
1.8 1.9 1.0
2.1 0.9 4.2 2.7 2.7
C 73.7 74.1
48.1
79.3 75.1 74.0 75.9 74.0 79.8 77.3 64.9
69.9 67.8 61.4
44.6 66.7
47.0
42.9 47.2 47.5 45.0
69.8 74.5 72.0 74.8
74.6 72.8 78.0
73.8 72.9 71.0 69.6 71.5
FC dmmf 60.4 59.2
51.3
49.6
70.8 63.8 60.1 65.0 60.3 72.3 63.9 75.7
51.8 52.7 55.8
49.9
47.7
47.7 49.1 50.8 48.6
60.7 62.1 60.9 66.1
62.0 60.5 61.2
79.9 76.8 56.1 58.2 67.9
145 109 128 98 20 742
423 423 423
423 423 423 423
32,293 10,656 4,168 1,000 394 2,070 423 14,005 423
4,101 4 4,097 423 423 38,787 1,034 423 423
12 12 12 12 12 11
ICR 423 423 423 423 423
35 2
12 5
128 97 37
11 12 12
3 12 12
10 1 61 12
423 423 423
423 423 423
423 ICR 423 423
3,038 91 878 1,227 256 3 8 168 407 53,073 3,399 4,971 3,744 2,126 9,216 6,226 7,768 1,615 6,237 7,536 235 26,373 8,298 11,504 6,571
2 193 57
Tons (1000) 93 423 9,661 423 474 423
Data 181
n
4,837 423
Btu/lb 7,803 7,782 12,542 13,178 12,505
S34
15.1 14.6 10.9 8.9 12.9
15.1
7,807
8.9 6.9 8.9 9.5 14.1
13,051 13,483 13,021 12,642 12,459
10.7 9.9
9.4 9.1 10.1 8.3
11,707 11,756 11,862 11,373
12,670 12,833
18.2 16.5 13.4 18.1 13.4 19.0
7,020 6,892 6,501 6,771 6,501 5,834
9.1 11.5 14.5 16.8 26.8 15.4 14.3
9.6 9.6 9.3 7.7 11.1
12,558 12,341 12,277 12,856 12,563 12,799 12,326 12,400 6,542 5,275 6,407 6,583
9.6 7.1 11.9
13.9
Ash
13,418 13,160 12,514
12,462
S 0.9 0.9 2.7 1.3 1.4
0.9
0.7 1.1
1.0 0.8 1.2 0.9 0.7
0.4 0.5 0.4 0.4
1.1 1.1 1.1 0.9 1.1 0.5
1.6 1.4 0.9 1.0 1.8 0.7 1.2
1.2 1.3 1.1 1.4 0.9
1.3 1.5 2.0
2.0
rank
Btu/lb mmmf l l l l s s l s l l b
b b b b
14,625 b 14,583 b
b 9,322 s 9,240 s
14,356 b 14,414 b
14,583 14,443 14,118 14,724
13,058 b 13,326 b 12,499 b
8,732 8,385 7,594 8,456 7,594 7,338
7,405 7,682 7,779
b b b b b 14,242 b 14,112 b 14,735 b
13,812 13,680 14,061 14,298
15,016 b 14,292 b 14,432 b
14,730 b
lbs CO2 per million Btu notes
212.1 206.3 c, f 212.2 a 211.3 203.5 203.8 204.3
208.6 205.1
206.2 207.5 205.3 204.9 207.1
204.6 204.2 205.8 203.5 205.1 a 202.6 d, e 204.8 204.2 205.5 213.6 209.3 212.9 214.4 214.8 d,f 213.0 a 210.6 216.2 a 214.1 a 216.2 a 214.1 196.5 d, f 205.8 204.7 204.8 209.0
203.0 203.6 205.0
209.2
43,618 1,412 139
5,285
21,039 8,580 5,476 6,966 17 18,180 2,964 909 1,603 1,113 67 196 11,219 10 98 5,285
5,698
113 8
12
149 76 126 23 3 12 611 1 9
244 92 101 6
12
24 12 12
12 24 12
45,796 3,329 11,348 4,248
6,135 12,897 2,141
12
4 31 59 9
60 6 21 142 50 79
132
715 3 32 3,662 143 8,683 1,619 53 463 924 46
Tons (1000)
Delivered coal 2005 (by origin)
n
Produced coal 1999 (by origin)
12,383 12,657 12,420
7,851
11,318 11,609 11,012 11,197 12,053 12,596 12,493 12,856 12,549 12,406 12,897 12,698 12,623 12,900 12,775 7,851
6,060
6,066 6,870 6,886
6,531 5,267 6,894 6,644
12,491
11,601 7,381 11,016 12,935 9,722 12,162 12,748 12,463 12,600 12,888 12,500
Btu/lb
In-ground coal
11.2 10.5 11.5
15.3
12.7 13.1 16.2 9.4 8.0 11.2 11.2 11.3 9.2 13.9 9.7 12.2 11.2 9.5 10.0 15.3
19.2
19.6 13.7 15.4
16.3 22.7 15.1 13.8
9.6
18.1 37.3 14.7 7.8 21.9 12.4 8.9 10.2 9.1 8.6 10.4
Ash
Table SA1b. Carbon dioxide emission factors for U.S. coal by origin state and county, 1999, U.S. customary units.
S 2.1 1.2 1.2
0.8
0.6 0.7 0.7 0.4 0.6 1.0 0.9 1.3 0.9 0.8 0.9 0.5 1.0 0.6 0.9 0.8
0.5
1.4 1.4 1.1
1.2 2.4 1.0 0.9
1.7
1.8 0.5 2.9 1.6 1.2 1.7 1.4 1.7 1.4 1.3 0.7
Btu/lb mmmf 14,308 14,228
9,411
14,238 14,699 13,954 14,633 14,445 14,650 14,391 14,394 14,358
13,498 13,346 12,465 13,208
7,645
7,717 8,059 8,255
7,063 8,227 7,806
13,980
14,066 14,012 14,246 14,111
14,497 12,401 13,186 14,179 12,733 14,036
lbs CO2 per million Btu 203.9 203.8 204.4
212.1 a
206.0 204.5 204.6 209.0 206.5 a 205.7 207.4 205.2 204.9 207.0 205.5 208.7 205.2 212.3 205.1 a 212.1
214.2
210.0 214.0 a 214.2 a
212.9 208.2 212.7 214.8
204.0
209.3 209.2 201.6 203.5 205.3 204.1 a 204.2 204.0 205.7 203.5 205.5 a
notes
STATE County Brooke Cabell Grant Harrison Lewis Marion Marshall Mineral Monongalia Preston Tyler Tucker Upshur Webster Wood unknown WEST VIRGINIA S. Boone Clay Fayette Greenbrier Kanawha Lincoln Logan McDowell Mercer Mingo Nicholas Raleigh Randolph Wayne Wyoming unknown WYOMING Campbell Carbon Converse Johnson Lincoln Sheridan Sweetwater unknown IMPORT Columbia Indonesia Russia Venezuela UNKNOWN unknown
1 6 13 3
1 8 1
6 7 16
37
33 15 55
61 31 8 35 35 34 4 2 32
97 89 5 31 9 51 47
KEY CQ CQ CQ
KEY CQ CQ
CQ CQ CQ
CQ
CQ CQ CQ
CQ CQ CQ CQ CQ CQ CQ CQ CQ
CQ CQ CQ CQ CQ CQ CQ
Data
1
n
CQ
Btullb
7,705 9,670 9,063 9,645 10,828 8,026 9,871
13,254 14,290 13,701 13,519 13,682 13,856 14,102 12,092 14,077
13,834 13,855 13,001
12,873
12,750 12,974 13,773
12,476 13,660
13,462 12,846 13,677
12,700
Ash 8.1 12.7 7.2 4.1 10.1 8.7 7.3
9.6 6.4 10.1 7.3 7.0 8.3 5.0 11.0 7.5
7.2 6.9 10.4
10.9
13.0 10.4 6.0
13.8 10.4
7.6 10.7 6.6
6.6
S 0.7 1.1 0.5 0.3 0.5 0.9 1.1
1.0 0.9 0.7 0.9 0.9 1.1 0.8 1.5 0.9
0.9 1.1 1.0
1.3
2.5 2.3 1.0
2.2 1.5
2.9 2.8 1.6
1.5
C 45.0 55.6 53.0 56.4 61.6 47.3 57.1
74.3 81.9 79.0 76.0 77.0 78.8 79.6 67.8 80.6
77.8 78.3 73.0
72.0
72.4 72.1 77.6
69.4 76.5
74.4 71.1 76.5
71.3
FC dmmf 52.8 56.8 51.3 58.7 56.3 51.8 55.9
62.8 79.1 81.9 63.0 65.5 74.2 68.5 57.5 78.6
67.3 74.1 60.9
62.1
75.0 60.2 66.6
84.0 61.3 70.9
84.0 57.7 57.1 60.0
60.0
Data
Tons (1000)
44 181 6 343 76
423 423 580 423 423
9,343
24
S35
10.1
4.9
5.3 5.1 6.3 6.0
8,665 8,608 10,755 8,622 9,977
2562 125 225
337,119 294,791 423 2,727 423 25,642 423
11.4 6.9
11.9 11.0 12.2 11.7 9.7 13.2 14.7 12.1 6.0 5.6 11.6 11.6 19.7
12,360 12,408 12,347 12,302 13,069 12,126 11,383 12,247 13,756 8,661 12,266 12,444 11,458 11,933 13,549
13.5 10.2 12.0
9.8 11.7 14.8 9.0 9.4
13.8 11.1
10.5
Ash
12,303 12,881 12,503
12,861 12,163 12,334 12,895 13,068
12,336 12,583
12,307
Btu/lb
12
231 45
6,682 423 9,037 423
4,320 423 76 9,563 423
864 136 311 3 580 20 217 9 1 687 160 27
423 423 423 423 423 423 423 423 423 423 423 423
119,192 30,281 6,836 2,019 328 14,985 357 9,586 4,816 10 19,498 4,123 10,634
4 95 156
39 108
48
n
423 423
258 580 2,380 423 5,452 423
516 7,115 1 1,137 11,399 49 6,446 1,355
1,645 423
S 0.5
0.7
0.3 0.3 0.6 0.3
0.8 0.7
0.8 0.8 0.9 1.1 0.9 0.8 0.8 0.8 0.7 0.3 0.7 1.0 1.0
1.7 1.9 0.9
2.8 3.7 1.7 2.2 1.4
1.7 3.3
3.7
rank
Btu/lb mmmf b b b b b b b b b b b b
10,543 s s 10,489 s
9,114 s 11,555 b 9,210 s
13,636 b 14,659 b
14,104 14,244 14,115 14,634 14,159 13,551 14,119 14,729 9,219 14,049 14,256 14,610
14,466 b 14,536 b 14,398 b
14,561 b 14,400 b b 14,480 b 14,040 b 14,733 b 14,359 b 14,593 b
14,000 b
lbs CO2 per million Btu a b
208.4 215.8 d, e 212.5
214.1 214.3 211.1 214.3
205.8 210.0
notes d, e
b
206.4 205.2 205.2 a 205.9 207.3 206.0 205.7 a 205.4 210.0 211.3 206.1 206.0 208.4
208.5 204.0 206.4
213.7 202.0 202.7 204.2 201.5 213.8 203.8 205.2
204.2
149 197 4 523 62 54
22 6 18 174
9,209 568 23,929 17,555 2,134 74 4,166 10,266 10,266
108
388 24 2 138
50 7
9,347 8,735 11,639 11,649 9,923 11,824 12,472 12,616 12,616
12,182 12,126 12,479 12,250 12,158 12,769 11,939 8,680 8,644 10,398 8,849 8,928 10,035
9,116 494 6,501 340 912 45 8 1 4,589 241 508 35 1,286 94 381,636 351,892 3988 25 4 17,131 288 44 1 2,766 12
12,204 12,173 13,024
509
12,570 12,401 11,558 12,210 12,214 12,240 12,354 12,788
12,235 12,371 11,975 12,626 12,979 12,530
12,153 11,949 9,736 12,306
297 20
6,250 232
9,170
845 146 2,393 120 86 8 7,514 186 60,805 21,157 1003 171 19 904 77
3,024 12,846 9 7,606 755 1,091
309 60 222 5,307
Tons (1000)
Delivered coal 2005 (by origin)
n
Produced coal 1999 (by origin)
Btu/lb
In-ground coal
10.1 5.2 6.1 6.4 2.3 9.0 6.6 10.4 10.4
12.2 13.7 11.6 10.2 10.9 10.1 12.7 5.2 5.0 6.3 5.4 5.0 4.8
12.4 9.0
12.4
11.4 12.1 14.2 11.5 12.1 11.7 12.4 9.9
12.0 10.7 14.9 10.5 9.4 11.2
11.5 12.6 14.7 12.3
Ash
Table SA1b. Carbon dioxide emission factors for U.S. coal by origin state and county, 1999, U.S. customary units.
S 0.5 0.3 0.6 0.6 0.2 0.5 0.6 2.1 2.1
0.7 0.9 1.3 0.5 0.8 0.7 1.2 0.3 0.3 0.5 0.3 0.3 0.9
0.7 1.8
0.8
1.7 1.1 1.0 0.9 0.8 0.8 0.8 1.1
2.3 2.7 2.0 2.2 1.6 0.7
2.2 0.9 1.4 3.6
Btu/lb mmmf 14,285
12,534 10,197 13,108 13,457
10,491 9,254
9,141 11,163 9,394 9,438 10,593
14,046 14,258 14,318 13,781 13,796 14,351 13,867
14,073 14,479
14,110
14,038 14,296 14,350
14,396 14,294 13,688 13,969
14,053 14,068 14,350 14,295 14,495 14,273
13,931 13,853 11,629 14,301
lbs CO2 per million Btu 212.5 213.7 207.4 207.2 211.7 206.7 206.2 203.6 203.6
a
a a a a
a
206.1 206.0 208.3 207.0 205.8 210.0 205.0 a 214.2 214.3 211.1 214.4 214.2 208.2
205.5 209.3
206.0
204.1 206.3 205.4 a 205.4 a 205.7 205.2 205.2 a 205.9
204.4 202.9 a 213.5 b 203.8 205.1 205.4 a
205.2 205.3 a 213.7 b 201.8
notes
Delivered coal 2005 (by destination)
Explanation of Table SA2 headings
S
Ash
MJ/kg or Btu/lb
Mg or tons
n
EIA
Data FERC
Plant
STATE
S36
% Sulfur, annual average, moist basis
% Ash, annual average, moist basis
Heating Value, annual average moist-basis gross British thermal units per pound coal (Btu/lb). Multiplied by 0.002326 to convert to megajoules per kilogram (MJ/kg).
Tons of coal delivered to the power plant; tons = 2000 pounds, which were multiplied by 0.9072 to convert to metric tons (megagrams, Mg). Where noted, includes estimated tonnage delivered to transfer stations, which was assigned to presumably affiliated plants according to year 2005 coal consumption reported in EIA 906/920 data at: . The actual distribution of coal from transfer stations, and quality of the likely blended coal product, is not publically reported.
Number of data records, note, records for coal delivered to transfer stations, and subsequently shipped to power plants are not included in this total
Source of data FERC-423, year 2005, Monthly cost and quality of fuels for electric power plants, data at: EIA-423, year 2005, Monthly non-utility fuel reciepts and fuel quality, data at:
Name of power plant
State where the power plant is locacted
Carbon dioxide emission factors for U.S. coal by destination state and power Table SA2a shows SI units. Table SA2b shows US customary units.
eGRID consumed coal 2005 (by destination)
Plant primary fuel Bituminous coal Subbituminous coal Lignite coal
PLPRMFL BIT SUB LIG
S37
Plant annual CO2 input emission rate annual average, pounds CO2 per million gross Btu from fuel (excludes CO2 emiissions from biomass, but includes biomass heat input). Multiplied by 0.42992 to convert to kilograms CO2 per gigajoule (kgCO2/GJ)
Plant nameplate capacity (MW)
EIA-906/920 Data files, Combined (utility, non-utility, and combined heat & power plant) database,
Plant emissions source(s) of data (for CO2, as reported in eGRID) EPA emissions tracking system/continous emissions monitoring system (ETS/CEM) EIA-767 Data files, Annual steam-electric plant operation and design data,
DOE/EIA ORIS plant or facility code
These data are reported in eGRID2007 version 1.1 at:
includes pro-rated coal tonnage and average quality of coal delivered to a transfer station; results for these plants are less reliable year 2006 EIA-423 data were used (no year 2005 data reported) includes synthetic coal shipments
Carbon dioxide emission factor, pounds CO2 per million gross Btu was multipled by 0.42992 to convert to kilograms CO2 per gigajoule (kg CO2/GJ). This annual average was calculated from shipment values by county origin (table SA1), aggregated by desitination, and weighted by energy (shipment tons times shipment heating value).
PLCO2RA
NAMEPCAP
906
767
SOURCEM CEM
ORISPL
b c
notes a
kg CO2/GJ or lbs CO2 per million Btu
PLCLPR
BLQ NG PC RFO SC SLW WC WDS
S38
Plant coal generation percent (resource mix) percent of plant annual net generation from coal
Black liquor Natural gas Petroleum coke Petroleum, heavy fuel oil, residual oil Synthetic coal Sludge waste Waste coal Wood, waste solids
STATE Plant ALABAMA Charles R Lowman Barry Gadsden Gorgas Greene County E C Gaston James H Miller Jr Colbert (includes GRT coal) Widows Creek (includes GRT coal) Mobile Energy Services LLC ALASKA ARIZONA Apache Station Cholla Navajo Coronado Irvington (H Wilson Sundt Generating Station) Springerville Abitibi Consolidated Snowflake ARKANSAS White Bluff Independence Flint Creek CALIFORNIA ACE Cogeneration Facility Stockton Cogen Argus Cogen Plant Port of Stockton District Energy Facility Mt Poso Cogeneration COLORADO Martin Drake Ray D Nixon Rawhide Arapahoe Cameo Cherokee Comanche Valmont Hayden Pawnee 37 20 12 56 17 12 12 69 18 24 12 39 23 11 20 26 23 12 16 13 32 14 29 35 14
FERC FERC FERC FERC FERC FERC EIA FERC FERC FERC EIA EIA EIA EIA EIA FERC FERC FERC FERC FERC FERC FERC FERC FERC FERC
Data
72 15 12 65 29 13 53 13 109 26
n
FERC FERC FERC FERC FERC FERC FERC FERC FERC EIA 23.49 22.78 22.77 25.27 21.63 25.44 21.65 23.12 20.31 19.98 20.75 20.09 27.98 28.31 27.39 27.98 27.67 28.13 22.94 24.91 21.10 20.60 20.51 26.02 26.05 19.96 25.72 24.24 19.56
18,537,371 1,351,184 3,340,310 7,481,497 2,890,521 341,871 2,803,883 328,105 11,128,443 4,742,690 4,498,896 1,886,857 1,478,463 293,432 138,793 749,994 147,791 148,452 16,792,859 957,813 895,062 1,085,568 498,549 248,986 2,141,469 2,211,331 574,363 1,661,928 1,678,786
Mg
25.22 27.65 26.76 28.33 28.12 27.05 31.39 20.27 24.34 26.72 27.20
MJ/kg
31,655,676 1,803,917 3,689,945 228,932 2,941,914 1,261,044 4,068,695 10,130,829 3,286,889 4,141,551 101,960
Ash S39
11.7 8.1 14.5 9.6 9.3 11.2 17.9 13.2 4.8 5.1 4.5 4.5 10.6 10.7 11.0 11.1 8.1 10.6 7.7 9.3 5.1 5.3 5.5 11.1 10.6 4.5 7.7 11.4 4.7
8.6 8.5 5.5 13.0 13.0 14.3 13.8 4.9 7.1 11.4 7.4
S 0.6 0.5 0.5 0.5 0.4 0.5 0.9 0.4 0.3 0.3 0.2 0.2 0.8 0.8 0.6 0.9 0.6 0.9 0.4 0.5 0.2 0.2 0.3 0.6 0.5 0.3 0.4 0.5 0.3
1.0 1.1 0.5 1.8 1.3 1.5 1.7 0.3 0.7 2.0 0.9
kg CO2/GJ 89.52 90.85 88.38 90.03 90.21 89.31 88.15 88.35 92.15 92.10 92.18 92.17 87.99 87.93 88.41 87.94 c 87.99 87.93 90.90 89.96 91.87 92.20 92.15 88.75 89.52 92.16 90.02 89.61 92.13
89.40 88.26 89.28 87.70 88.33 88.02 87.58 c 92.16 89.81 a 87.95 a 88.31
ORISPL 492 8219 6761 465 468 469 470 477 525 6248
10002 10640 10684 54238 54626
6009 6641 6138
160 113 4941 6177 126 8223 50805
56 3 7 8 10 26 6002 47 50 50407
CEM CEM CEM CEM CEM, 767 CEM CEM CEM, 906 CEM CEM
767 767 767 767 767
CEM CEM CEM
CEM CEM CEM CEM CEM, 906 CEM 767
CEM CEM CEM CEM CEM CEM, 906 CEM CEM, 906 CEM 767
SOURCEM
eGRID consumed fuel 2005 (by destination)
257 279 651 160 66 807 779 237 465 552
108 60 55 54 62
1700 1700 558
661 1129 2409 822 559 1305 71
538 2671 138 1417 1288 2034 2822 1826 1969 79
NAMEPCAP
Delivered coal 2005 (by destination)
88.17 88.11 87.82 88.24 88.25 88.04 88.09 88.23 88.24 88.03
90.65 89.02 88.57 88.64 90.03
88.22 88.22 88.24
86.78 88.22 88.24 88.24 76.31 88.24 90.40
88.24 82.35 88.24 88.24 87.03 88.23 88.24 88.22 88.24 38.19
PLCO2RA
Table SA2a. Carbon dioxide emission factors for U.S. coal by destination state and power plant, 2005, Si units.
PLPRMFL
96 100 100 100 68 100 95 100 100 100 75 60 100 100 68 99 100 99 100 100 100 100 100 100 100
SUB SUB SUB BIT BIT BIT BIT BIT BIT SUB SUB SUB BIT BIT SUB BIT BIT SUB
100 80 100 100 97 100 100 100 100 41
SUB SUB BIT SUB SUB SUB SUB
BIT BIT SC BIT SC SC SUB BIT BIT WDS
PLCLPR
notes
STATE Plant Nucla Craig CONNETICUT Bridgeport Station AES Thames DELEWARE Edge Moor Indian River Operations NRG Energy Center Dover FLORIDA Crystal River (McDuffie and IMT coal) Deerhaven Generating Station Crist Scholz Lansing Smith St Johns River Power Park Northside Generating Station C D McIntosh Jr Stanton Energy Center Big Bend (includes Davant coal) Polk (Davant coal) Seminole Jefferson Smurfit Fernandina Beach Central Power & Lime Cedar Bay Generating LP Indiantown Cogen Facility GEORGIA Atkinson Bowen Georgia Pacific Cedar Springs Hammond Harllee Branch Mitchell Yates Wansley Scherer Kraft McIntosh Savannah River Mill International Paper Savanna Mill SP Newsprint 10 11 36 101 8 240 34 69 11 41 24 23 44 71 4 37 12 10 110 17 34 238 72 88 16 100 184 97 20 15 8 24 62
EIA EIA EIA EIA EIA FERC FERC FERC FERC FERC FERC FERC FERC FERC FERC FERC FERC EIA EIA EIA EIA FERC FERC FERC FERC FERC FERC FERC FERC FERC FERC EIA EIA EIA
Data
12 80
n
FERC FERC
Mg 1,701,753 3,364,342 227,435 2,507,047 4,308,293 12,353,705 772,844 392,908 37,474 285,335 119,541
376,760 4,462,245 1,746,535 1,249,023 497,512 2,062,848 494,136 1,531,136 37,576 22,953,144 5,537,767 550,050 2,071,863 167,832 948,024 2,455,183 310,444 630,504 1,840,890 3,313,603 395,203 2,489,247 226,708 294,288 890,625 830,913 35,236,017 1,146,701 7,853,812
MJ/kg 29.53 28.54 29.05 28.86 28.72 20.30 28.07 27.51 24.74 29.54 29.74
24.84 23.82 23.58 21.81 28.04 28.43 29.48 28.04 30.47 28.36 28.92 29.69 27.21 27.78 27.51 27.35 28.58 28.79 29.37 27.74 27.70 28.69 30.17 30.10 28.31 28.66 25.74 29.50 28.41
Ash S40
9.8 11.3 10.5 11.2 10.8 5.2 6.1 7.0 10.5 9.3 9.6
19.4 7.3 4.4 1.0 13.0 9.6 10.2 9.4 8.7 8.8 9.2 9.7 6.3 12.4 6.7 9.4 10.1 8.3 9.3 8.4 8.5 8.0 9.4 8.2 12.1 10.9 8.8 10.4 11.4
S 1.1 1.2 1.3 1.3 1.0 0.3 0.6 0.6 1.4 0.7 1.2
0.9 0.4 0.4 0.1 1.3 0.7 0.7 0.7 1.4 1.5 0.8 0.7 0.7 1.3 0.9 0.9 3.8 1.2 1.2 2.7 2.8 3.0 0.7 0.7 1.1 1.1 0.8 1.0 1.1
kg CO2/GJ 87.93 87.97 87.89 88.10 88.27 92.14 88.92 88.98 88.81 88.32 88.04
92.55 90.96 90.74 91.81 88.64 89.19 89.38 89.15 88.11 88.15 88.43 88.33 88.99 87.79 88.61 88.64 86.82 88.37 88.06 87.74 87.69 86.92 88.29 88.32 88.25 88.18 89.23 88.00 88.04 a a c
a
ORISPL 703 54101 708 709 727 728 6052 6257 733 6124 10361 50398 54004
628 663 641 642 643 207 667 676 564 645 7242 136 10202 10333 10672 50976
593 594 10030
568 10675
527 6021
CEM, 906 767 CEM CEM CEM, 906 CEM CEM, 906 CEM CEM, 906 CEM 767, 906 767 767, 906
CEM CEM CEM CEM CEM, 906 CEM CEM, 906 CEM, 906 CEM CEM, 906 CEM, CEM 767 767 767 767
CEM, 906 CEM, 906 CEM, 767
CEM, 906 767
CEM CEM
SOURCEM
eGRID consumed fuel 2005 (by destination)
3540 101 953 1746 289 1487 1957 3564 352 988 140 154 82
3333 471 1201 98 1002 1358 1407 994 929 1998 1030 1429 118 125 292 395
710 799 118
582 214
114 1339
NAMEPCAP
Delivered coal 2005 (by destination)
88.24 53.76 88.24 88.24 88.21 88.24 88.23 88.24 88.23 85.96 93.46 35.90 52.86
88.24 84.36 88.20 88.23 74.62 88.24 84.81 81.52 88.24 88.21 104.63 88.24 31.42 88.64 88.39 88.13
81.95 88.23 83.76
87.94 88.64
88.30 88.24
PLCO2RA
Table SA2a. Carbon dioxide emission factors for U.S. coal by destination state and power plant, 2005, Si units.
63 99 81 71 84 100 100 53 76 15 70 98 97 89 74 32 99 99 99
BIT BIT BIT BIT BIT BIT BIT BIT BIT PC BIT BIT BIT BIT BIT BLQ BIT BIT BIT
100 27 100 100 100 96 100 100 94 95 7 33 41
98 100
SUB BIT
BIT BIT BIT BIT BIT BIT BIT SUB BIT BIT PC BLQ SLW
100 100
PLPRMFL BIT SUB
PLCLPR
notes
STATE Plant International Paper Augusta Mill HAWAII AES Hawaii IOWA Ames Electric Services Power Plant Streeter Station Fair Station 6th St Praire Creek 1-4 Sutherland Burlington Ottumwa Dubuque Earl F Wisdom Lansing Kapp Riverside Council Bluffs George Neal North George Neal South Louisa Muscatine Plant #1 Archer Daniels Midland Cedar Rapids ILLINOIS Edwards Duck Creek Marion Dallman Lakeside Joliet 29 Coffeen Hutsonville Meredosia Crawford Joliet 9 Joppa Steam Kincaid Generation LLC Powerton Waukegan Will County Fisk Street 12 11 18 10 8 20 25 26 40 17 13 10 16 38 52 28 20 46 29 26 60 12 11 28 13 28 36 47 28 34 42 32 48 44
EIA FERC FERC FERC FERC FERC FERC FERC FERC FERC FERC FERC FERC FERC FERC FERC FERC EIA FERC FERC FERC FERC FERC EIA EIA EIA EIA EIA EIA EIA EIA EIA EIA EIA
Data
16
n
EIA
Mg 3,332,626 5,175,262 2,628,898 2,973,608 770,665
1,909,701 1,029,982 1,000,976 46,965,303 2,595,057 784,127 1,183,166 1,012,870 102,104 2,529,266 2,088,554 397,069 689,407 1,600,845 1,390,521
851,471 768,625 385,025 3,164,604 5,408,599
164,827 640,651 640,651 19,449,941 299,376 92,947 164,342 92,870 932,511 470,782 665,123 2,014,456 198,550
MJ/kg 20.61 20.21 20.08 20.28 20.27
19.95 19.41 21.94 21.02 20.42 24.74 22.07 24.54 24.51 20.14 23.90 23.62 21.39 20.27 19.94
19.91 19.56 20.29 20.12 19.89
29.75 25.53 25.53 20.13 20.44 26.68 25.40 24.26 19.78 20.75 19.48 19.59 23.85
Ash S41
5.2 4.7 4.7 5.0 5.0
4.8 6.3 6.6 5.7 6.3 7.9 17.2 8.9 8.9 4.8 8.3 7.1 5.6 5.0 4.7
5.1 5.0 5.2 4.8 4.9
9.8 4.8 4.8 5.2 4.4 7.2 10.0 6.3 5.4 5.0 4.8 5.0 6.7
S 0.3 0.2 0.3 0.3 0.3
0.3 0.6 1.3 0.7 0.7 3.4 2.7 3.3 3.2 0.3 0.9 1.2 0.8 0.3 0.3
0.3 0.4 0.4 0.3 0.3
1.0 0.6 0.6 0.4 0.2 1.6 2.8 0.3 0.3 0.3 0.3 0.3 0.4
kg CO2/GJ 92.16 92.16 92.15 92.14 92.15
92.13 92.00 89.91 c 91.28 91.89 87.52 87.47 87.62 87.63 92.15 88.37 89.43 91.17 92.15 92.16
91.85 92.11 92.11 92.16 92.12
88.27 89.69 89.69 91.89 92.18 88.67 87.49 91.43 92.10 92.01 92.12 92.13 90.16
ORISPL 856 6016 976 963 964 384 861 863 864 867 874 887 876 879 883 884 886
1122 1131 1218 1058 1073 1077 1104 6254 1046 1217 1047 1048 1081 1082 1091 7343 6664 1167 10864
10673
54358
CEM CEM CEM CEM CEM CEM CEM CEM, 906 CEM CEM, 906 CEM CEM CEM CEM CEM, 906 CEM CEM, 906
CEM CEM, 767 CEM, 767 CEM CEM, 767 CEM CEM, 906 CEM CEM, 906 CEM CEM, 906 CEM, 767 CEM, 767 CEM CEM CEM CEM CEM, 767 767
767
767
SOURCEM
780 441 422 388 80 1320 1005 153 564 805 360 1100 1319 1786 915 1269 663
98 52 63 85 245 157 302 726 85 143 341 237 141 1779 1046 640 738 294 256
203
85
eGRID consumed fuel 2005 (by destination) NAMEPCAP
Delivered coal 2005 (by destination)
88.45 88.25 90.59 88.24 88.24 88.24 88.24 88.23 87.55 88.23 88.24 88.22 88.24 88.24 88.23 88.24 88.20
88.24 87.41 88.37 84.04 88.45 88.23 87.67 88.24 88.23 86.07 88.24 88.23 87.73 88.23 88.18 88.20 88.24 88.49 90.32
91.27
18.92
PLCO2RA
Table SA2a. Carbon dioxide emission factors for U.S. coal by destination state and power plant, 2005, Si units.
25 97 94 100 100 78 98 99 99 100 100 96 100 100 96 100 100 100 100 100 100 100 100 94 100 98 100 100 100 97 100 100 100 100 100 100 99 99
SUB SUB BIT BIT SUB SUB SUB SUB SUB SUB BIT SUB SUB SUB SUB SUB SUB SUB SUB BIT SUB BIT BIT BIT BIT SUB BIT SUB SUB SUB SUB SUB SUB SUB SUB SUB SUB
PLPRMFL BLQ
PLCLPR
notes
STATE Plant Baldwin Energy Complex Havana Hennepin Power Station Vermilion Wood River Newton Archer Daniels Midland Decatur Archer Daniels Midland Peoria A E Staley Decatur Cogen (Tate & Lyle Decatur Plant Cogen) Corn Products Illinois University of Illinois Abbott Power Plt INDIANA Frank E Ratts Merom Clifty Creek Harding Street Logansport Eagle Valley AES Petersburg Tanners Creek Rockport Bailly Michigan City R M Schahfer Cayuga Edwardsport R Gallagher Wabash River Warrick Gibson Whitewater Valley F B Culley A B Brown State Line Energy KANSAS Riverton Quindaro Nearman Creek La Cygne Lawrence 13 12 24 64 84 43 15 58 101 161 33 27 99 56 18 68 32 97 42 40 25 18 10 15 12 95 14
EIA EIA FERC FERC FERC FERC FERC FERC FERC FERC FERC FERC FERC FERC FERC FERC FERC FERC FERC FERC FERC EIA FERC FERC FERC FERC FERC
Data
21 13 12 13 12 50 73 47 12
n
EIA EIA EIA EIA EIA EIA EIA EIA EIA
Mg 7,594,824 276,968 1,112,239 1,382,306 1,421,523 18,378,714 227,656 532,509 1,031,875 4,725,559 1,622,700
679,125 4,778,679 1,873,277 8,051,309 1,120,301 1,227,351 4,877,470 2,084,219 126,382 976,664 1,660,811
306,147 61,768 48,397,850 504,675 2,734,101 4,421,784 1,493,839
6,472,564 1,728,915 1,051,418 244,177 1,680,820 3,872,388 1,763,645 178,160 351,256
MJ/kg 26.09 26.82 26.12 25.84 21.83 19.93 20.53 20.30 18.59 20.38 20.55
25.30 26.36 27.55 21.68 27.95 22.28 24.31 25.95 26.00 27.60 25.27
27.65 25.56 24.85 26.38 25.86 24.11 25.39
20.47 20.51 20.47 24.19 20.50 20.48 23.54 27.81 24.55
Ash S42
8.8 8.4 10.5 10.2 4.1 5.3 4.8 5.2 5.3 6.0 5.4
8.6 8.5 9.4 6.4 6.7 5.8 6.6 7.1 7.7 9.2 8.8
6.3 8.3 7.7 7.3 9.9 6.1 8.5
4.5 4.8 4.5 7.6 5.1 5.2 8.1 8.6 8.8
S 1.9 2.0 3.5 3.0 0.3 0.4 0.3 0.4 0.4 0.6 0.3
1.2 3.0 1.1 0.4 2.9 0.7 1.7 1.4 1.8 2.2 1.6
3.1 3.6 1.7 1.5 3.4 1.0 1.5
0.2 0.2 0.2 1.7 0.2 0.3 2.6 2.6 3.2
kg CO2/GJ 88.06 87.44 87.77 87.78 91.83 91.99 92.15 92.10 92.10 91.67 92.13
87.74 87.75 88.48 91.22 87.86 91.11 89.48 88.27 87.94 87.70 87.73
87.88 87.48 88.89 88.34 87.37 89.97 87.75
92.18 91.82 92.18 87.77 92.17 92.16 88.53 c 87.75 87.63
ORISPL 1239 1295 6064 1241 1250
1043 6213 983 990 1032 991 994 988 6166 995 997 6085 1001 1004 1008 1010 6705 6113 1040 1012 6137 981
54556 54780
889 891 892 897 898 6017 10865 10866 10867
CEM, 906 CEM, 906 CEM CEM CEM
CEM CEM CEM CEM 767, 906 CEM, 906 CEM, 906 CEM CEM CEM, 906 CEM CEM, 906 CEM CEM CEM CEM, 906 CEM CEM CEM CEM CEM CEM
767, 906 767, 906
CEM CEM CEM CEM, 906 CEM CEM 767 767, 906 767
SOURCEM
eGRID consumed fuel 2005 (by destination)
311 388 355 1578 566
233 1080 1303 1185 61 396 1881 1100 2600 641 680 2201 1193 144 600 1173 755 3340 94 415 707 614
55 85
1892 718 306 197 650 1235 335 64 62
NAMEPCAP
Delivered coal 2005 (by destination)
87.43 87.63 88.24 88.24 88.21
88.24 88.24 88.24 87.16 88.60 88.19 88.24 88.24 88.24 88.20 88.24 88.11 88.07 88.24 88.24 88.82 88.18 88.24 88.24 88.22 87.59 88.24
79.02 60.33
88.24 87.77 88.23 87.99 88.18 88.24 89.43 63.35 88.64
PLCO2RA
Table SA2a. Carbon dioxide emission factors for U.S. coal by destination state and power plant, 2005, Si units.
100 98 100 99 99 100 99 19 100 74 20 100 100 100 97 100 100 100 100 100 100 99 98 100 100 99 96 100 100 100 100 98 99 99 97 100 100 100
BIT NG BIT BIT SUB BIT BIT BIT BIT BIT SUB BIT SUB BIT BIT BIT BIT BIT BIT BIT BIT BIT BIT SUB SUB SUB SUB SUB SUB
PLPRMFL SUB SUB SUB BIT SUB SUB BIT NG BIT
PLCLPR
notes
STATE Plant Tecumseh Jeffrey Energy Cnt Holcomb KENTUCKY Reid-Henderson II (Robert A Reid) East Bend Cooper Dale H L Spurlock E W Brown Ghent Green River Tyrone Cane Run Mill Creek Trimble County Elmer Smith Paradise (includes GRT coal) Shawnee (includes GRT coal) Big Sandy Kenneth C Coleman HMP&L Station Two Henderson R D Green D B Wilson LOUISIANA Dolet Hills Rodemacher R S Nelson Big Cajun 2 International Paper Louisiana Mill Gaylord Container Bogalusa MASSACHUSETTS Mount Tom Somerset Station Brayton Point Salem Harbor MARYLAND Brandon Shores C P Crane Herbert A Wagner Luke Mill 33 17 69 67 239 83 297 30 30 43 112 83 35 70 95 145 50 34 67 62 24 24 12 69 24 4 17 15 97 26 82 24 37
EIA FERC FERC FERC FERC FERC FERC FERC FERC FERC FERC FERC FERC FERC FERC FERC EIA EIA EIA EIA FERC FERC FERC EIA EIA EIA FERC EIA EIA EIA EIA EIA EIA
Data
14 12 29
n
FERC FERC FERC
Mg 777,362 8,011,420 1,449,634 36,243,972 350,481 40,180 787,522 544,393 2,805,062 1,331,089 5,101,840 287,939 173,430 1,607,997 4,186,581 1,688,563 1,024,918 5,960,166 3,849,855 2,667,640 1,214,438 527,891 1,043,732 1,050,255 10,908,056 1,990,392 563,878 1,831,818 6,475,252 34,624 12,090 4,567,345 407,218 237,741 2,953,222 969,164 10,653,921 3,057,905 681,519 958,890
MJ/kg 20.54 19.59 20.07 26.88 27.32 28.05 28.15 28.39 27.68 29.05 27.30 28.42 29.07 26.24 26.58 27.50 24.32 26.37 26.53 27.99 26.93 27.00 24.44 24.51 19.24 16.04 20.34 20.29 19.77 29.08 23.25 27.27 26.96 29.32 27.22 27.06 29.40 28.86 30.39 28.93
Ash S43
5.4 4.9 5.4 11.0 9.9 10.8 11.2 10.2 12.6 10.4 10.4 9.0 10.3 11.5 11.4 11.1 13.7 9.4 8.8 11.2 13.3 9.5 16.6 15.5 6.6 13.2 5.2 5.3 5.1 10.0 11.1 6.3 6.2 6.6 6.6 5.7 10.3 11.7 7.7 11.8
S 0.3 0.4 0.4 2.1 2.9 2.8 1.4 0.9 1.7 1.6 1.3 2.5 0.9 3.1 3.3 3.3 3.8 2.4 0.7 0.9 2.1 2.8 3.6 3.4 0.5 1.1 0.3 0.3 0.3 1.0 2.5 0.5 0.5 0.7 0.5 0.5 1.3 0.7 1.8 0.9
kg CO2/GJ 92.14 92.09 92.10 87.80 86.79 87.34 87.83 88.23 87.99 87.85 88.32 87.14 87.95 87.15 87.05 86.90 88.01 87.40 89.10 88.61 87.67 87.26 86.69 86.70 92.15 92.43 92.06 92.13 92.13 88.24 88.44 89.10 89.43 88.50 89.07 89.22 88.58 88.46 87.48 88.54 c
c
a a
c c
c
ORISPL 602 1552 1554 50282
1606 1613 1619 1626
51 6190 1393 6055 54090 54427
1383 6018 1384 1385 6041 1355 1356 1357 1361 1363 1364 6071 1374 1378 1379 1353 1381 1382 6639 6823
1252 6068 108
CEM CEM, 906 CEM, 906 767,
CEM CEM CEM, 906 CEM
CEM CEM CEM, 767 CEM 767 767
CEM, 906 CEM CEM CEM, 767 CEM CEM CEM CEM CEM CEM, 906 CEM CEM CEM CEM CEM CEM CEM CEM CEM CEM
CEM, 906 CEM CEM
SOURCEM
eGRID consumed fuel 2005 (by destination)
1370 416 1059 65
136 199 1611 805
721 1004 1597 1871 59 100
195 669 344 216 1279 1720 2226 189 137 661 1717 1760 445 2558 1750 1097 521 365 528 440
290 2160 349
NAMEPCAP
Delivered coal 2005 (by destination)
88.24 88.21 85.44 52.31
88.24 86.55 86.87 84.60
93.63 82.29 83.18 88.24 17.53 5.07
88.07 88.24 88.24 88.33 83.49 83.07 88.24 88.24 88.24 88.23 88.24 84.84 88.24 88.24 88.24 88.24 88.24 88.24 88.24 88.24
88.21 88.23 88.16
PLCO2RA
Table SA2a. Carbon dioxide emission factors for U.S. coal by destination state and power plant, 2005, Si units.
100 100 100 98 100 100 100 100 87 100 100 99 99 100 93 99 100 100 100 99 63 59 53 100 80 53 100 0 1 100 94 94 81 100 99 80 61
BIT BIT BIT BIT BIT BIT BIT BIT BIT BIT BIT BIT BIT BIT BIT BIT SC BIT BIT PC LIG SUB SUB SUB BLQ WDS BIT BIT BIT BIT BIT BIT BIT BIT
PLPRMFL SUB SUB SUB
PLCLPR
notes
STATE Plant R Paul Smith Power Station Chalk Point LLC Dickerson Morgantown Generating Plant AES Warrior Run Cogeneration Facility MAINE Rumford Cogeneration S D Warren Westbrook MICHIGAN B C Cobb Dan E Karn J H Campbell J C Weadock J R Whiting Harbor Beach Monroe River Rouge S D Warren Muskegon St Clair Trenton Channel Belle River J B Sims James De Young Marysville Eckert Station Erickson Station Shiras Endicott Station Presque Isle Wyandotte White Pine Electric Power Escanaba Paper Company T B Simon Power Plant TES Filer City Station MINNESOTA Syl Laskin Clay Boswell Black Dog High Bridge Allen S King Riverside 26 36 155 79 50 13 126 58 60 67 38 12 7 23 21 14 28 39 18 12 24 69 40 12 36 12 12 22 12
FERC FERC FERC FERC FERC FERC FERC FERC FERC FERC FERC FERC FERC FERC FERC FERC FERC FERC FERC EIA EIA EIA EIA FERC FERC FERC FERC FERC FERC
13 12
EIA EIA
Data
42 98 74 23 51
n
EIA EIA EIA EIA EIA
Mg 906,853 584,712 196,017 174,065 2,010,854 176,873 67,958 165,563 226,059 185,502 18,213,717 412,776 3,973,500 858,946 640,229 1,177,682 1,055,799
4,160,419 2,013,984 3,492,720 170,098 136,987
169,857 1,461,578 1,177,615 2,472,740 673,816 233,326 132,087 101,240 33,163,025 968,708 1,223,541 4,349,298 1,536,525 1,195,508 171,461 7,788,312 1,261,008
MJ/kg 20.72 20.91 22.93 27.78 24.52 25.74 31.32 28.95 29.81 24.39 20.72 21.85 20.98 20.58 20.73 20.67 20.76
22.69 24.08 21.78 26.95 28.18
27.88 29.94 30.28 30.07 26.64 29.83 30.11 29.46 23.43 22.75 20.56 23.57 25.10 22.02 28.86 24.17 23.25
Ash S44
5.3 5.6 4.3 10.6 7.2 8.4 8.9 9.4 9.0 6.0 6.6 4.3 6.7 4.4 4.4 5.4 4.3
4.7 5.8 4.3 8.2 9.3
14.3 8.0 9.2 7.9 19.6 7.6 6.9 8.6 6.2 7.9 5.2 6.7 8.6 6.3 8.1 6.3 7.1
S 0.3 0.3 0.4 3.4 0.5 0.8 1.6 0.7 1.4 0.7 0.4 0.4 0.5 0.2 0.2 0.3 0.2
0.6 0.7 0.3 2.1 0.9
0.9 1.6 1.4 1.8 1.8 0.8 0.8 0.8 0.6 0.6 0.3 0.5 0.7 0.4 0.6 0.7 0.5
kg CO2/GJ 92.02 91.89 91.26 87.22 89.95 89.28 87.75 88.40 88.18 89.93 91.88 91.81 91.86 92.18 92.19 92.09 92.19
91.29 90.17 91.85 87.32 89.37
90.31 88.13 c 88.10 88.99 c 90.42 88.37 88.39 88.35 90.64 90.69 92.15 90.43 89.65 91.22 89.10 90.38 90.63
ORISPL 1891 1893 1904 1912 1915 1927
1695 1702 1710 1720 1723 1731 1733 1740 50438 1743 1745 6034 1825 1830 1732 1831 1832 1843 4259 1769 1866 10148 1771 10328 50835
10495 50447
1570 1571 1572 1573 10678
CEM CEM CEM CEM CEM CEM
CEM CEM CEM CEM, 906 CEM, 906 CEM, 906 CEM, 906 CEM, 906 767 CEM, 906 CEM CEM CEM CEM, 767 906 CEM CEM CEM, 767 CEM CEM, 767 CEM 767 767, 906 767 767
767 767
CEM CEM CEM CEM, 906 767
SOURCEM
eGRID consumed fuel 2005 (by destination)
116 1073 619 277 598 404
520 1946 1559 331 364 125 3293 944 51 1571 776 1664 65 63 150 375 155 78 58 625 78 60 50 99 70
103 71
110 2647 930 1548 229
NAMEPCAP
Delivered coal 2005 (by destination)
88.24 88.27 83.58 88.24 88.24 88.24
88.24 88.24 88.30 88.24 88.24 88.24 88.60 88.07 86.98 85.40
87.14 83.50 88.24 88.22 88.24 88.22 88.24 87.27 79.78 88.22 88.24 87.44 88.24 88.48
47.91 38.45
88.24 79.02 86.50 87.55 88.64
PLCO2RA
Table SA2a. Carbon dioxide emission factors for U.S. coal by destination state and power plant, 2005, Si units.
99 58 92 97 100 23 37 96 83 100 99 100 99 100 98 66 99 100 98 100 100 100 100 100 100 98 100 85 100 84 96 77 100 100 75 96 84 92
BIT WDS SUB SUB SUB SUB SUB BIT BIT BIT BIT SUB BIT SUB BIT BIT BIT SUB SUB SUB BIT BIT BIT BIT BIT BIT BIT SUB SUB SUB SUB SUB SUB
PLPRMFL BIT BIT BIT SC BIT
PLCLPR
notes
STATE Plant Sherburne County Hoot Lake M L Hibbard Silver Lake Taconite Harbor Energy Center Silver Bay Power MISSOURI New Madrid Thomas Hill Chamois Columbia Asbury Blue Valley Hawthorn Montrose Iatan Sibley Sikeston Power Station James River Power Station Southwest Power Station Lakeroad Marshall Labadie Meramec Sioux Rush Island University of Missouri Columbia Henderson MISSISSIPPI Jack Watson Victor J Daniel Jr R D Morrow Red Hills Generating Facility MONTANA Lewis and Clark Colstrip J E Corette Plant NORTH CAROLINA Asheville Cape Fear Lee 19 10 7 12 12 44 10 25 26 45 34 36 41 11 20 18 36 87 50 62 58 12
33 62 30 12 14 48 22 67 48 23
FERC EIA EIA FERC FERC FERC FERC FERC FERC FERC FERC FERC FERC FERC FERC FERC FERC FERC FERC FERC FERC EIA
FERC FERC FERC EIA FERC EIA EIA FERC FERC FERC
Data
84 12
n
FERC FERC
Mg
20.34 20.54 22.16 19.59 25.28 20.92 26.33 24.64 29.13 11.85 19.65 15.79 19.76 19.48 28.67 29.25 28.64 28.86
9,203,538 1,686,322 3,203,604 1,045,150 3,268,462 10,345,393 242,948 9,512,349 590,095 27,471,028 889,895 741,005 792,897
27.18 21.98 20.62 20.59 20.45 20.66 21.64 31.02 21.86 24.95 20.07 20.35 19.85 22.15 20.58 20.64 20.72 22.21
20.28 21.54
MJ/kg
8,917,455 3,299,803 3,137,033 4,563,662 133,436
147,239 748,252 430,238 39,189,872 3,842,491 3,760,761 255,382 40,072 497,200 188,521 1,820,587 1,845,626 2,477,055 1,261,498 991,513 1,023,957 698,635 435,184
8,238,019 531,037
Ash S45
10.9 7.1 7.9 11.9 15.6 9.1 8.5 9.4 4.5 11.5 11.2 11.8 9.9
5.2 5.1 5.6 5.2 8.0
7.3 4.1 5.3 5.2 4.5 4.5 5.7 7.3 6.2 13.3 5.2 5.5 5.0 6.2 5.3 5.2 4.5 6.1
7.8 4.7
S 0.6 0.7 0.4 1.2 0.5 0.7 0.5 0.7 0.2 0.9 0.8 0.9 0.8
0.3 0.3 0.8 0.3 3.6
1.0 0.3 0.2 0.4 0.2 0.2 1.0 1.4 0.9 2.9 0.3 0.4 0.3 0.5 0.3 0.2 0.2 0.4
0.5 0.4
kg CO2/GJ 90.67 89.14 90.07 88.17 95.61 91.98 94.83 91.91 92.16 88.41 88.30 88.49 88.48
92.14 92.16 90.91 92.10 87.45
88.19 91.82 91.82 91.91 92.18 92.19 90.91 88.14 90.63 87.58 92.13 92.10 92.12 91.01 92.14 92.19 92.19 91.11
91.86 91.81
ORISPL 2706 2708 2709
6089 6076 2187
2049 6073 6061 55076
2167 2168 2169 2123 2076 2132 2079 2080 6065 2094 6768 2161 6195 2098 2144 2103 2104 2107 6155 50969 2062
6090 1943 1897 2008 10075 10849
CEM CEM, 906 CEM
CEM CEM CEM
CEM, 906 CEM CEM CEM,
CEM CEM CEM, 767 CEM, 906 CEM CEM, 767, 9 CEM CEM CEM CEM CEM CEM, 767 CEM, 906 CEM, 767, 9 767, 906, CEM CEM, 906 CEM CEM 767, 906 767, 906
CEM CEM CEM, CEM, 767 CEM 767
SOURCEM
eGRID consumed fuel 2005 (by destination)
837 431 508
50 2272 173
1216 2229 400 514
1200 1135 59 95 232 176 1071 564 726 524 261 451 303 273 57 2389 1041 1099 1242 91 59
2129 138 73 99 252 132
NAMEPCAP
Delivered coal 2005 (by destination)
86.37 88.17 86.31
93.47 88.23 88.24
87.68 80.72 88.24 93.49
88.24 88.23 88.36 88.16 88.24 87.62 85.18 88.24 88.24 88.24 91.23 88.56 88.16 87.18 85.42 88.24 88.21 88.24 88.24 85.28 88.00
88.24 88.24 88.93 86.91 88.21 91.83
PLCO2RA
Table SA2a. Carbon dioxide emission factors for U.S. coal by destination state and power plant, 2005, Si units.
99 72 100 100 100 100 100 94 100 100
LIG SUB SUB BIT BIT BIT
100 100 100 100 99 97 90 99 100 99 100 99 100 98 93 100 99 99 100 87 96
SUB SUB SUB BIT SUB BIT SUB SUB SUB SUB SUB SUB SUB SUB BIT SUB SUB SUB SUB BIT BIT BIT BIT BIT LIG
100 100 76 95 100 98
PLPRMFL SUB SUB SUB BIT SUB SUB
PLCLPR
notes
Cogentrix Roxboro (Primary Energy Roxboro) Cogentrix Dwayne Collier Battle Cogen (Edgecombe Genco LLC) Weyerhaeuser Plymouth NC Canton North Carolina Westmoreland-LG&E Roanoke Valley I Roanoke Valley Energy Facility II NORTH DAKOTA Leland Olds Antelope Valley Coal Creek Milton R Young Heskett Coyote Stanton NEBRASKA Lon Wright Whelan Energy Center Sheldon Gerald Gentleman North Omaha Nebraska City Platte NEW HAMPSHIRE Merrimack Schiller NEW JERSEY B L England
STATE Plant Roxboro L V Sutton W H Weatherspoon Mayo G G Allen Buck Cliffside Dan River Marshall Riverbend Belews Creek Cogentrix Southport (Primary Energy Southport)
Data
30 13 12 36 44
20 12 12 24 36 24 12 18 35 12 46 12 25 13 48 19 31
EIA EIA EIA
FERC FERC FERC FERC FERC FERC FERC FERC FERC FERC FERC FERC FERC FERC FERC FERC FERC
221 68 23 107 216 52 135 19 298 68 357 25
n
EIA EIA
FERC FERC FERC FERC FERC FERC FERC FERC FERC FERC FERC EIA
Mg
29.57 30.24 29.03 15.54 15.84 15.30 14.54 15.50 18.22 16.13 21.66 19.93 20.58 19.22 19.99 19.91 20.20 19.81 19.73 30.23 30.68 29.73 29.41 30.14
23,032,515 3,616,916 4,954,673 7,006,306 3,970,602 488,618 2,252,578 742,824 11,149,059 323,580 361,774 884,286 5,253,708 1,712,159 2,212,570 400,982 1,556,668 803,906 752,762 4,208,993 514,338
30.80 30.41
28.92 29.18 28.42 28.78 27.26 26.91 28.47 29.65 28.70 28.44 28.54 30.16
MJ/kg
258,357 374,048 577,751
76,025 390,144
5,907,421 1,187,932 341,705 1,948,713 2,356,906 603,288 1,477,829 293,933 3,080,851 730,296 5,235,451 206,581
Ash S46
9.4 8.2 9.1 11.2 8.5 8.1 9.0 5.3 4.9 5.1 5.4 4.4 4.6 5.4 5.1 5.1 7.3 7.0 7.7 9.5 8.0
9.2 7.2 11.1
7.3 7.6
10.9 9.3 11.9 10.9 15.2 15.5 12.0 10.1 11.5 11.6 12.2 8.2
S 0.7 0.6 0.6 0.6 0.8 0.7 1.0 0.3 0.3 0.3 0.4 0.3 0.3 0.4 0.3 0.3 1.2 1.5 0.8 1.1 2.0
0.7 1.0 1.3
0.8 0.7
0.9 0.8 1.1 0.7 0.9 0.7 1.0 0.7 0.9 0.9 0.9 0.8
kg CO2/GJ 93.65 93.88 94.17 92.89 94.28 93.62 94.10 91.83 92.13 92.15 92.10 92.16 92.15 92.09 92.12 92.13 88.09 87.84 88.36 88.11 87.77
88.50 87.74 87.99
88.10 88.38
88.46 88.39 88.30 88.54 88.58 88.72 88.27 88.62 88.17 88.14 88.53 88.28
ORISPL 2378
2364 2367
2240 60 2277 6077 2291 6096 59
2817 6469 6030 2823 2790 8222 2824
50189 50244 54035 54755
10379 10384
2712 2713 2716 6250 2718 2720 2721 2723 2727 2732 8042 10378
CEM, 906
CEM, 906 CEM, 906
CEM, 767 CEM CEM CEM CEM CEM CEM
CEM CEM CEM CEM CEM, 767 CEM CEM
767 767 767 767
767 767
CEM CEM, 906 CEM, 906 CEM CEM CEM, 906 CEM CEM, 906 CEM CEM, 906 CEM 767
SOURCEM
eGRID consumed fuel 2005 (by destination)
484
496 171
170 76 229 1363 645 652 110
656 870 1212 734 115 450 190
154 53 182 58
68 115
2575 763 342 736 1155 474 781 388 1996 601 2160 135
NAMEPCAP
Delivered coal 2005 (by destination)
86.51
88.23 87.77
88.13 88.31 88.24 88.24 88.00 88.24 88.24
93.63 93.63 93.63 93.63 93.11 93.63 88.24
20.08 88.64 88.63 88.63
79.56 88.64
88.23 88.19 88.16 88.23 88.24 88.14 88.24 88.03 88.24 88.09 88.24 85.01
PLCO2RA
Table SA2a. Carbon dioxide emission factors for U.S. coal by destination state and power plant, 2005, Si units.
100 100 100 100 100 100 100 98 100 100 100 99 100 100 100 98 94
LIG LIG LIG LIG LIG LIG SUB SUB SUB SUB SUB SUB SUB SUB BIT BIT BIT
26 51 100 100
82 100
BIT BIT WDS BIT BIT BIT
100 100 100 100 100 100 100 100 100 100 100 90
PLPRMFL BIT BIT BIT BIT BIT BIT BIT BIT BIT BIT BIT BIT
PLCLPR
notes
STATE Plant Howard Down Deepwater PSEG Hudson Generating Station PSEG Mercer Generating Station Logan Generating Plant Chambers Cogeneration LP NEW MEXICO Four Corners San Juan Escalante NEVADA Reid Gardner North Valmy Mohave NEW YORK S A Carlson Rochester 7 Danskammer Generating Station AES Westover AES Greenidge LLC AES Cayuga C R Huntley Generating Station Dunkirk Generating Station Lovett AES Somerset LLC Kodak Park Site Black River Generation WPS Power Niagara (Niagara Generating Facility) Trigen Syracuse Energy OHIO Ashtabula Bay Shore Eastlake Lake Shore R E Burger W H Sammis Cardinal Walter C Beckjord Miami Fort W H Zimmer 51 54 32 30 33 16 37 50 38 51 30 9 59 12
FERC FERC EIA EIA EIA EIA EIA EIA EIA EIA EIA EIA EIA EIA 53 63 105 39 42 162 205 233 225 137
43 34 12
FERC FERC FERC
EIA EIA EIA EIA EIA EIA FERC FERC FERC FERC
11 18 12
FERC FERC FERC
Data
10 9 12 12 80 24
n
FERC EIA EIA EIA EIA EIA
Mg 146,647 53,549,264 973,539 1,697,158 3,714,941 543,642 768,619 6,902,309 4,271,823 2,467,511 2,414,377 3,303,605
39,128 131,031 1,171,856 968,903 598,938 784,801 17,835,579 7,411,824 9,391,815 1,031,940 7,176,196 1,416,421 1,622,035 4,137,739 8,676,315 76,640 428,274 806,550 316,667 354,559 807,834 1,239,552 1,622,180 620,320 1,451,654 606,133 112,973 86,332
MJ/kg 30.89 27.03 20.65 20.56 25.45 20.61 25.59 24.82 28.37 27.40 27.61 28.45
30.00 28.69 29.08 29.08 29.26 30.08 21.71 20.48 22.72 21.39 26.03 28.12 25.35 25.58 27.52 28.69 30.49 29.79 30.11 30.45 30.00 21.99 22.51 30.13 30.22 30.39 30.83 24.83
Ash S47
6.6 9.9 5.4 5.5 6.4 5.1 7.5 9.1 11.6 13.1 11.4 10.2
6.9 11.7 10.3 10.3 10.6 7.5 20.5 21.8 19.7 18.4 10.0 9.1 11.2 9.9 7.4 11.2 8.6 7.0 8.7 8.0 8.2 5.5 5.6 9.3 8.1 8.1 8.1 20.6
S 0.8 1.8 0.3 0.3 1.1 0.3 1.1 0.6 1.3 1.2 1.4 3.7
0.7 0.7 0.8 0.8 1.1 1.8 0.8 0.8 0.8 0.8 0.5 0.7 0.5 0.5 1.4 1.8 1.8 0.6 2.0 1.9 2.2 0.5 0.6 0.6 2.9 1.6 2.0 2.0
kg CO2/GJ 88.18 88.26 92.05 92.15 89.13 92.17 89.21 89.65 88.17 88.15 88.09 86.85
88.42 88.31 88.34 88.34 88.60 87.34 89.51 89.56 89.61 88.19 89.51 88.37 89.24 90.05 88.60 87.72 87.58 88.50 87.41 87.41 87.59 91.22 90.69 88.31 87.34 87.99 87.15 87.79
b b b b b b
ORISPL 2835 2878 2837 2838 2864 2866 2828 2830 2832 6019
50651
2682 2642 2480 2526 2527 2535 2549 2554 2629 6082 10025 10464 50202
2324 8224 2341
2442 2451 87
2434 2384 2403 2408 10043 10566
CEM CEM, 906 CEM, 906 CEM, 906 CEM, 906 CEM, 906 CEM CEM, 906 CEM, 906 CEM
767
CEM, CEM CEM CEM CEM CEM CEM CEM CEM CEM 767 767 CEM
CEM CEM CEM
CEM CEM CEM
767 CEM, 906 CEM CEM, 906 767 767
SOURCEM
eGRID consumed fuel 2005 (by destination)
256 655 1289 260 548 2468 1880 1433 1444 1426
101
101 253 537 119 163 323 816 627 449 655 201 56 56
612 521 1636
2270 1848 257
71 174 1114 768 242 285
NAMEPCAP
Delivered coal 2005 (by destination)
87.92 89.19 88.23 88.23 88.23 88.24 88.24 88.15 88.23 88.24
88.64
86.96 88.24 86.05 88.24 88.24 88.24 88.24 88.44 87.39 88.24 85.03 86.53 94.26
88.09 88.24 88.19
88.11 88.25 88.24
86.56 103.16 85.37 85.89 88.59 88.61
PLCO2RA
Table SA2a. Carbon dioxide emission factors for U.S. coal by destination state and power plant, 2005, Si units.
100 75 100 100 100 100 100 100 100 100
94 100 91 100 99 100 100 100 98 79 90 63 46
BIT BIT BIT BIT BIT BIT SUB SUB BIT BIT BIT BIT
SUB SUB BIT SUB BIT BIT BIT BIT BIT BIT
100 100 100
BIT BIT BIT
87
100 100 100
SUB SUB SUB
BIT BIT
85 89 93 95 100 100
PLPRMFL BIT BIT BIT BIT BIT BIT
PLCLPR
notes
STATE Plant Conesville Dover Picway O H Hutchings J M Stuart Killen Station Hamilton Muskingum River General James M Gavin Kyger Creek Orrville Painesville Richard Gorsuch Avon Lake Niles MW Custom Papers (P H Glatfelter Co Chillicothe Facility) OKLAHOMA GRDA Muskogee Sooner Northeastern Hugo Muskogee Mill AES Shady Point OREGON Boardman PENNSYLVANIA Bruce Mansfield Hatfield (Hatfields Ferry Power Station) Elrama Power Plant Portland Titus Conemaugh Homer City Station Shawville St Nicholas Cogen Project Keystone New Castle Plant PPL Brunner Island PPL Martins Creek 24 70 24 9
EIA EIA EIA EIA
11
FERC 101 196 16 21 25 24 175 149
44 57 43 18 24 23 114
FERC FERC FERC FERC FERC EIA EIA
EIA EIA EIA EIA EIA EIA EIA EIA
59 18 186 100 32 38 43 143 12 24 36 61 13 36
FERC FERC FERC FERC FERC FERC FERC FERC FERC FERC FERC EIA EIA EIA
Data
68
n
FERC
Mg
29.73 29.47 29.46 28.88
20.39 19.60 20.45 20.43 20.21 19.48 21.89 23.53 19.44 19.44 27.58 29.24 29.92 30.11 30.45 30.34 29.19 27.45 27.91
19,355,150 3,725,757 5,072,102 3,300,135 3,792,920 1,723,855 457,623 1,282,759 2,062,260 2,062,260 47,628,837 6,762,694 3,188,397 663,900 747,660 479,826 4,424,599 6,933,443 1,297,022 4,559,118 518,949 3,558,960 311,435
27.07 29.36 27.05 27.66 28.29 30.26 28.97 27.85 30.11 28.56 24.27 29.63 28.26 26.15
27.23
MJ/kg
120,658 243,402 5,256,045 1,566,916 150,344 2,714,977 6,916,511 3,019,978 178,755 117,618 582,393 1,325,921 437,835 278,943
3,581,444
Ash S48
9.8 8.1 9.4 10.6
5.9 5.0 5.0 5.0 5.5 4.8 5.7 17.0 4.9 4.9 14.3 10.2 8.6 7.2 7.3 7.6 11.4 16.5 13.8
8.5 8.8 13.9 13.1 11.6 7.7 9.0 8.7 10.3 7.3 13.9 8.7 11.8 11.7
10.4
S 1.9 1.6 1.5 1.7
0.4 0.3 0.2 0.2 0.4 0.3 0.4 1.8 0.3 0.3 2.1 2.9 2.3 1.6 1.8 1.5 2.5 2.4 1.8
2.6 0.9 0.9 0.6 1.3 2.7 3.6 1.3 4.2 3.1 2.0 1.6 3.3 4.2
2.9
kg CO2/GJ 87.66 c 87.58 87.89 c 87.79
91.98 92.11 92.18 92.18 92.08 92.13 91.09 90.36 92.12 92.12 88.09 87.00 b 87.64 87.73 c 87.32 87.64 87.30 c 88.38 88.67
87.61 88.33 88.44 c 88.43 c 88.07 87.03 87.10 88.43 86.13 86.83 88.59 87.65 87.64 87.74
87.30
ORISPL 6094 3179 3098 3113 3115 3118 3122 3131 54634 3136 3138 3140 3148
6106
165 2952 6095 2963 6772 10362 10671
2840 2914 2843 2848 2850 6031 2917 2872 8102 2876 2935 2936 7286 2836 2861 10244
CEM CEM CEM CEM CEM, 906 CEM, 906 CEM CEM, 906 767 CEM, 906 CEM, 906 CEM, 906 CEM, 906
CEM
CEM CEM CEM CEM CEM 767 767
CEM 767, 906 CEM CEM, 906 CEM, 906 CEM, 906 CEM, 767, 9 CEM CEM CEM 767 767 CEM CEM, 906 CEM, 906 767
SOURCEM
eGRID consumed fuel 2005 (by destination)
2741 1728 510 621 261 1883 2012 632 99 1884 354 1567 2113
601
1010 1889 1138 1951 446 114 350
2175 54 106 447 2452 687 138 1529 2600 1086 85 54 200 870 293 93
NAMEPCAP
Delivered coal 2005 (by destination)
88.24 88.24 88.24 87.69 88.22 88.23 88.24 88.23 89.54 88.23 88.24 88.23 77.04
88.24
88.03 87.77 88.18 76.53 88.24 91.16 88.64
88.24 87.04 88.24 88.45 88.24 88.19 87.77 88.24 88.24 88.24 88.57 88.51 88.24 88.22 88.23 50.93
PLCO2RA
Table SA2a. Carbon dioxide emission factors for U.S. coal by destination state and power plant, 2005, Si units.
PLPRMFL
100 99 100 55 100 100 100 100 100 100 99 97 100 100 100 100 99 100 100 100 23
SUB BIT BIT BIT BIT BIT SC BIT BIT WC SC BIT SC RFO
100 97 99 97 100 100 98 100 100 100 100 100 99 100 100 54
SUB SUB SUB SUB SUB SUB BIT
BIT
BIT BIT BIT BIT BIT SC BIT BIT BIT BIT BIT BIT BIT BIT BIT
PLCLPR
notes
STATE Plant PPL Montour Sunbury (WPS Energy Servs Sunbury Gen) Cromby Generating Station Eddystone Generating Station Hunlock Power Station Armstrong Power Station Mitchell Power Station Cheswick Power Plant John B Rich Memorial Power Station Colver Power Project Ebensburg Power Cambria Cogen AES Beaver Valley Partners Beaver Valley Kline Township Cogen Facility G F Weaton Power Station P H Glatfelter Chester Operations Panther Creek Energy Facility Northhampton Generating LP Scrubgrass Generating Seward SOUTH CAROLINA H B Robinson W S Lee Canadys Steam Cogen South McMeekin Urquhart US DOE Savannah River Site (D Area) Wateree Williams Cope Cross Dolphus M Grainger Jefferies Winyah Ben French Stone Container Florence Mill SOUTH DAKOTA Big Stone TENNESSEE
Data
27
FERC
160 54 57 85 23 48 103
FERC FERC FERC FERC FERC FERC FERC 12
20 27
FERC FERC
EIA
40 47 44
24 267 35 62 71 98 52 45 12 12 12 12 21 59 14 23 24 76 47 94
n
FERC FERC FERC
EIA EIA EIA EIA EIA EIA EIA EIA EIA EIA EIA EIA EIA EIA EIA EIA EIA EIA EIA EIA
180,735 1,576,714 1,576,714 25,063,525
2,783,017 1,382,936 541,598 2,859,149 402,068 683,832 3,044,399
187,972 353,989
29.49 20.26 20.26 26.30
29.24 29.69 29.13 29.90 28.87 28.99 28.74
29.73 29.93
29.30 28.61 28.96 29.51
14,296,305 415,745 528,898 931,967
Mg
29.23 23.39 30.87 30.59 20.64 28.54 28.46 29.61 15.98 15.80 14.16 17.09 30.49 12.09 21.96 30.24 13.39 15.34 14.88 17.40
MJ/kg
3,686,067 922,519 280,000 1,079,364 152,126 732,841 692,214 954,761 603,242 600,923 465,759 547,484 424,885 467,551 297,466 296,197 232,147 686,058 508,614 552,616
Ash S49
8.1 5.4 5.4 8.7
10.2 8.6 10.4 9.4 10.3 10.4 11.1
8.2 8.1
10.0 11.9 10.9 9.1
10.8 21.5 6.8 7.1 29.5 11.5 10.9 9.6 41.9 38.5 44.6 46.1 8.5 49.5 7.2 6.9 39.8 37.2 39.4 37.9
S 0.9 0.3 0.3 1.2
1.0 0.9 1.1 1.8 1.3 1.4 1.2
1.2 1.3
1.2 1.2 0.9 1.2
1.8 1.2 1.8 1.7 0.9 2.0 3.8 1.7 0.4 2.2 1.6 3.2 2.3 0.3 0.4 1.8 0.6 0.3 0.5 2.4
kg CO2/GJ 88.18 92.14 92.14 88.84
88.04 88.04 87.93 87.65 c 87.96 c 88.00 c 88.17
87.83 87.82
87.97 88.12 88.27 87.86
87.71 c 90.28 87.95 87.83 95.70 87.50 86.85 c 87.71 99.73 87.65 88.80 87.63 87.09 100.68 90.53 87.38 100.23 100.31 100.47 87.04
ORISPL 6098
3251 3264 3280 7737 3287 3295 7652 3297 3298 7210 130 3317 3319 6249 3325 50806
3149 3152 3159 3161 3176 3178 3181 8226 10113 10143 10603 10641 10676 50039 50130 50397 50410 50776 50888 50974 3130
CEM
CEM, 906 CEM, 906 CEM 767 CEM CEM 767 CEM CEM, 906 CEM CEM CEM CEM CEM 767, 906 767
CEM CEM, 906 CEM, 906 CEM, 906 CEM CEM CEM CEM 767 767 767 767 767 767 767 767 767 767 767 767 CEM
SOURCEM
eGRID consumed fuel 2005 (by destination)
457
992 542 490 99 294 759 78 772 687 417 1738 163 578 1260 135 108
1642 491 420 1569 50 326 374 637 88 118 58 98 149 58 120 110 67 94 114 95 585
NAMEPCAP
Delivered coal 2005 (by destination)
88.24
88.21 88.02 88.24 52.67 88.24 76.82 88.50 88.24 88.23 88.24 88.45 88.24 87.73 88.24 91.29 28.33
88.24 92.74 82.07 83.18 92.29 88.24 88.18 88.12 89.54 89.47 89.54 89.54 88.70 89.54 90.13 44.75 92.72 89.51 88.55 89.61 88.24
PLCO2RA
Table SA2a. Carbon dioxide emission factors for U.S. coal by destination state and power plant, 2005, Si units.
PLPRMFL
17 100 99 49 100 61 100 100 100 100 96 100 88 100 98 24 100
SUB
100 100 67 68 84 100 100 100 100 100 100 100 99 99 99 50 47 100 76 98 100 BIT BIT BIT BIT BIT BIT BIT BIT BIT BIT SC BIT BIT SC SUB BIT
SC BIT BIT BIT BIT BIT BIT BIT WC WC WC WC BIT WC SUB BIT PC WC WC WC WC
PLCLPR
notes
Johnsonville (GRT coal) Tennessee Eastman Operations Bowater Newsprint Calhoun Operation TEXAS Fayette Power Project Oklaunion J T Deely San Miguel Welsh Pirkey Harrington J K Spruce Tolk Gibbons Creek Limestone W A Parish Big Brown Martin Lake Monticello Coleto Creek Sandow No 4 Twin Oaks Power One Sandow Station UTAH Intermountain Power Project Carbon Hunter Huntington Bonanza Sunnyside Cogen Associates KUCC VIRGINIA Clinch River Glen Lyn
STATE Plant Bull Run Cumberland Gallatin (includes GRT coal) John Sevier Kingston (includes GRT coal) Allen Steam Plant (includes Cora and GRT coal)
Data
114 12 29 27 32 12 38 12 12 12 30 26 39 24 24 24 28 12 12 12 90 35 35 28 12 12 12 58 80
FERC FERC FERC FERC FERC FERC FERC FERC FERC EIA EIA EIA EIA EIA EIA EIA EIA EIA FERC FERC FERC FERC FERC EIA EIA FERC FERC
85 75 5 28 162 35
n
FERC EIA EIA
FERC FERC FERC FERC FERC FERC
Mg 4,011,357 1,875,710 7,748,309 9,554,231 5,506,416 13,122,308 10,417,723 2,245,496 3,508,278 1,942,251 2,057,282 15,754,903 5,534,464 615,082 4,088,750 2,770,589 1,942,814 442,581 360,623 13,967,698 1,431,834 658,083
3,527,100 1,486,354 168,572 90,097,407 3,979,061 2,438,562 5,119,448 3,019,844 5,441,367 3,854,179 4,255,584
2,240,612 5,815,034 3,603,645 1,840,999 3,885,333 2,495,876
MJ/kg 20.06 19.69 16.36 19.76 17.43 16.35 16.72 22.11 13.38 16.02 15.35 25.08 26.34 26.55 25.88 24.76 22.47 12.30 26.21 29.41 28.85 29.66
24.10 30.00 30.18 17.74 20.10 19.32 19.84 12.25 19.96 15.46 20.63
28.80 27.60 24.27 28.98 25.84 23.31
Ash S50
5.0 5.3 14.3 5.1 10.7 12.8 12.2 5.3 18.0 15.4 22.2 13.3 10.8 10.0 11.5 17.4 11.8 51.2 8.9 10.5 13.0 10.3
7.1 8.3 7.4 10.2 5.1 5.2 5.3 22.7 4.6 13.8 4.9
11.1 9.0 7.3 11.9 9.5 6.5
S 0.3 0.3 0.9 0.4 0.7 1.3 0.4 0.3 1.2 1.1 1.8 0.5 0.6 0.4 0.5 0.5 0.5 0.9 0.4 1.0 0.9 0.9
0.7 0.9 1.0 0.7 0.3 0.4 0.3 2.4 0.3 0.9 0.3
0.7 3.0 0.7 0.7 0.7 0.5
kg CO2/GJ 92.15 92.13 91.56 92.11 91.70 92.04 92.10 91.57 90.41 92.09 90.17 88.96 88.89 88.74 c 89.19 88.27 c 89.75 87.53 89.86 88.54 88.77 88.92
89.96 a 88.14 c 87.72 91.88 92.10 92.11 92.09 89.51 92.15 92.38 92.16
88.29 87.38 89.88 a 88.24 89.39 a 90.45 a
ORISPL 3775 3776
6481 3644 6165 8069 7790 50951 56163
6179 127 6181 6183 6139 7902 6193 7097 6194 6136 298 3470 3497 6146 6147 6178 6648 7030 52071
3406 50481 50956
3396 3399 3403 3405 3407 3393
CEM CEM
CEM CEM CEM CEM CEM 767 767
CEM CEM CEM CEM CEM CEM CEM CEM CEM CEM CEM CEM, 906 CEM CEM CEM CEM CEM CEM 767
CEM 767 767
CEM CEM CEM CEM CEM CEM, 906
SOURCEM
eGRID consumed fuel 2005 (by destination)
713 338
1640 189 1472 996 500 58 214
1690 720 932 410 1674 721 1080 566 1136 454 1850 3969 1187 2380 1980 600 591 349 363
2911 194 63
950 2600 1918 800 1700 1611
NAMEPCAP
Delivered coal 2005 (by destination)
88.24 88.24
88.24 88.24 88.24 88.24 88.24 89.54 88.64
88.18 88.01 88.24 93.63 88.24 93.63 88.24 88.24 88.24 88.24 93.63 85.81 92.73 92.81 92.35 88.24 91.42 93.63 91.52
87.75 87.27 20.13
88.24 88.24 87.91 88.24 88.24 88.20
PLCO2RA
Table SA2a. Carbon dioxide emission factors for U.S. coal by destination state and power plant, 2005, Si units.
PLPRMFL
99 100 67 100 100 100 100 100 100 100 100 100 100 99 94 100 100 100 100 100 100 100 100 100 100 100 100 100 99 100 99
SUB SUB SUB LIG SUB LIG SUB SUB SUB SUB LIG SUB LIG LIG SUB SUB LIG LIG LIG BIT BIT BIT BIT BIT WC BIT BIT BIT
100 100 99 100 100 100 SUB SUB BIT WDS
BIT BIT SUB BIT BIT
PLCLPR
notes
24 29 23 15 14 23 13 11 29 84 13 54 29 59 15 24 17 12
EIA EIA FERC FERC FERC FERC FERC FERC FERC FERC FERC FERC FERC FERC FERC EIA EIA EIA EIA
Birchwood Power WASHINGTON Transalta Centralia Generation WISCONSIN Alma Genoa Blount Street Manitowoc Bay Front Oak Creek (South Oak Creek) Valley Pleasant Prairie Edgewater Nelson Dewey Columbia Pulliam Weston E J Stoneman Station Biron Mill Green Bay West Mill John P Madgett Wisconsin Rapids Pulp Mill WEST VIRGINIA John E Amos Kanawha River Mountaineer FERC FERC FERC
68
EIA EIA
202 85 156
31 24
38 215 153 55 139 34 28 23 45 48 22
International Paper Franklin Mill Cogentrix of Richmond (Spruance Genco LLC)
Data FERC FERC FERC FERC FERC FERC FERC FERC EIA EIA EIA
n
STATE Plant Bremo Bluff Chesterfield Chesapeake Yorktown Clover Altavista Southhampton Mecklenburg Cogeneration Facility Potomac River Cogentrix Portsmouth Cogentrix Hopewell (James River Cogeneration)
Mg 154,807 34,598,518 6,991,246 826,769 3,810,957
570,391 5,895,707 5,895,707 22,243,434 1,656,184 1,113,134 205,207 105,414 127,477 2,956,795 786,372 4,576,648 2,323,820 497,772 3,780,856 1,458,778 1,949,573 64,244 190,479 295,873
194,965 785,959
680,953 3,026,637 1,429,439 746,535 2,504,153 152,382 150,894 353,209 558,787 350,647 372,830
MJ/kg 20.47 27.85 28.07 28.31 26.23
29.20 18.91 18.91 21.15 22.35 23.67 25.34 28.77 23.56 20.64 28.26 19.82 20.37 21.84 19.66 21.53 20.54 27.80 23.67 28.52
30.35 30.14
28.33 29.32 29.23 29.49 29.41 29.35 29.14 29.71 29.72 30.22 31.20
Ash S51
4.5 12.5 12.2 13.0 10.9
10.5 13.3 13.3 5.3 6.0 6.7 8.3 9.3 5.1 4.5 8.3 5.1 5.3 4.1 4.8 5.0 5.3 7.7 6.6 9.2
8.3 8.5
12.1 10.3 10.8 9.4 10.9 10.6 10.9 8.9 9.3 8.1 8.2
S 0.2 1.8 0.8 0.8 0.5
0.7 0.7 0.7 0.4 0.5 0.6 1.4 1.2 0.4 0.2 0.4 0.3 0.3 0.3 0.3 0.4 0.3 1.1 1.4 1.5
0.7 0.9
0.9 1.2 0.9 1.4 1.1 0.9 0.8 1.1 0.7 0.7 0.9
kg CO2/GJ 92.18 88.05 88.31 88.40 89.16
88.38 91.33 91.33 91.54 90.92 90.22 87.71 88.09 91.08 92.18 88.62 92.13 92.11 91.83 92.12 91.59 92.15 88.34 89.36 88.46
88.32 88.28
88.94 88.19 88.84 88.13 88.66 88.88 88.24 89.00 88.69 88.67 88.27
ORISPL 3935 3936 6264
4140 4143 3992 4125 3982 4041 4042 6170 4050 4054 8023 4072 4078 4146 10234 10360 4271 10477
3845
54304
52152 54081
3796 3797 3803 3809 7213 10773 10774 52007 3788 10071 10377
CEM CEM CEM
CEM, 767 CEM CEM, 767 CEM, 767, 9 CEM CEM, 906 CEM, 906 CEM CEM CEM CEM CEM CEM, 906 CEM 767 767 CEM 767
CEM
767
767, 906 767
CEM CEM CEM, 906 CEM CEM CEM CEM CEM CEM 767 767
SOURCEM
eGRID consumed fuel 2005 (by destination)
2933 439 1300
181 346 188 138 68 1211 275 1235 770 200 1023 493 565 53 62 129 387 72
1782
258
155 230
254 1800 812 1257 848 71 71 140 514 115 115
NAMEPCAP
Delivered coal 2005 (by destination)
88.24 88.24 88.24
88.66 88.24 83.93 88.29 59.83 88.19 88.23 88.24 88.24 89.56 88.24 86.62 87.86 87.40 85.19 92.27 88.24 24.31
87.51
88.64
29.01 87.93
88.24 86.76 88.18 79.43 88.24 88.24 88.24 88.24 88.24 88.64 88.64
PLCO2RA
Table SA2a. Carbon dioxide emission factors for U.S. coal by destination state and power plant, 2005, Si units.
PLPRMFL
100 98 100 100 80 64 63 99 100 100 99 81 100 95 99 99 92 65 100 21 100 100 100
SUB BIT SUB BIT BIT BIT SUB BIT SUB SUB SUB SUB SUB SUB BIT SUB BIT SUB BLQ BIT BIT BIT
14 98
100 90 99 54 100 99 99 99 99 100 100
BIT BIT
BIT BLQ
BIT BIT BIT BIT BIT BIT BIT BIT BIT BIT
PLCLPR
notes
STATE Plant Philip Sporn Albright Rivesville Willow Island Kammer Mitchell Mt Storm North Branch Harrison Power Station Pleasants Power Station Fort Martin Power Station Grant Town Power Plant Morgantown Energy Facility PPG Natrium Plant WYOMING Wygen 1 Laramie River Station Laramie River Station 1 Laramie River Station 2 & 3 Dave Johnston Naughton Wyodak Jim Bridger Neil Simpson II
Data
12 35
39 12 12 28 12
FERC FERC FERC FERC FERC
160 146 52 41 14 41 106 20 250 62 145 117 24 38
n
EIA FERC
FERC FERC FERC FERC FERC FERC FERC FERC FERC FERC FERC, EI EIA EIA EIA
Mg 3,435,566 2,509,315 1,758,154 7,514,338 434,177
1,962,228 421,547 77,715 236,846 1,326,780 2,914,289 4,382,656 344,273 4,478,786 3,186,008 2,410,694 509,782 339,223 378,718 23,118,403 463,361 7,003,493
MJ/kg 19.20 23.34 18.56 21.72 18.69
27.92 27.67 28.22 24.96 30.34 28.34 28.15 22.64 28.36 28.87 29.22 17.68 18.52 28.13 20.47 18.65 19.42
Ash S52
5.3 4.8 7.1 10.2 6.3
11.9 14.7 12.2 6.4 7.1 11.8 14.6 29.3 12.9 9.0 8.7 35.6 38.9 11.5 7.0 6.5 5.2
S 0.4 0.9 0.6 0.6 0.5
1.0 1.7 0.9 1.0 1.5 1.1 1.8 2.9 3.6 4.3 1.7 2.0 2.3 1.2 0.5 0.5 0.3
kg CO2/GJ 92.10 89.54 91.98 91.36 92.03
88.46 88.08 87.62 89.31 87.54 88.29 89.13 88.63 86.80 86.68 87.45 87.56 87.19 88.33 91.53 92.02 b 92.13
ORISPL 55479 6204 6204.1 6204.2 4158 4162 6101 8066 7504
3938 3942 3945 3946 3947 3948 3954 7537 3944 6004 3943 10151 10743 50491 88 570 1140 817 707 362 2318 120
CEM CEM CEM CEM CEM CEM CEM
1106 278 110 213 713 1633 1681 80 2052 1368 1152 96 69 123 CEM
CEM CEM CEM CEM CEM CEM CEM, 906 CEM CEM CEM CEM 767 767 767
SOURCEM
eGRID consumed fuel 2005 (by destination) NAMEPCAP
Delivered coal 2005 (by destination)
88.25 88.24 88.24 88.11 88.24 88.24 87.48
88.24
88.24 88.24 88.24 88.24 88.24 88.24 88.24 88.24 88.24 88.24 88.24 89.54 89.10 81.64
PLCO2RA
Table SA2a. Carbon dioxide emission factors for U.S. coal by destination state and power plant, 2005, Si units.
99 100 99 98 100 99 100 100 100 100 100 100 100 90 100 100 100 100 100 100 100 97
SUB LIG LIG SUB SUB SUB SUB SUB
PLPRMFL BIT BIT BIT BIT BIT BIT BIT BIT BIT BIT BIT WC WC BIT
PLCLPR
notes
STATE Plant ALABAMA Charles R Lowman Barry Gadsden Gorgas Greene County E C Gaston James H Miller Jr Colbert (includes GRT coal) Widows Creek (includes GRT coal) Mobile Energy Services LLC ALASKA ARIZONA Apache Station Cholla Navajo Coronado Irvington (H Wilson Sundt Generating Springerville Abitibi Consolidated Snowflake ARKANSAS White Bluff Independence Flint Creek CALIFORNIA ACE Cogeneration Facility Stockton Cogen Argus Cogen Plant Port of Stockton District Energy Facility Mt Poso Cogeneration COLORADO Martin Drake Ray D Nixon Rawhide Arapahoe 37 20 12 56 17 12 12 69 18 24 12 39 23 11 20 26 23 12 16
FERC FERC FERC FERC FERC FERC EIA FERC FERC FERC EIA EIA EIA EIA EIA FERC FERC FERC FERC
Data
72 15 12 65 29 13 53 13 109 26
n
FERC FERC FERC FERC FERC FERC FERC FERC FERC EIA 10,097 9,795 9,788 10,863 9,298 10,936 9,307 9,938 8,731 8,588 8,921 8,636 12,027 12,171 11,774 12,031 11,896 12,092 9,864 10,711 9,073 8,855 8,816
20,433,610 1,489,400 3,682,000 8,246,800 3,186,200 376,842 3,090,700 361,668 12,266,802 5,227,833 4,959,100 2,079,869 1,629,699 323,448 152,991 826,713 162,909 163,638 18,510,647 1,055,790 986,620 1,196,614 549,547
tons
10,843 11,888 11,503 12,179 12,089 11,628 13,496 8,713 10,466 11,486 11,693
Btu/lb
34,893,823 1,988,445 4,067,400 252,350 3,242,850 1,390,040 4,484,893 11,167,140 3,623,114 4,565,202 112,390
Ash S53
11.7 8.1 14.5 9.6 9.3 11.2 17.9 13.2 4.8 5.1 4.5 4.5 10.6 10.7 11.0 11.1 8.1 10.6 7.7 9.3 5.1 5.3 5.5
8.6 8.5 5.5 13.0 13.0 14.3 13.8 4.9 7.1 11.4 7.4
S 0.6 0.5 0.5 0.5 0.4 0.5 0.9 0.4 0.3 0.3 0.2 0.2 0.8 0.8 0.6 0.9 0.6 0.9 0.4 0.5 0.2 0.2 0.3
1.0 1.1 0.5 1.8 1.3 1.5 1.7 0.3 0.7 2.0 0.9
lbs CO2 per million Btu 208.2 211.3 205.5 209.4 209.8 207.7 205.0 205.5 214.3 214.2 214.4 214.3 204.6 204.5 205.6 204.5 c 204.6 204.5 211.4 209.2 213.6 214.4 214.3
207.9 205.2 207.6 203.9 205.4 204.7 203.7 c 214.3 208.9 a 204.5 a 205.4
ORISPL 492 8219 6761 465
10002 10640 10684 54238 54626
6009 6641 6138
160 113 4941 6177 126 8223 50805
56 3 7 8 10 26 6002 47 50 50407
SOURCEM CEM CEM CEM CEM
767 767 767 767 767
CEM CEM CEM
CEM CEM CEM CEM CEM, 906 CEM 767
CEM CEM CEM CEM CEM CEM, 906 CEM CEM, 906 CEM 767
NAMEPCAP 257 279 651 160
108 60 55 54 62
1700 1700 558
661 1129 2409 822 559 1305 71
538 2671 138 1417 1288 2034 2822 1826 1969 79
205.1 204.9 204.2 205.2
210.8 207.0 206.0 206.1 209.4
205.2 205.2 205.2
201.8 205.2 205.2 205.2 177.5 205.2 210.2
205.2 191.5 205.2 205.2 202.4 205.2 205.2 205.2 205.2 88.8
PLCO2RA
eGRID consumed fuel 2005 (by destination)
96 100 100 100 68 100 95 100 100 100 75 60 100 100 68 99 100 99 100
SUB SUB SUB BIT BIT BIT BIT BIT BIT SUB SUB SUB
100 80 100 100 97 100 100 100 100 41
SUB SUB BIT SUB SUB SUB SUB
BIT BIT SC BIT SC SC SUB BIT BIT WDS
PLPRMFL
Delivered coal 2005 (by destination)
notes
Table SA2b. Carbon dioxide emission factors for U.S. coal by destination state and power plant, 2005, U.S. customary units.
PLCLPR
STATE Plant Cameo Cherokee Comanche Valmont Hayden Pawnee Nucla Craig CONNETICUT Bridgeport Station AES Thames DELEWARE Edge Moor Indian River Operations NRG Energy Center Dover FLORIDA Crystal River (McDuffie and IMT coal) Deerhaven Generating Station Crist Scholz Lansing Smith St Johns River Power Park Northside Generating Station C D McIntosh Jr Stanton Energy Center Big Bend (includes Davant coal) Polk (Davant coal) Seminole Jefferson Smurfit Fernandina Beach Central Power & Lime Cedar Bay Generating LP Indiantown Cogen Facility GEORGIA Atkinson Bowen 10 11 36 101 8 240 34 69 11 41 24 23 44 71 4 37 12 10 110 17 34 238
EIA EIA EIA EIA EIA FERC FERC FERC FERC FERC FERC FERC FERC FERC FERC FERC FERC EIA EIA EIA EIA FERC FERC
Data
13 32 14 29 35 14 12 80
n
FERC FERC FERC FERC FERC FERC FERC FERC
tons 274,455 2,360,526 2,437,534 633,116 1,831,931 1,850,514 415,300 4,918,700 1,925,193 1,376,789 548,404 2,273,862 544,682 1,687,760 41,420 25,301,085 6,104,241 606,316 2,283,800 185,000 1,045,000 2,706,330 342,200 695,000 2,029,200 3,652,561 435,629 2,743,879 249,899 324,391 981,730 915,909 38,840,407 1,264,000 8,657,200
Btu/lb 11,186 11,198 8,582 11,056 10,423 8,410 10,680 10,242 10,139 9,376 12,055 12,222 12,675 12,055 13,099 12,191 12,434 12,766 11,699 11,945 11,829 11,757 12,286 12,376 12,628 11,925 11,909 12,336 12,971 12,941 12,170 12,320 11,066 12,685 12,213
Ash S54
11.1 10.6 4.5 7.7 11.4 4.7 19.4 7.3 4.4 1.0 13.0 9.6 10.2 9.4 8.7 8.8 9.2 9.7 6.3 12.4 6.7 9.4 10.1 8.3 9.3 8.4 8.5 8.0 9.4 8.2 12.1 10.9 8.8 10.4 11.4
S 0.6 0.5 0.3 0.4 0.5 0.3 0.9 0.4 0.4 0.1 1.3 0.7 0.7 0.7 1.4 1.5 0.8 0.7 0.7 1.3 0.9 0.9 3.8 1.2 1.2 2.7 2.8 3.0 0.7 0.7 1.1 1.1 0.8 1.0 1.1
lbs CO2 per million Btu 206.4 208.2 214.3 209.4 208.4 214.3 215.2 211.5 211.0 213.5 206.1 207.4 207.9 207.3 204.9 205.0 205.6 205.4 206.9 204.2 206.1 206.1 201.9 205.5 204.8 204.0 203.9 202.2 205.3 205.4 205.2 205.1 207.5 204.6 204.7 a a c
a
ORISPL 703
628 663 641 642 643 207 667 676 564 645 7242 136 10202 10333 10672 50976
593 594 10030
568 10675
468 469 470 477 525 6248 527 6021
SOURCEM CEM, 906
CEM CEM CEM CEM CEM, 906 CEM CEM, 906 CEM, 906 CEM CEM, 906 CEM, CEM 767 767 767 767
CEM, 906 CEM, 906 CEM, 767
CEM, 906 767
CEM, 767 CEM CEM CEM, 906 CEM CEM CEM CEM
NAMEPCAP 3540
3333 471 1201 98 1002 1358 1407 994 929 1998 1030 1429 118 125 292 395
710 799 118
582 214
66 807 779 237 465 552 114 1339
205.2
205.2 196.2 205.1 205.2 173.5 205.2 197.2 189.6 205.2 205.1 243.3 205.2 73.1 206.1 205.6 205.0
190.6 205.2 194.8
204.5 206.1
205.2 204.7 204.9 205.2 205.2 204.7 205.3 205.2
PLCO2RA
eGRID consumed fuel 2005 (by destination)
63 99 81 71 84 100 100 53 76 15 70 98 97 89 74 32 99 99 99
BIT BIT BIT BIT BIT BIT BIT BIT BIT PC BIT BIT BIT BIT BIT BLQ BIT BIT BIT
100
98 100
SUB BIT
BIT
100 100 100 100 100 100 100 100
BIT BIT SUB BIT BIT SUB BIT SUB
PLPRMFL
Delivered coal 2005 (by destination)
notes
Table SA2b. Carbon dioxide emission factors for U.S. coal by destination state and power plant, 2005, U.S. customary units.
PLCLPR
STATE Plant Georgia Pacific Cedar Springs Hammond Harllee Branch Mitchell Yates Wansley Scherer Kraft McIntosh Savannah River Mill International Paper Savanna Mill SP Newsprint International Paper Augusta Mill HAWAII AES Hawaii IOWA Ames Electric Services Power Plant Streeter Station Fair Station 6th St Praire Creek 1-4 Sutherland Burlington Ottumwa Dubuque Earl F Wisdom Lansing Kapp Riverside Council Bluffs George Neal North George Neal South Louisa Muscatine Plant #1 Archer Daniels Midland Cedar Rapids
Data
12 11 18 10 8 20 25 26 40 17 13 10 16 38 52 28 20 46
FERC FERC FERC FERC FERC FERC FERC FERC FERC FERC FERC FERC FERC FERC FERC FERC EIA
72 88 16 100 184 97 20 15 8 24 62 16
n
EIA
FERC FERC FERC FERC FERC FERC FERC FERC EIA EIA EIA EIA
tons 2,105,050 1,135,342 1,103,369
938,570 847,250 424,410 3,488,320 5,961,860
1,875,830 3,708,490 250,700 2,763,500 4,749,000 13,617,400 851,900 433,100 41,307 314,523 131,769 181,688 706,185 706,185 21,439,529 330,000 102,455 181,153 102,370 1,027,900 518,940 733,160 2,220,520 218,860
Btu/lb 8,579 8,347 9,432
8,559 8,410 8,724 8,648 8,551
12,694 12,268 12,488 12,408 12,347 8,726 12,069 11,825 10,635 12,699 12,786 12,791 10,975 10,975 8,653 8,787 11,469 10,918 10,429 8,504 8,922 8,376 8,421 10,256
Ash S55
4.8 6.3 6.6
5.1 5.0 5.2 4.8 4.9
9.8 11.3 10.5 11.2 10.8 5.2 6.1 7.0 10.5 9.3 9.6 9.8 4.8 4.8 5.2 4.4 7.2 10.0 6.3 5.4 5.0 4.8 5.0 6.7
S 0.3 0.6 1.3
0.3 0.4 0.4 0.3 0.3
1.1 1.2 1.3 1.3 1.0 0.3 0.6 0.6 1.4 0.7 1.2 1.0 0.6 0.6 0.4 0.2 1.6 2.8 0.3 0.3 0.3 0.3 0.3 0.4
lbs CO2 per million Btu 214.3 214.0 209.1 c
213.6 214.2 214.2 214.3 214.2
204.5 204.6 204.4 204.9 205.3 214.3 206.8 206.9 206.5 205.4 204.7 205.3 208.6 208.6 213.7 214.4 206.2 203.5 212.6 214.2 214.0 214.2 214.3 209.7 1122 1131 1218 1058 1073 1077 1104 6254 1046 1217 1047 1048 1081 1082 1091 7343 6664 1167 10864
CEM CEM, 767 CEM, 767 CEM CEM, 767 CEM CEM, 906 CEM CEM, 906 CEM CEM, 906 CEM, 767 CEM, 767 CEM CEM CEM CEM CEM, 767 767
767
767 CEM CEM CEM, 906 CEM CEM, 906 CEM CEM, 906 CEM 767, 906 767 767, 906 767
ORISPL 10673
SOURCEM
54101 708 709 727 728 6052 6257 733 6124 10361 50398 54004 54358
NAMEPCAP 98 52 63 85 245 157 302 726 85 143 341 237 141 1779 1046 640 738 294 256
203
101 953 1746 289 1487 1957 3564 352 988 140 154 82 85
205.2 203.3 205.5 195.4 205.7 205.2 203.9 205.2 205.2 200.2 205.2 205.2 204.0 205.2 205.1 205.1 205.2 205.8 210.0
212.3
125.0 205.2 205.2 205.1 205.2 205.2 205.2 205.2 199.9 217.3 83.5 122.9 44.0
PLCO2RA
eGRID consumed fuel 2005 (by destination)
27 100 100 100 96 100 100 94 95 7 33 41 25 97 94 100 100 78 98 99 99 100 100 96 100 100 96 100 100 100 100 100 100
BIT BIT BIT BIT BIT BIT SUB BIT BIT PC BLQ SLW BLQ SUB SUB BIT BIT SUB SUB SUB SUB SUB SUB BIT SUB SUB SUB SUB SUB SUB SUB SUB BIT
PLPRMFL
Delivered coal 2005 (by destination)
notes
Table SA2b. Carbon dioxide emission factors for U.S. coal by destination state and power plant, 2005, U.S. customary units.
PLCLPR
STATE Plant ILLINOIS Edwards Duck Creek Marion Dallman Lakeside Joliet 29 Coffeen Hutsonville Meredosia Crawford Joliet 9 Joppa Steam Kincaid Generation LLC Powerton Waukegan Will County Fisk Street Baldwin Energy Complex Havana Hennepin Power Station Vermilion Wood River Newton Archer Daniels Midland Decatur Archer Daniels Midland Peoria A E Staley Decatur Cogen (Tate & Lyle Corn Products Illinois University of Illinois Abbott Power Plt INDIANA Frank E Ratts Merom Clifty Creek Harding Street Logansport 34 42 32 48 44 21 13 12 13 12 50 73 47 12 13 12 24 64 84 43
EIA EIA EIA EIA EIA EIA EIA EIA EIA EIA EIA EIA EIA EIA EIA EIA FERC FERC FERC FERC
Data
29 26 60 12 11 28 13 28 36 47 28
n
FERC FERC FERC FERC FERC EIA EIA EIA EIA EIA EIA
tons 3,673,529 5,704,654 2,897,815 3,277,787 849,499 7,134,660 1,905,771 1,158,971 269,155 1,852,756 4,268,505 1,944,053 196,384 387,187 337,464 68,086 53,348,600 556,300 3,013,780 4,874,100 1,646,648
51,769,514 2,860,513 864,337 1,304,195 1,116,479 112,549 2,787,992 2,302,198 437,686 759,928 1,764,600 1,532,761
Btu/lb 8,861 8,688 8,633 8,720 8,714 8,800 8,816 8,800 10,400 8,814 8,806 10,122 11,954 10,556 11,887 10,988 10,684 11,342 11,116 10,363 10,917
9,038 8,779 10,638 9,487 10,551 10,539 8,659 10,276 10,155 9,195 8,715 8,571
Ash S56
5.2 4.7 4.7 5.0 5.0 4.5 4.8 4.5 7.6 5.1 5.2 8.1 8.6 8.8 6.3 8.3 7.7 7.3 9.9 6.1 8.5
5.7 6.3 7.9 17.2 8.9 8.9 4.8 8.3 7.1 5.6 5.0 4.7
S 0.3 0.2 0.3 0.3 0.3 0.2 0.2 0.2 1.7 0.2 0.3 2.6 2.6 3.2 3.1 3.6 1.7 1.5 3.4 1.0 1.5
0.7 0.7 3.4 2.7 3.3 3.2 0.3 0.9 1.2 0.8 0.3 0.3
lbs CO2 per million Btu 214.3 214.3 214.3 214.3 214.3 214.4 213.5 214.4 204.1 214.4 214.3 205.9 c 204.1 203.8 204.4 203.4 206.7 205.4 203.2 209.2 204.1
212.3 213.7 203.5 203.4 203.8 203.8 214.3 205.5 208.0 212.0 214.3 214.3
ORISPL 1043 6213 983 990 1032
856 6016 976 963 964 384 861 863 864 867 874 887 876 879 883 884 886 889 891 892 897 898 6017 10865 10866 10867 54556 54780
SOURCEM CEM CEM CEM CEM 767, 906
CEM CEM CEM CEM CEM CEM CEM CEM, 906 CEM CEM, 906 CEM CEM CEM CEM CEM, 906 CEM CEM, 906 CEM CEM CEM CEM, 906 CEM CEM 767 767, 906 767 767, 906 767, 906
NAMEPCAP 233 1080 1303 1185 61
780 441 422 388 80 1320 1005 153 564 805 360 1100 1319 1786 915 1269 663 1892 718 306 197 650 1235 335 64 62 55 85
205.2 205.2 205.2 202.7 206.1
205.7 205.2 210.7 205.2 205.2 205.2 205.2 205.2 203.6 205.2 205.2 205.2 205.2 205.2 205.2 205.2 205.1 205.2 204.1 205.2 204.6 205.1 205.2 208.0 147.3 206.1 183.8 140.3
PLCO2RA
eGRID consumed fuel 2005 (by destination)
100 100 94 100 98 100 100 100 97 100 100 100 100 100 100 99 99 100 98 100 99 99 100 99 19 100 74 20 100 100 100 97 100
SUB BIT BIT BIT BIT SUB BIT SUB SUB SUB SUB SUB SUB SUB SUB SUB SUB SUB SUB SUB BIT SUB SUB BIT NG BIT BIT NG BIT BIT SUB BIT BIT
PLPRMFL
Delivered coal 2005 (by destination)
notes
Table SA2b. Carbon dioxide emission factors for U.S. coal by destination state and power plant, 2005, U.S. customary units.
PLCLPR
STATE Plant Eagle Valley AES Petersburg Tanners Creek Rockport Bailly Michigan City R M Schahfer Cayuga Edwardsport R Gallagher Wabash River Warrick Gibson Whitewater Valley F B Culley A B Brown State Line Energy KANSAS Riverton Quindaro Nearman Creek La Cygne Lawrence Tecumseh Jeffrey Energy Cnt Holcomb KENTUCKY Reid-Henderson II (Robert A Reid) East Bend Cooper Dale H L Spurlock E W Brown Ghent Green River 97 42 40 25 18 10 15 12 95 14 14 12 29 33 17 69 67 239 83 297 30
FERC FERC FERC FERC EIA FERC FERC FERC FERC FERC FERC FERC FERC EIA FERC FERC FERC FERC FERC FERC FERC
Data
15 58 101 161 33 27 99 56 18 68 32
n
FERC FERC FERC FERC FERC FERC FERC FERC FERC FERC FERC
tons 8,371,720 305,300 1,226,013 1,523,706 1,566,935 20,258,724 250,944 586,981 1,137,428 5,208,950 1,788,690 856,880 8,830,930 1,597,921 39,951,469 386,333 44,290 868,080 600,080 3,092,000 1,467,250 5,623,721 317,393
748,595 5,267,503 2,064,900 8,874,900 1,234,900 1,352,900 5,376,400 2,297,420 139,310 1,076,570 1,830,700
Btu/lb 11,216 11,530 11,228 11,107 9,387 8,568 8,827 8,727 7,992 8,762 8,835 8,832 8,420 8,627 11,555 11,744 12,058 12,103 12,205 11,899 12,488 11,737 12,219
10,879 11,331 11,844 9,322 12,018 9,578 10,450 11,155 11,177 11,868 10,865
Ash S57
8.8 8.4 10.5 10.2 4.1 5.3 4.8 5.2 5.3 6.0 5.4 5.4 4.9 5.4 11.0 9.9 10.8 11.2 10.2 12.6 10.4 10.4 9.0
8.6 8.5 9.4 6.4 6.7 5.8 6.6 7.1 7.7 9.2 8.8
S 1.9 2.0 3.5 3.0 0.3 0.4 0.3 0.4 0.4 0.6 0.3 0.3 0.4 0.4 2.1 2.9 2.8 1.4 0.9 1.7 1.6 1.3 2.5
1.2 3.0 1.1 0.4 2.9 0.7 1.7 1.4 1.8 2.2 1.6
lbs CO2 per million Btu 204.8 203.4 204.1 204.1 213.5 213.9 214.3 214.2 214.2 213.2 214.3 214.3 214.2 214.2 204.2 201.8 c 203.1 204.3 205.2 204.6 204.3 205.4 202.6
204.1 204.1 205.8 212.1 204.3 211.9 208.1 205.3 204.5 204.0 204.0
ORISPL 1383 6018 1384 1385 6041 1355 1356 1357
1239 1295 6064 1241 1250 1252 6068 108
991 994 988 6166 995 997 6085 1001 1004 1008 1010 6705 6113 1040 1012 6137 981
SOURCEM CEM, 906 CEM CEM CEM, 767 CEM CEM CEM CEM
CEM, 906 CEM, 906 CEM CEM CEM CEM, 906 CEM CEM
CEM, 906 CEM, 906 CEM CEM CEM, 906 CEM CEM, 906 CEM CEM CEM CEM, 906 CEM CEM CEM CEM CEM CEM
NAMEPCAP 195 669 344 216 1279 1720 2226 189
311 388 355 1578 566 290 2160 349
396 1881 1100 2600 641 680 2201 1193 144 600 1173 755 3340 94 415 707 614
204.8 205.2 205.2 205.4 194.2 193.2 205.2 205.2
203.3 203.8 205.2 205.2 205.1 205.1 205.2 205.0
205.1 205.2 205.2 205.2 205.1 205.2 204.9 204.8 205.2 205.2 206.5 205.1 205.2 205.2 205.2 203.7 205.2
PLCO2RA
eGRID consumed fuel 2005 (by destination)
100 100 100 100 100 99 98 100 100 99 96 100 100 100 100 98 99 99 97 100 100 100 100 100 100 98 100 100 100 100 87 100 100
BIT BIT BIT SUB BIT SUB BIT BIT BIT BIT BIT BIT BIT BIT BIT BIT SUB SUB SUB SUB SUB SUB SUB SUB SUB BIT BIT BIT BIT BIT BIT BIT BIT
PLPRMFL
Delivered coal 2005 (by destination)
notes
Table SA2b. Carbon dioxide emission factors for U.S. coal by destination state and power plant, 2005, U.S. customary units.
PLCLPR
STATE Plant Tyrone Cane Run Mill Creek Trimble County Elmer Smith Paradise (includes GRT coal) Shawnee (includes GRT coal) Big Sandy Kenneth C Coleman HMP&L Station Two Henderson R D Green D B Wilson LOUISIANA Dolet Hills Rodemacher R S Nelson Big Cajun 2 International Paper Louisiana Mill Gaylord Container Bogalusa MASSACHUSETTS Mount Tom Somerset Station Brayton Point Salem Harbor MARYLAND Brandon Shores C P Crane Herbert A Wagner Luke Mill R Paul Smith Power Station Chalk Point LLC Dickerson Morgantown Generating Plant AES Warrior Run Cogeneration Facility MAINE 24 24 12 69 24 4 17 15 97 26 82 24 37 42 98 74 23 51
FERC FERC FERC EIA EIA EIA FERC EIA EIA EIA EIA EIA EIA EIA EIA EIA EIA EIA
Data
30 43 112 83 35 70 95 145 50 34 67 62
n
FERC FERC FERC FERC FERC FERC FERC FERC EIA EIA EIA EIA
tons 187,232 1,611,087 1,298,076 2,725,683 742,743 257,194
191,171 1,772,483 4,614,838 1,861,291 1,129,760 6,569,848 4,243,667 2,940,520 1,338,666 581,890 1,150,498 1,157,689 12,023,871 2,193,995 621,559 2,019,200 7,137,624 38,166 13,327 5,034,551 448,874 262,060 3,255,315 1,068,302 11,743,740 3,370,707 751,234 1,056,978
Btu/lb 11,986 12,874 13,019 12,929 11,452 12,823
12,496 11,282 11,427 11,822 10,454 11,338 11,406 12,035 11,576 11,606 10,508 10,537 8,272 6,894 8,745 8,723 8,500 12,500 9,994 11,724 11,592 12,606 11,701 11,632 12,638 12,407 13,067 12,439
Ash S58
14.3 8.0 9.2 7.9 19.6 7.6
10.3 11.5 11.4 11.1 13.7 9.4 8.8 11.2 13.3 9.5 16.6 15.5 6.6 13.2 5.2 5.3 5.1 10.0 11.1 6.3 6.2 6.6 6.6 5.7 10.3 11.7 7.7 11.8
S 0.9 1.6 1.4 1.8 1.8 0.8
0.9 3.1 3.3 3.3 3.8 2.4 0.7 0.9 2.1 2.8 3.6 3.4 0.5 1.1 0.3 0.3 0.3 1.0 2.5 0.5 0.5 0.7 0.5 0.5 1.3 0.7 1.8 0.9
lbs CO2 per million Btu c
c
a a
c c
210.0 204.9 c 204.9 207.0 c 210.3 205.5
204.5 202.7 202.4 202.1 204.7 203.2 207.2 206.1 203.9 202.9 201.6 201.6 214.3 215.0 214.1 214.3 214.3 205.2 205.7 207.2 208.0 205.8 207.1 207.5 206.0 205.7 203.4 205.9
ORISPL 602 1552 1554 50282 1570 1571 1572 1573 10678
1606 1613 1619 1626
51 6190 1393 6055 54090 54427
1361 1363 1364 6071 1374 1378 1379 1353 1381 1382 6639 6823
SOURCEM CEM CEM, 906 CEM, 906 767, CEM CEM CEM CEM, 906 767
CEM CEM CEM, 906 CEM
CEM CEM CEM, 767 CEM 767 767
CEM CEM, 906 CEM CEM CEM CEM CEM CEM CEM CEM CEM CEM
NAMEPCAP 1370 416 1059 65 110 2647 930 1548 229
136 199 1611 805
721 1004 1597 1871 59 100
137 661 1717 1760 445 2558 1750 1097 521 365 528 440
205.2 205.1 198.7 121.7 205.2 183.8 201.2 203.6 206.1
205.2 201.3 202.0 196.7
217.7 191.4 193.5 205.2 40.8 11.8
205.2 205.2 205.2 197.3 205.2 205.2 205.2 205.2 205.2 205.2 205.2 205.2
PLCO2RA
eGRID consumed fuel 2005 (by destination)
99 99 100 93 99 100 100 100 99 63 59 53 100 80 53 100 0 1 100 94 94 81 100 99 80 61 99 58 92 97 100
BIT BIT BIT BIT BIT BIT BIT BIT SC BIT BIT PC LIG SUB SUB SUB BLQ WDS BIT BIT BIT BIT BIT BIT BIT BIT BIT BIT BIT SC BIT
PLPRMFL
Delivered coal 2005 (by destination)
notes
Table SA2b. Carbon dioxide emission factors for U.S. coal by destination state and power plant, 2005, U.S. customary units.
PLCLPR
STATE Plant Rumford Cogeneration S D Warren Westbrook MICHIGAN B C Cobb Dan E Karn J H Campbell J C Weadock J R Whiting Harbor Beach Monroe River Rouge S D Warren Muskegon St Clair Trenton Channel Belle River J B Sims James De Young Marysville Eckert Station Erickson Station Shiras Endicott Station Presque Isle Wyandotte White Pine Electric Power Escanaba Paper Company T B Simon Power Plant TES Filer City Station MINNESOTA Syl Laskin Clay Boswell Black Dog High Bridge Allen S King Riverside
Data
26 36 155 79 50 13 126 58 60 67 38 12 7 23 21 14 28 39 18 12 24 69 40 12 36 12 12 22 12
FERC FERC FERC FERC FERC FERC FERC FERC FERC FERC FERC EIA EIA EIA EIA FERC FERC FERC FERC FERC FERC
13 12
n
FERC FERC FERC FERC FERC FERC FERC FERC
EIA EIA
tons 999,617 644,524 216,068 191,871 2,216,550 194,966 74,910 182,499 249,183 204,477 20,076,848 455,000 4,379,960 946,810 705,720 1,298,150 1,163,800
4,586,000 2,220,000 3,850,000 187,498 151,000
145,598 111,596 36,555,363 1,067,800 1,348,700 4,794,200 1,693,700 1,317,800 189,000 8,585,000 1,390,000
Btu/lb 8,910 8,988 9,858 11,942 10,540 11,068 13,465 12,447 12,816 10,486 8,908 9,393 9,019 8,847 8,910 8,885 8,925
9,754 10,352 9,364 11,586 12,115
12,944 12,664 10,071 9,779 8,837 10,132 10,789 9,466 12,406 10,393 9,996
Ash S59
5.3 5.6 4.3 10.6 7.2 8.4 8.9 9.4 9.0 6.0 6.6 4.3 6.7 4.4 4.4 5.4 4.3
4.7 5.8 4.3 8.2 9.3
6.9 8.6 6.2 7.9 5.2 6.7 8.6 6.3 8.1 6.3 7.1
S 0.3 0.3 0.4 3.4 0.5 0.8 1.6 0.7 1.4 0.7 0.4 0.4 0.5 0.2 0.2 0.3 0.2
0.6 0.7 0.3 2.1 0.9
0.8 0.8 0.6 0.6 0.3 0.5 0.7 0.4 0.6 0.7 0.5
lbs CO2 per million Btu 214.0 213.7 212.2 202.8 209.2 207.6 204.1 205.6 205.1 209.1 213.7 213.5 213.6 214.4 214.4 214.2 214.4
212.3 209.7 213.6 203.1 207.8
205.6 205.5 210.8 210.9 214.3 210.3 208.5 212.1 207.2 210.2 210.8
ORISPL 1891 1893 1904 1912 1915 1927
1695 1702 1710 1720 1723 1731 1733 1740 50438 1743 1745 6034 1825 1830 1732 1831 1832 1843 4259 1769 1866 10148 1771 10328 50835
10495 50447
SOURCEM CEM CEM CEM CEM CEM CEM
CEM CEM CEM CEM, 906 CEM, 906 CEM, 906 CEM, 906 CEM, 906 767 CEM, 906 CEM CEM CEM CEM, 767 906 CEM CEM CEM, 767 CEM CEM, 767 CEM 767 767, 906 767 767
767 767
NAMEPCAP 116 1073 619 277 598 404
520 1946 1559 331 364 125 3293 944 51 1571 776 1664 65 63 150 375 155 78 58 625 78 60 50 99 70
103 71
205.2 205.3 194.4 205.2 205.2 205.2
205.2 205.2 205.3 205.2 205.2 205.2 206.1 204.8 202.3 198.6
202.6 194.2 205.2 205.2 205.2 205.2 205.2 202.9 185.5 205.2 205.2 203.3 205.2 205.8
111.4 89.4
PLCO2RA
eGRID consumed fuel 2005 (by destination)
23 37 96 83 100 99 100 99 100 98 66 99 100 98 100 100 100 100 100 100 98 100 85 100 84 96 77 100 100 75 96 84 92
BIT WDS SUB SUB SUB SUB SUB BIT BIT BIT BIT SUB BIT SUB BIT BIT BIT SUB SUB SUB BIT BIT BIT BIT BIT BIT BIT SUB SUB SUB SUB SUB SUB
PLPRMFL
Delivered coal 2005 (by destination)
notes
Table SA2b. Carbon dioxide emission factors for U.S. coal by destination state and power plant, 2005, U.S. customary units.
PLCLPR
STATE Plant Sherburne County Hoot Lake M L Hibbard Silver Lake Taconite Harbor Energy Center Silver Bay Power MISSOURI New Madrid Thomas Hill Chamois Columbia Asbury Blue Valley Hawthorn Montrose Iatan Sibley Sikeston Power Station James River Power Station Southwest Power Station Lakeroad Marshall Labadie Meramec Sioux Rush Island University of Missouri Columbia Henderson MISSISSIPPI Jack Watson Victor J Daniel Jr R D Morrow Red Hills Generating Facility MONTANA Lewis and Clark 19 10 7 12 12 44 10 25 26 45 34 36 41 11 20 18 36 87 50 62 58 12
33 62 30 12 14
FERC EIA EIA FERC FERC FERC FERC FERC FERC FERC FERC FERC FERC FERC FERC FERC FERC FERC FERC FERC FERC EIA
FERC FERC FERC EIA FERC
Data
84 12
n
FERC FERC
tons
Btu/lb
10.9 7.1 7.9 11.9 15.6 9.1 8.5
8,993 11,320 10,591 12,524 5,096 8,449 6,787 10,144,993 1,858,820 3,531,310 1,152,061 3,602,802 11,403,652 267,800
S60
5.2 5.1 5.6 5.2 8.0
7.3 4.1 5.3 5.2 4.5 4.5 5.7 7.3 6.2 13.3 5.2 5.5 5.0 6.2 5.3 5.2 4.5 6.1
7.8 4.7
8,743 8,832 9,526 8,420 10,870
11,686 9,451 8,867 8,852 8,793 8,882 9,303 13,335 9,396 10,725 8,630 8,748 8,536 9,525 8,847 8,872 8,907 9,547
8,719 9,261
Ash
9,829,646 3,637,349 3,457,929 5,030,492 147,086
162,300 824,793 474,248 43,198,712 4,235,550 4,145,460 281,506 44,171 548,060 207,805 2,006,820 2,034,420 2,730,440 1,390,540 1,092,938 1,128,700 770,100 479,700
9,080,709 585,358
S 0.6 0.7 0.4 1.2 0.5 0.7 0.5
0.3 0.3 0.8 0.3 3.6
1.0 0.3 0.2 0.4 0.2 0.2 1.0 1.4 0.9 2.9 0.3 0.4 0.3 0.5 0.3 0.2 0.2 0.4
0.5 0.4
lbs CO2 per million Btu 210.9 207.3 209.5 205.0 222.3 213.9 220.5
214.3 214.3 211.4 214.2 203.4
205.1 213.5 213.5 213.7 214.4 214.4 211.4 205.0 210.8 203.7 214.2 214.2 214.2 211.6 214.3 214.4 214.4 211.9
213.6 213.5
ORISPL 6089
2049 6073 6061 55076
2167 2168 2169 2123 2076 2132 2079 2080 6065 2094 6768 2161 6195 2098 2144 2103 2104 2107 6155 50969 2062
6090 1943 1897 2008 10075 10849
SOURCEM CEM
CEM, 906 CEM CEM CEM,
CEM CEM CEM, 767 CEM, 906 CEM CEM, 767, 9 CEM CEM CEM CEM CEM CEM, 767 CEM, 906 CEM, 767, 9 767, 906, CEM CEM, 906 CEM CEM 767, 906 767, 906
CEM CEM CEM, CEM, 767 CEM 767
NAMEPCAP 50
1216 2229 400 514
1200 1135 59 95 232 176 1071 564 726 524 261 451 303 273 57 2389 1041 1099 1242 91 59
2129 138 73 99 252 132
217.4
203.9 187.7 205.2 217.4
205.2 205.2 205.5 205.0 205.2 203.8 198.1 205.2 205.2 205.2 212.2 206.0 205.0 202.7 198.7 205.2 205.1 205.2 205.2 198.3 204.6
205.2 205.2 206.8 202.1 205.1 213.6
PLCO2RA
eGRID consumed fuel 2005 (by destination)
99 72 100 100 100
LIG
100 100 100 100 99 97 90 99 100 99 100 99 100 98 93 100 99 99 100 87 96
SUB SUB SUB BIT SUB BIT SUB SUB SUB SUB SUB SUB SUB SUB BIT SUB SUB SUB SUB BIT BIT BIT BIT BIT LIG
100 100 76 95 100 98
SUB SUB SUB BIT SUB SUB
PLPRMFL
Delivered coal 2005 (by destination)
notes
Table SA2b. Carbon dioxide emission factors for U.S. coal by destination state and power plant, 2005, U.S. customary units.
PLCLPR
STATE Plant Colstrip J E Corette Plant NORTH CAROLINA Asheville Cape Fear Lee Roxboro L V Sutton W H Weatherspoon Mayo G G Allen Buck Cliffside Dan River Marshall Riverbend Belews Creek Cogentrix Southport (Primary Energy Cogentrix Roxboro (Primary Energy Cogentrix Dwayne Collier Battle Cogen (Edgecombe Genco LLC) Weyerhaeuser Plymouth NC Canton North Carolina Westmoreland-LG&E Roanoke Valley I Roanoke Valley Energy Facility II NORTH DAKOTA Leland Olds Antelope Valley Coal Creek Milton R Young Heskett Coyote Stanton NEBRASKA Lon Wright Whelan Energy Center
Data
12 36 44
20 12 12 24 36 24 12 18 35
FERC FERC FERC FERC FERC FERC FERC FERC FERC
67 48 23 221 68 23 107 216 52 135 19 298 68 357 25 30 13
48 22
n
EIA EIA EIA
FERC FERC FERC FERC FERC FERC FERC FERC FERC FERC FERC FERC FERC FERC EIA EIA EIA
EIA EIA
tons
12,715 13,000 12,480 6,679 6,812 6,577 6,251 6,664 7,833 6,933 9,314 8,570 8,846 8,264
25,388,575 3,986,900 5,461,500 7,723,000 4,376,766 538,600 2,483,000 818,809 12,289,527 356,680 398,781
8,496 8,375 12,325 12,575 12,311 12,410 12,435 12,545 12,218 12,375 11,719 11,569 12,239 12,748 12,341 12,226 12,270 12,965 13,241 13,073
Btu/lb
284,785 412,310 636,851
10,485,394 650,458 30,281,116 980,925 816,804 874,005 6,511,708 1,309,449 376,659 2,148,052 2,598,000 665,000 1,629,000 324,000 3,396,000 805,000 5,771,000 227,713 83,802 430,053
Ash S61
9.4 8.2 9.1 11.2 8.5 8.1 9.0 5.3 4.9 5.1 5.4
9.2 7.2 11.1
9.4 4.5 11.5 11.2 11.8 9.9 10.9 9.3 11.9 10.9 15.2 15.5 12.0 10.1 11.5 11.6 12.2 8.2 7.3 7.6
S 0.7 0.6 0.6 0.6 0.8 0.7 1.0 0.3 0.3 0.3 0.4
0.7 1.0 1.3
0.7 0.2 0.9 0.8 0.9 0.8 0.9 0.8 1.1 0.7 0.9 0.7 1.0 0.7 0.9 0.9 0.9 0.8 0.8 0.7
lbs CO2 per million Btu 217.8 218.3 219.0 216.0 219.3 217.7 218.8 213.6 214.3 214.3 214.2
205.8 204.0 204.6
213.7 214.3 205.6 205.4 205.8 205.8 205.7 205.6 205.3 205.9 206.0 206.3 205.3 206.1 205.1 205.0 205.9 205.3 204.9 205.5
ORISPL 2240 60
2817 6469 6030 2823 2790 8222 2824
50189 50244 54035 54755
2706 2708 2709 2712 2713 2716 6250 2718 2720 2721 2723 2727 2732 8042 10378 10379 10384
6076 2187
SOURCEM CEM, 767 CEM
CEM CEM CEM CEM CEM, 767 CEM CEM
767 767 767 767
CEM CEM, 906 CEM CEM CEM, 906 CEM, 906 CEM CEM CEM, 906 CEM CEM, 906 CEM CEM, 906 CEM 767 767 767
CEM CEM
NAMEPCAP 170 76
656 870 1212 734 115 450 190
154 53 182 58
837 431 508 2575 763 342 736 1155 474 781 388 1996 601 2160 135 68 115
2272 173
205.0 205.4
217.7 217.7 217.7 217.7 216.5 217.7 205.2
46.7 206.1 206.1 206.1
200.9 205.1 200.7 205.2 205.1 205.0 205.2 205.2 205.0 205.2 204.7 205.2 204.9 205.2 197.7 185.0 206.1
205.2 205.2
PLCO2RA
eGRID consumed fuel 2005 (by destination)
100 100 100 100 100 100 100 98 100
LIG LIG LIG LIG LIG LIG SUB SUB SUB
26 51 100 100
94 100 100 100 100 100 100 100 100 100 100 100 100 100 90 82 100
BIT BIT BIT BIT BIT BIT BIT BIT BIT BIT BIT BIT BIT BIT BIT BIT BIT WDS BIT BIT BIT
100 100
SUB SUB
PLPRMFL
Delivered coal 2005 (by destination)
notes
Table SA2b. Carbon dioxide emission factors for U.S. coal by destination state and power plant, 2005, U.S. customary units.
PLCLPR
STATE Plant Sheldon Gerald Gentleman North Omaha Nebraska City Platte NEW HAMPSHIRE Merrimack Schiller NEW JERSEY B L England Howard Down Deepwater PSEG Hudson Generating Station PSEG Mercer Generating Station Logan Generating Plant Chambers Cogeneration LP NEW MEXICO Four Corners San Juan Escalante NEVADA Reid Gardner North Valmy Mohave NEW YORK S A Carlson Rochester 7 Danskammer Generating Station AES Westover AES Greenidge LLC AES Cayuga C R Huntley Generating Station Dunkirk Generating Station Lovett AES Somerset LLC 48 19 31 10 9 12 12 80 24 11 18 12 43 34 12 51 54 32 30 33 16 37 50 38 51
FERC FERC FERC FERC EIA EIA EIA EIA EIA FERC FERC FERC FERC FERC FERC FERC FERC EIA EIA EIA EIA EIA EIA EIA EIA
Data
12 46 12 25 13
n
FERC FERC FERC FERC FERC
tons 974,742 5,791,124 1,887,300 2,438,900 442,000 1,715,904 886,140 829,764 4,639,543 566,951 43,130 144,434 1,291,728 1,068,015 660,205 865,080 19,660,030 8,170,000 10,352,530 1,137,500 7,910,269 1,561,311 1,787,958 4,561,000 9,563,839 84,480 472,083 889,054 349,060 390,828 890,470 1,366,349 1,788,117 683,774 1,600,148
Btu/lb 8,595 8,561 8,683 8,518 8,482 12,995 13,192 12,784 12,646 12,956 12,896 12,333 12,500 12,500 12,580 12,931 9,334 8,805 9,767 9,197 11,190 12,088 10,897 10,997 11,832 12,334 13,109 12,807 12,946 13,092 12,898 9,454 9,679 12,954 12,994
Ash S62
4.4 4.6 5.4 5.1 5.1 7.3 7.0 7.7 9.5 8.0 6.9 11.7 10.3 10.3 10.6 7.5 20.5 21.8 19.7 18.4 10.0 9.1 11.2 9.9 7.4 11.2 8.6 7.0 8.7 8.0 8.2 5.5 5.6 9.3 8.1
S 0.3 0.3 0.4 0.3 0.3 1.2 1.5 0.8 1.1 2.0 0.7 0.7 0.8 0.8 1.1 1.8 0.8 0.8 0.8 0.8 0.5 0.7 0.5 0.5 1.4 1.8 1.8 0.6 2.0 1.9 2.2 0.5 0.6 0.6 2.9
lbs CO2 per million Btu 214.3 214.3 214.2 214.2 214.3 204.9 204.3 205.5 204.9 204.1 205.6 205.4 205.4 205.4 206.1 203.1 208.2 208.3 208.4 205.1 208.2 205.5 207.5 209.4 206.1 204.0 203.7 205.8 203.3 203.3 203.7 212.1 210.9 205.4 203.1
ORISPL 2682 2642 2480 2526 2527 2535 2549 2554 2629 6082
2324 8224 2341
2442 2451 87
2378 2434 2384 2403 2408 10043 10566
2364 2367
2277 6077 2291 6096 59
SOURCEM CEM, CEM CEM CEM CEM CEM CEM CEM CEM CEM
CEM CEM CEM
CEM CEM CEM
CEM, 906 767 CEM, 906 CEM CEM, 906 767 767
CEM, 906 CEM, 906
CEM CEM CEM CEM CEM
NAMEPCAP 101 253 537 119 163 323 816 627 449 655
612 521 1636
2270 1848 257
484 71 174 1114 768 242 285
496 171
229 1363 645 652 110
202.2 205.2 200.1 205.2 205.2 205.2 205.2 205.7 203.2 205.2
204.9 205.2 205.1
204.9 205.2 205.2
201.2 201.3 239.9 198.5 199.7 206.0 206.1
205.2 204.1
205.2 205.2 204.6 205.2 205.2
PLCO2RA
eGRID consumed fuel 2005 (by destination)
100 100 99 100 100 100 98 94 85 89 93 95 100 100 100 100 100 100 100 100 94 100 91 100 99 100 100 100 98 79
SUB SUB SUB SUB SUB BIT BIT BIT BIT BIT BIT BIT BIT BIT SUB SUB SUB BIT BIT BIT BIT BIT BIT BIT BIT BIT SUB SUB BIT BIT
PLPRMFL
Delivered coal 2005 (by destination)
notes
Table SA2b. Carbon dioxide emission factors for U.S. coal by destination state and power plant, 2005, U.S. customary units.
PLCLPR
STATE Plant Kodak Park Site Black River Generation WPS Power Niagara (Niagara Generating Trigen Syracuse Energy OHIO Ashtabula Bay Shore Eastlake Lake Shore R E Burger W H Sammis Cardinal Walter C Beckjord Miami Fort W H Zimmer Conesville Dover Picway O H Hutchings J M Stuart Killen Station Hamilton Muskingum River General James M Gavin Kyger Creek Orrville Painesville Richard Gorsuch Avon Lake Niles MW Custom Papers (P H Glatfelter Co Chillicothe Facility) OKLAHOMA GRDA Muskogee
Data
53 63 105 39 42 162 205 233 225 137 68 59 18 186 100 32 38 43 143 12 24 36 61 13 36
44 57
FERC FERC FERC FERC FERC FERC FERC FERC FERC FERC FERC EIA EIA EIA
FERC FERC
30 9 59 12
n
EIA EIA EIA EIA EIA EIA FERC FERC FERC FERC FERC
EIA EIA EIA EIA
tons
11,636 12,622 11,628 11,893 12,162 13,009 12,455 11,972 12,944 12,277 10,435 12,737 12,150 11,242 8,765 8,427 8,790
21,335,042 4,106,875 5,590,941
13,067 13,254 10,675 13,282 11,620 8,878 8,840 10,943 8,861 11,000 10,672 12,195 11,781 11,869 12,231 11,707
Btu/lb
133,000 268,300 5,793,700 1,727,200 165,723 2,992,700 7,624,020 3,328,900 197,040 129,650 641,968 1,461,553 482,622 307,477
668,136 124,529 95,163 161,648 59,026,967 1,073,125 1,870,765 4,094,953 599,253 847,243 7,608,365 4,708,800 2,719,920 2,661,350 3,641,540 3,947,800
Ash S63
5.9 5.0 5.0
8.5 8.8 13.9 13.1 11.6 7.7 9.0 8.7 10.3 7.3 13.9 8.7 11.8 11.7
8.1 8.1 20.6 6.6 9.9 5.4 5.5 6.4 5.1 7.5 9.1 11.6 13.1 11.4 10.2 10.4
S 0.4 0.3 0.2
2.6 0.9 0.9 0.6 1.3 2.7 3.6 1.3 4.2 3.1 2.0 1.6 3.3 4.2
1.6 2.0 2.0 0.8 1.8 0.3 0.3 1.1 0.3 1.1 0.6 1.3 1.2 1.4 3.7 2.9
lbs CO2 per million Btu b b b b b b
213.9 214.2 214.4
203.7 205.4 205.7 c 205.7 c 204.8 202.4 202.6 205.7 200.3 201.9 206.0 203.8 203.8 204.0
204.6 202.7 204.2 205.1 205.3 214.1 214.3 207.3 214.3 207.5 208.5 205.0 205.0 204.9 202.0 203.0
ORISPL 165 2952
2835 2878 2837 2838 2864 2866 2828 2830 2832 6019 2840 2914 2843 2848 2850 6031 2917 2872 8102 2876 2935 2936 7286 2836 2861 10244
10025 10464 50202 50651
SOURCEM CEM CEM
CEM CEM, 906 CEM, 906 CEM, 906 CEM, 906 CEM, 906 CEM CEM, 906 CEM, 906 CEM CEM 767, 906 CEM CEM, 906 CEM, 906 CEM, 906 CEM, 767, 9 CEM CEM CEM 767 767 CEM CEM, 906 CEM, 906 767
767 767 CEM 767
NAMEPCAP 1010 1889
256 655 1289 260 548 2468 1880 1433 1444 1426 2175 54 106 447 2452 687 138 1529 2600 1086 85 54 200 870 293 93
201 56 56 101
204.7 204.1
204.5 207.4 205.2 205.2 205.2 205.2 205.2 205.0 205.2 205.2 205.2 202.4 205.2 205.7 205.2 205.1 204.1 205.2 205.2 205.2 206.0 205.8 205.2 205.2 205.2 118.4
197.8 201.2 219.2 206.1
PLCO2RA
eGRID consumed fuel 2005 (by destination)
SUB SUB
100 99
100 75 100 100 100 100 100 100 100 100 100 97 99 97 100 100 98 100 100 100 100 100 99 100 100 54
SUB SUB BIT SUB BIT BIT BIT BIT BIT BIT BIT BIT BIT BIT BIT SC BIT BIT BIT BIT BIT BIT BIT BIT BIT BIT
90 63 46 87
BIT BIT BIT BIT
PLPRMFL
Delivered coal 2005 (by destination)
notes
Table SA2b. Carbon dioxide emission factors for U.S. coal by destination state and power plant, 2005, U.S. customary units.
PLCLPR
STATE Plant Sooner Northeastern Hugo Muskogee Mill AES Shady Point OREGON Boardman PENNSYLVANIA Bruce Mansfield Hatfield (Hatfields Ferry Power Station) Elrama Power Plant Portland Titus Conemaugh Homer City Station Shawville St Nicholas Cogen Project Keystone New Castle Plant PPL Brunner Island PPL Martins Creek PPL Montour Sunbury (WPS Energy Servs Sunbury Cromby Generating Station Eddystone Generating Station Hunlock Power Station Armstrong Power Station Mitchell Power Station Cheswick Power Plant John B Rich Memorial Power Station Colver Power Project Ebensburg Power Cambria Cogen AES Beaver Valley Partners Beaver Valley Kline Township Cogen Facility 101 196 16 21 25 24 175 149 24 70 24 9 24 267 35 62 71 98 52 45 12 12 12 12 21 59
EIA EIA EIA EIA EIA EIA EIA EIA EIA EIA EIA EIA EIA EIA EIA EIA EIA EIA EIA EIA EIA EIA EIA EIA EIA EIA
11
FERC
Data
43 18 24 23 114
n
FERC FERC FERC EIA EIA
tons 5,025,483 572,034 3,923,016 343,292 4,063,125 1,016,886 308,642 1,189,775 167,687 807,805 763,022 1,052,426 664,949 662,393 513,403 603,488 468,348 515,378
3,637,715 4,180,908 1,900,193 504,434 1,413,976 2,273,214 2,273,214 52,500,923 7,454,469 3,514,547 731,812 824,140 528,909 4,877,203 7,642,684 1,429,698
Btu/lb 12,780 12,670 12,664 12,414 12,567 10,057 13,270 13,150 8,875 12,271 12,236 12,732 6,868 6,792 6,088 7,349 13,108 5,196
8,782 8,688 8,375 9,409 10,117 8,356 8,356 11,859 12,573 12,862 12,946 13,092 13,044 12,548 11,800 12,000
Ash S64
9.8 8.1 9.4 10.6 10.8 21.5 6.8 7.1 29.5 11.5 10.9 9.6 41.9 38.5 44.6 46.1 8.5 49.5
5.0 5.5 4.8 5.7 17.0 4.9 4.9 14.3 10.2 8.6 7.2 7.3 7.6 11.4 16.5 13.8
S 1.9 1.6 1.5 1.7 1.8 1.2 1.8 1.7 0.9 2.0 3.8 1.7 0.4 2.2 1.6 3.2 2.3 0.3
0.2 0.4 0.3 0.4 1.8 0.3 0.3 2.1 2.9 2.3 1.6 1.8 1.5 2.5 2.4 1.8
lbs CO2 per million Btu 203.9 203.7 204.4 204.2 204.0 210.0 204.5 204.2 222.6 203.5 202.0 204.0 231.9 203.8 206.5 203.8 202.5 234.1
c
c
c
c
214.4 214.1 214.3 211.8 210.1 214.2 214.2 204.9 202.3 b 203.8 204.0 c 203.1 203.8 203.0 c 205.5 206.2
ORISPL 6094 3179 3098 3113 3115 3118 3122 3131 54634 3136 3138 3140 3148 3149 3152 3159 3161 3176 3178 3181 8226 10113 10143 10603 10641 10676 50039
6106
6095 2963 6772 10362 10671
SOURCEM CEM CEM CEM CEM CEM, 906 CEM, 906 CEM CEM, 906 767 CEM, 906 CEM, 906 CEM, 906 CEM, 906 CEM CEM, 906 CEM, 906 CEM, 906 CEM CEM CEM CEM 767 767 767 767 767 767
CEM
CEM CEM CEM 767 767
NAMEPCAP 2741 1728 510 621 261 1883 2012 632 99 1884 354 1567 2113 1642 491 420 1569 50 326 374 637 88 118 58 98 149 58
601
1138 1951 446 114 350
205.2 205.2 205.2 203.9 205.2 205.2 205.2 205.2 208.2 205.2 205.2 205.2 179.2 205.2 215.7 190.8 193.4 214.6 205.2 205.1 204.9 208.2 208.1 208.2 208.2 206.3 208.2
205.2
205.1 178.0 205.2 212.0 206.1
PLCO2RA
eGRID consumed fuel 2005 (by destination)
100 55 100 100 100 100 100 100 99 97 100 100 100 100 99 100 100 100 23 100 100 67 68 84 100 100 100 100 100 100 100 99 99
SUB SUB SUB SUB BIT SUB BIT BIT BIT BIT BIT SC BIT BIT WC SC BIT SC RFO SC BIT BIT BIT BIT BIT BIT BIT WC WC WC WC BIT WC
PLPRMFL
Delivered coal 2005 (by destination)
notes
Table SA2b. Carbon dioxide emission factors for U.S. coal by destination state and power plant, 2005, U.S. customary units.
PLCLPR
STATE Plant G F Weaton Power Station P H Glatfelter Chester Operations Panther Creek Energy Facility Northhampton Generating LP Scrubgrass Generating Seward SOUTH CAROLINA H B Robinson W S Lee Canadys Steam Cogen South McMeekin Urquhart US DOE Savannah River Site (D Area) Wateree Williams Cope Cross Dolphus M Grainger Jefferies Winyah Ben French Stone Container Florence Mill SOUTH DAKOTA Big Stone TENNESSEE Bull Run Cumberland Gallatin (includes GRT coal) John Sevier Kingston (includes GRT coal) Allen Steam Plant (includes Cora and GRT coal) Johnsonville (GRT coal) 85 75 5 28 162 35
FERC FERC FERC FERC FERC FERC FERC
27
FERC
160 54 57 85 23 48 103
FERC FERC FERC FERC FERC FERC FERC 12
20 27
FERC FERC
EIA
40 47 44
FERC FERC FERC
Data
14 23 24 76 47 94
n
EIA EIA EIA EIA EIA EIA
3,887,896
199,223 1,738,000 1,738,000 27,627,342 2,469,810 6,409,870 3,972,272 2,029,320 4,282,774 2,751,186
3,067,700 1,524,400 597,000 3,151,619 443,197 753,783 3,355,819
207,200 390,200
10,363
12,679 8,711 8,711 11,306 12,383 11,867 10,432 12,461 11,111 10,020
12,572 12,763 12,522 12,855 12,414 12,464 12,357
12,783 12,869
12,597 12,302 12,449 12,688
15,758,714 458,273 583,000 1,027,300
tons
9,442 13,000 5,755 6,597 6,397 7,480
Btu/lb
327,895 326,496 255,894 756,237 560,642 609,145
Ash S65
7.1
8.1 5.4 5.4 8.7 11.1 9.0 7.3 11.9 9.5 6.5
10.2 8.6 10.4 9.4 10.3 10.4 11.1
8.2 8.1
10.0 11.9 10.9 9.1
7.2 6.9 39.8 37.2 39.4 37.9
S 0.7
0.9 0.3 0.3 1.2 0.7 3.0 0.7 0.7 0.7 0.5
1.0 0.9 1.1 1.8 1.3 1.4 1.2
1.2 1.3
1.2 1.2 0.9 1.2
0.4 1.8 0.6 0.3 0.5 2.4
lbs CO2 per million Btu 209.2 a
205.1 214.3 214.3 206.6 205.3 203.2 209.0 a 205.2 207.9 a 210.4 a
204.7 204.8 204.5 203.8 c 204.6 c 204.6 c 205.0
204.2 204.2
204.6 204.9 205.3 204.3
210.5 203.2 233.1 233.3 233.7 202.4
ORISPL 3406
3396 3399 3403 3405 3407 3393
6098
3251 3264 3280 7737 3287 3295 7652 3297 3298 7210 130 3317 3319 6249 3325 50806
50130 50397 50410 50776 50888 50974 3130
SOURCEM CEM
CEM CEM CEM CEM CEM CEM, 906
CEM
CEM, 906 CEM, 906 CEM 767 CEM CEM 767 CEM CEM, 906 CEM CEM CEM CEM CEM 767, 906 767
767 767 767 767 767 767 CEM
NAMEPCAP 2911
950 2600 1918 800 1700 1611
457
992 542 490 99 294 759 78 772 687 417 1738 163 578 1260 135 108
120 110 67 94 114 95 585
204.1
205.2 205.2 204.4 205.2 205.2 205.1
205.2
205.1 204.7 205.2 122.5 205.2 178.6 205.8 205.2 205.2 205.2 205.7 205.2 204.0 205.2 212.3 65.9
209.6 104.1 215.6 208.2 205.9 208.4 205.2
PLCO2RA
eGRID consumed fuel 2005 (by destination)
100 100 99 100 100 100
BIT BIT SUB BIT BIT
99
100
SUB
SUB SUB
17 100 99 49 100 61 100 100 100 100 96 100 88 100 98 24
99 50 47 100 76 98 100 BIT BIT BIT BIT BIT BIT BIT BIT BIT BIT SC BIT BIT SC SUB BIT
SUB BIT PC WC WC WC WC
PLPRMFL
Delivered coal 2005 (by destination)
notes
Table SA2b. Carbon dioxide emission factors for U.S. coal by destination state and power plant, 2005, U.S. customary units.
PLCLPR
STATE Plant Tennessee Eastman Operations Bowater Newsprint Calhoun Operation TEXAS Fayette Power Project Oklaunion J T Deely San Miguel Welsh Pirkey Harrington J K Spruce Tolk Gibbons Creek Limestone W A Parish Big Brown Martin Lake Monticello Coleto Creek Sandow No 4 Twin Oaks Power One Sandow Station UTAH Intermountain Power Project Carbon Hunter Huntington Bonanza Sunnyside Cogen Associates KUCC VIRGINIA Clinch River Glen Lyn Bremo Bluff Chesterfield
Data
29 27 32 12 38 12 12 12 30 26 39 24 24 24 28 12 12 12 90 35 35 28 12 12 12 58 80 38 215
FERC FERC EIA EIA EIA EIA EIA EIA EIA EIA EIA FERC FERC FERC FERC FERC EIA EIA FERC FERC FERC FERC
114 12
n
FERC FERC FERC FERC FERC FERC FERC
EIA EIA
tons 4,421,690 2,067,582 8,540,905 10,531,560 6,069,683 14,464,625 11,483,381 2,475,194 3,867,149 2,140,929 2,267,727 17,366,516 6,100,600 678,000 4,507,000 3,054,000 2,141,550 487,854 397,512 15,396,493 1,578,300 725,400 750,610 3,336,240
1,638,397 185,816 99,313,720 4,386,090 2,688,009 5,643,130 3,328,752 5,997,980 4,248,434 4,690,900
Btu/lb 8,626 8,464 7,034 8,494 7,492 7,029 7,190 9,506 5,753 6,886 6,598 10,781 11,322 11,415 11,128 10,644 9,660 5,288 11,268 12,643 12,403 12,753 12,180 12,604
12,898 12,975 7,628 8,642 8,307 8,528 5,267 8,581 6,644 8,868
Ash S66
5.0 5.3 14.3 5.1 10.7 12.8 12.2 5.3 18.0 15.4 22.2 13.3 10.8 10.0 11.5 17.4 11.8 51.2 8.9 10.5 13.0 10.3 12.1 10.3
8.3 7.4 10.2 5.1 5.2 5.3 22.7 4.6 13.8 4.9
S 0.3 0.3 0.9 0.4 0.7 1.3 0.4 0.3 1.2 1.1 1.8 0.5 0.6 0.4 0.5 0.5 0.5 0.9 0.4 1.0 0.9 0.9 0.9 1.2
0.9 1.0 0.7 0.3 0.4 0.3 2.4 0.3 0.9 0.3
lbs CO2 per million Btu 214.3 214.3 212.9 214.2 213.3 214.1 214.2 213.0 210.2 214.2 209.7 206.9 206.7 206.4 c 207.4 205.3 c 208.7 203.6 209.0 205.9 206.4 206.8 206.8 205.1
205.0 c 204.0 213.7 214.2 214.2 214.2 208.2 214.3 214.8 214.3
ORISPL 3775 3776 3796 3797
6481 3644 6165 8069 7790 50951 56163
6179 127 6181 6183 6139 7902 6193 7097 6194 6136 298 3470 3497 6146 6147 6178 6648 7030 52071
50481 50956
SOURCEM CEM CEM CEM CEM
CEM CEM CEM CEM CEM 767 767
CEM CEM CEM CEM CEM CEM CEM CEM CEM CEM CEM CEM, 906 CEM CEM CEM CEM CEM CEM 767
767 767
NAMEPCAP 713 338 254 1800
1640 189 1472 996 500 58 214
1690 720 932 410 1674 721 1080 566 1136 454 1850 3969 1187 2380 1980 600 591 349 363
194 63
205.2 205.2 205.2 201.8
205.2 205.2 205.2 205.2 205.2 208.2 206.1
205.1 204.7 205.2 217.7 205.2 217.7 205.2 205.2 205.2 205.2 217.7 199.6 215.6 215.8 214.8 205.2 212.6 217.7 212.8
202.9 46.8
PLCO2RA
eGRID consumed fuel 2005 (by destination)
100 67 100 100 100 100 100 100 100 100 100 100 99 94 100 100 100 100 100 100 100 100 100 100 100 100 100 99 100 99 100 90
BIT WDS SUB SUB SUB LIG SUB LIG SUB SUB SUB SUB LIG SUB LIG LIG SUB SUB LIG LIG LIG BIT BIT BIT BIT BIT WC BIT BIT BIT BIT BIT
PLPRMFL
Delivered coal 2005 (by destination)
notes
Table SA2b. Carbon dioxide emission factors for U.S. coal by destination state and power plant, 2005, U.S. customary units.
PLCLPR
STATE Plant Chesapeake Yorktown Clover Altavista Southhampton Mecklenburg Cogeneration Facility Potomac River Cogentrix Portsmouth Cogentrix Hopewell (James River International Paper Franklin Mill Cogentrix of Richmond (Spruance Genco Birchwood Power WASHINGTON Transalta Centralia Generation WISCONSIN Alma Genoa Blount Street Manitowoc Bay Front Oak Creek (South Oak Creek) Valley Pleasant Prairie Edgewater Nelson Dewey Columbia Pulliam Weston E J Stoneman Station Biron Mill Green Bay West Mill John P Madgett Wisconsin Rapids Pulp Mill WEST VIRGINIA John E Amos
Data
12
EIA 202
29 23 15 14 23 13 11 29 84 13 54 29 59 15 24 17
FERC FERC FERC FERC FERC FERC FERC FERC FERC FERC FERC FERC FERC EIA EIA EIA
FERC
24
153 55 139 34 28 23 45 48 22 31 24 68
n
EIA
FERC FERC FERC FERC FERC FERC EIA EIA EIA EIA EIA EIA
tons 170,643 38,137,696 7,706,400
1,575,660 822,900 2,760,310 167,970 166,329 389,340 615,947 386,516 410,968 214,908 866,357 628,738 6,498,795 6,498,795 24,518,776 1,825,600 1,227,000 226,198 116,197 140,517 3,259,254 866,812 5,044,806 2,561,530 548,690 4,167,610 1,608,000 2,149,000 70,816 209,964 326,139
Btu/lb 8,800 11,974 12,068
12,565 12,679 12,643 12,618 12,529 12,772 12,779 12,993 13,414 13,050 12,957 12,553 8,131 8,131 9,093 9,611 10,177 10,893 12,367 10,131 8,873 12,148 8,523 8,756 9,389 8,453 9,256 8,829 11,952 10,174 12,263
Ash S67
4.5 12.5 12.2
10.8 9.4 10.9 10.6 10.9 8.9 9.3 8.1 8.2 8.3 8.5 10.5 13.3 13.3 5.3 6.0 6.7 8.3 9.3 5.1 4.5 8.3 5.1 5.3 4.1 4.8 5.0 5.3 7.7 6.6 9.2
S 0.2 1.8 0.8
0.9 1.4 1.1 0.9 0.8 1.1 0.7 0.7 0.9 0.7 0.9 0.7 0.7 0.7 0.4 0.5 0.6 1.4 1.2 0.4 0.2 0.4 0.3 0.3 0.3 0.3 0.4 0.3 1.1 1.4 1.5
lbs CO2 per million Btu 214.4 204.8 205.4
206.6 204.9 206.2 206.7 205.2 207.0 206.3 206.2 205.3 205.4 205.3 205.5 212.4 212.4 212.9 211.4 209.8 204.0 204.9 211.8 214.4 206.1 214.3 214.2 213.6 214.2 213.0 214.3 205.4 207.8 205.7
ORISPL 3935
4140 4143 3992 4125 3982 4041 4042 6170 4050 4054 8023 4072 4078 4146 10234 10360 4271 10477
3845
3803 3809 7213 10773 10774 52007 3788 10071 10377 52152 54081 54304
SOURCEM CEM
CEM, 767 CEM CEM, 767 CEM, 767, 9 CEM CEM, 906 CEM, 906 CEM CEM CEM CEM CEM CEM, 906 CEM 767 767 CEM 767
CEM
CEM, 906 CEM CEM CEM CEM CEM CEM 767 767 767, 906 767 767
NAMEPCAP 2933
181 346 188 138 68 1211 275 1235 770 200 1023 493 565 53 62 129 387 72
1782
812 1257 848 71 71 140 514 115 115 155 230 258
205.2
206.2 205.2 195.2 205.3 139.1 205.1 205.2 205.2 205.2 208.3 205.2 201.4 204.3 203.3 198.1 214.6 205.2 56.5
203.5
205.1 184.7 205.2 205.2 205.2 205.2 205.2 206.1 206.1 67.5 204.5 206.1
PLCO2RA
eGRID consumed fuel 2005 (by destination)
99 54 100 99 99 99 99 100 100 14 98 100 98 100 100 80 64 63 99 100 100 99 81 100 95 99 99 92 65 100 21 100
BIT BIT BIT BIT BIT BIT BIT BIT BIT BLQ BIT BIT SUB BIT SUB BIT BIT BIT SUB BIT SUB SUB SUB SUB SUB SUB BIT SUB BIT SUB BLQ BIT
PLPRMFL
Delivered coal 2005 (by destination)
notes
Table SA2b. Carbon dioxide emission factors for U.S. coal by destination state and power plant, 2005, U.S. customary units.
PLCLPR
STATE Plant Kanawha River Mountaineer Philip Sporn Albright Rivesville Willow Island Kammer Mitchell Mt Storm North Branch Harrison Power Station Pleasants Power Station Fort Martin Power Station Grant Town Power Plant Morgantown Energy Facility PPG Natrium Plant WYOMING Wygen 1 Laramie River Station Laramie River Station 1 Laramie River Station 2 & 3 Dave Johnston Naughton Wyodak Jim Bridger Neil Simpson II
Data
12 35
39 12 12 28 12
FERC FERC FERC FERC FERC
85 156 160 146 52 41 14 41 106 20 250 62 145 117 24 38
n
EIA FERC
FERC FERC FERC FERC FERC FERC FERC FERC FERC FERC FERC FERC FERC, E EIA EIA EIA
tons 3,787,000 2,766,000 1,938,000 8,283,000 478,590
911,341 4,200,790 2,162,950 464,668 85,665 261,074 1,462,500 3,212,400 4,830,970 379,490 4,936,933 3,511,914 2,657,291 561,929 373,923 417,458 25,483,249 510,759 7,719,900
Btu/lb 8,255 10,035 7,981 9,338 8,037
12,173 11,276 12,004 11,896 12,132 10,733 13,044 12,185 12,104 9,735 12,194 12,412 12,564 7,603 7,963 12,092 8,799 8,020 8,347
Ash S68
5.3 4.8 7.1 10.2 6.3
13.0 10.9 11.9 14.7 12.2 6.4 7.1 11.8 14.6 29.3 12.9 9.0 8.7 35.6 38.9 11.5 7.0 6.5 5.2
S 0.4 0.9 0.6 0.6 0.5
0.8 0.5 1.0 1.7 0.9 1.0 1.5 1.1 1.8 2.9 3.6 4.3 1.7 2.0 2.3 1.2 0.5 0.5 0.3
lbs CO2 per million Btu 214.2 208.2 213.9 212.5 214.0
205.6 207.4 205.7 204.8 203.8 207.7 203.6 205.3 207.3 206.1 201.9 201.6 203.4 203.6 202.8 205.4 212.9 214.0 b 214.3
ORISPL 55479 6204 6204.1 6204.2 4158 4162 6101 8066 7504
3936 6264 3938 3942 3945 3946 3947 3948 3954 7537 3944 6004 3943 10151 10743 50491
SOURCEM
88 570 1140 817 707 362 2318 120
CEM CEM CEM CEM CEM CEM CEM
439 1300 1106 278 110 213 713 1633 1681 80 2052 1368 1152 96 69 123
NAMEPCAP
CEM
CEM CEM CEM CEM CEM CEM CEM CEM CEM, 906 CEM CEM CEM CEM 767 767 767
205.2 205.2 205.2 204.9 205.2 205.2 203.4
205.2
205.2 205.2 205.2 205.2 205.2 205.2 205.2 205.2 205.2 205.2 205.2 205.2 205.2 208.2 207.2 189.9
PLCO2RA
eGRID consumed fuel 2005 (by destination)
100 100 99 100 99 98 100 99 100 100 100 100 100 100 100 90 100 100 100 100 100 100 100 97
BIT BIT BIT BIT BIT BIT BIT BIT BIT BIT BIT BIT BIT WC WC BIT SUB LIG LIG SUB SUB SUB SUB SUB
PLPRMFL
Delivered coal 2005 (by destination)
notes
Table SA2b. Carbon dioxide emission factors for U.S. coal by destination state and power plant, 2005, U.S. customary units.
PLCLPR