APPLIED AND ENVIRONMENTAL MICROBIOLOGY, Aug. 2011, p. 5591–5596 0099-2240/11/$12.00 doi:10.1128/AEM.00464-11 Copyright © 2011, American Society for Microbiology. All Rights Reserved.
Vol. 77, No. 16
Complex Expression of the Cellulolytic Transcriptome of Saccharophagus degradans䌤† Haitao Zhang† and Steven W. Hutcheson* Department of Cell Biology and Molecular Genetics, University of Maryland, College Park, Maryland 20742 Received 1 March 2011/Accepted 11 June 2011
Saccharophagus degradans is an aerobic marine bacterium that can degrade cellulose by the induced expression of an unusual cellulolytic system composed of multiple endoglucanases and glucosidases. To understand the regulation of the cellulolytic system, transcript levels for the genes predicted to contribute to the cellulolytic system were monitored by quantitative real-time PCR (qRT-PCR) during the transition to growth on cellulose. Four glucanases of the cellulolytic system exhibited basal expression during growth on glucose. All but one of the predicted cellulolytic system genes were induced strongly during growth on Avicel, with three patterns of expression observed. One group showed increased expression (up to 6-fold) within 4 h of the nutritional shift, with the relative expression remaining constant over the next 22 h. A second group of genes was strongly induced between 4 and 10 h after nutritional transfer, with relative expression declining thereafter. The third group of genes was slowly induced and was expressed maximally after 24 h. Cellodextrins and cellobiose, products of the predicted basally expressed endoglucanases, stimulated expression of representative cellulase genes. A model is proposed by which the activity of basally expressed endoglucanases releases cellodextrins from Avicel that are then perceived and transduced to initiate transcription of each of the regulated cellulolytic system genes forming an expression pattern. Cellulose, a -1,4-linked glucan typically found associated with the cell walls of plants, can be utilized by the marine bacterium Saccharophagus degradans 2-40 as a major carbon/ energy source for growth (5, 10, 16, 17, 21). S. degradans is a pleomorphic, Gram-negative, aerobic, motile gammaproteobacterium that was isolated from decaying Spartina alterniflora in the Chesapeake Bay (1, 4, 8). Twenty-two enzymes have been shown to be components of the unusual cellulolytic system in this bacterium (17, 20, 23). The system was found to lack cellobiohydrolases but instead appears to use processive endoglucanases to degrade cellulose. The endoglucanases secreted by this bacterium release cellobiose from native cellulose, which is then processed by internal as well as surface-associated -glucosidases and phosphorylases for metabolism. The genes of the S. degradans cellulolytic system are tightly regulated. S. degradans expresses little glucanase activity when it grows on glucose as the primary carbon source (5), but cellulase activity in general and several specific glucanases, such as Cel5F, Cel5H, and Cel5I, as well as their mRNAs, are detected when the bacterium is grown on Avicel (5, 17, 20, 23). This suggests that these genes are under the transcriptional control of one or more regulatory systems that are responsive to cellulose. Expression of the cellulolytic systems of many microorganisms is typically coordinately expressed. In fungi such as Trichoderma reesei, cellulase genes are regulated at the transcriptional level by the products of basally expressed cellulases
(6). Cellulolytic systems of bacteria are also regulated at the transcriptional level. The most common regulatory mechanism for bacterial cellulolytic systems involves a repressor. CebR is a classic repressor of several operons of the Streptomyces griseus cellulolytic system that responds to cellodextrins (11). The cellulase system of Thermobifida fusca is transcriptionally regulated by cellobiose induction mediated through CelR (15, 22). T. fusca CelR binds to a 14-bp inverted repeat to mediate expression of target genes, in some cases by repression and in others by activation (3). The cellulosomal clostridia utilize operons of the cellulolytic system genes that are regulated by repressors (7, 9, 12, 13). In Cellulomonas flavigena, a bacterium with a cellulolytic system closely related to that of S. degradans (21), specific induction of cellulases and xylanases has been observed that is linked to their substrates (14). In S. degradans, the regulatory systems controlling expression of the cellulolytic system genes are not obvious. While cellulolytic system genes loosely cluster at several places in the S. degradans genome, most are not organized into obvious operons containing other members of the cellulolytic system or associated with annotated regulatory components (21). In the current study, we focus on the patterns of expression of the genes encoding the cellulolytic system enzymes to begin to understand how this complex system of cellulases and accessory enzymes work together. As a first step toward this goal, mRNA levels in S. degradans for selected cellulolytic system genes were determined during the nutritional transition from glucose to Avicel (cellulose). Three patterns of expression were apparent, suggesting the involvement of at least 3 regulatory systems. Based upon the activities of basally expressed enzymes, potential signal molecules released from cellulose were deduced and demonstrated to act as inducers. A general model for induction of S. degradans cellulases by cellulose is proposed.
* Corresponding author. Mailing address: Department of Cell Biology and Molecular Genetics, University of Maryland, Microbiology Bldg., College Park, MD 20742. Phone: (301) 405-5498. Fax: (301) 314-9489. E-mail:
[email protected]. † Present address: AE Zymetis, Inc., 387 Technology Dr., College Park, MD 20742. 䌤 Published ahead of print on 24 June 2011. 5591
5592
ZHANG AND HUTCHESON
APPL. ENVIRON. MICROBIOL. TABLE 1. Primers used for qRT-PCR
Target genea
cel5A cel5B cel5C cel5D cel5E cel5F cel5G cel5H cel5I cel5J cel6A cel9A cel9B bgl1A bgl1B bgl3C ced3A ced3B cep94A cep94B folA spoR
ORFb
3003 2490 0325 2636 2929 1572 3239 3237 3420 2494 2272 0636 0649 3603 1394 2674 2497 0245 1318 0906 0351 3695
Primer sequence Encoded enzyme
Endo-1,4--glucanase Endo-1,4--glucanase Endo-1,4--glucanase Endo-1,4--glucanase Endo-1,4--glucanase Endo-1,4--glucanase Processive endo-1,4--glucanase Processive endo-1,4--glucanase Endo-1,4--glucanase Processive endo-1,4--glucanase Endo-1,4--glucanase Endo-1,4--glucanase Endo-1,4--glucanase Cellobiase Cellobiase Cellobiase Cellobiase Cellobiase Cellobiose phosphorylase Cellodextrin phosphorylase Dihydrofolate reductase Guanylate kinase
5⬘ Primer
3⬘ Primer
AACATTGCCGAAGCCATTAC TATGCAGTCAGGCGAGTACG AGAAACCGAAGCACAAATGG AGCTCGAGCACCAGCTCTAC ATGGCGGCAGTTTTAATTTG TATTCGCCTGCCTATTCACC CCAAGGTCTTCCACCCTACA CCTACTTGGTCGCAGGATGT CTCAAGGTGTGGGTGATGTG CGGTATGAACGTAGGCTGGT TGTGATCCAAACGCACCTAA AAAGGGTTGGTACGATGCTG GCTTGTGCGGTAACCAAAAT ATTTGGGATGCGTTCAGTTC AACATGAGCCCTTGTTACGC TATTTGCATGACGAGCAAGC GCCACTATTGACGAGGTGGT GACACCCAAGGTGACGACTT AAAGTGGCGACGAAAAGCTA CACCCCAGACCCAGAACTAA CGAGGGCTACGAAGATCAAG TGCCACTATGGTGGAAAACA
AGCGCGAATAGCAGGAATAA CATCTACACTCAGCGCCAAA GTCCACAATAGCGAGGTGGT TCGCTTCTAGGGAGTTTCCA ATTCCAGCCACCAGTAATCG GTGTCGTACATGGGGTGTTG AGAATGCGGTTGCCATCTAC GTGCCCGCATAAAAGTGAAT GGAGGCTCTGCATCTAAACG TGGCTGGCTACTCGGTAAGT TTTGGAATGCTTCTGGGAAC GTACGCAGCCATTAGGGTGT CAGTAAGCTGTGGCGATTCA GGTAAGCCTTTAGCCCCATC CGCCTTCACAAATAGGTGGT AAGCCAGTCGTTGCTGTTTT GCAACCAGCACGGTTTTATT CTTTGTCGCCAAGGAAGAAG GCCAGATTCGAAGAAAGACG CGCGTAATGTTGGGCTTAAT ATAACTGCGCACCACCTACC TGCAGCAGGTATGAGTTTGC
Cel, cellulase; Ced, cellodextrinase; Bgl, -glucosidase; Cep, cellobiose/cellodextrin phosphorylase. Open reading frame number with the prefix “Sde_,” as assigned in the genome assembly of 15 June 2005 (http://genome.ornl.gov/microbial/mdeg/15jun05/mdeg .html). a b
MATERIALS AND METHODS Bacterial strains and medium. Saccharophagus degradans 2-40T (ATCC 43961) was grown in a minimal medium containing 2.3% Instant Ocean (Aquarium Systems, Mentor, OH), 0.05% yeast extract, 0.5% ammonium chloride, and 16.7 mM Tris-HCl, pH 8.6, supplemented with 0.2% glucose or Avicel (20). When the optical density at 600 nm (OD600) of S. degradans cultures grown on 0.2% glucose minimal medium reached 0.33 to 0.35, the cells were harvested and transferred into fresh medium that contained 0.2% Avicel. Zymograms. Zymogram analysis was adapted from the work of Taylor et al., with slight modifications (17). Gels for zymogram analysis were prepared for sodium dodecyl sulfate-polyacrylamide gel electrophoresis (SDS-PAGE) with 0.1% barley -glucan (medium viscosity; Megazyme) incorporated directly into the resolving gel. After electrophoresis, gels were washed using distilled water twice and then incubated in 30 ml of refolding buffer [20 mM piperazine-N,N⬘bis(2-ethanesulfonic acid) (PIPES) buffer (pH 6.8), 2.5% Triton X-100, 2 mM dithiothreitol, and 2.5 mM CaCl2] for 1 h at room temperature. The refolding buffer was replaced and the gel held at 4°C overnight. The gels were washed twice using PIPES buffer, transferred to PIPES buffer, incubated for 12 h at 37°C, and stained using 0.25% Congo red. For 2-dimensional (2D) gel electrophoresis, proteins in culture filtrates were precipitated using a ReadyPrep 2-D cleanup kit (Bio-Rad, Hercules, CA). Precipitated proteins were solubilized in 200 l of rehydration buffer and loaded onto an 11-cm isoelectric focusing (IEF) tray (Bio-Rad). An 11-cm immobilized pH gradient (IPG) strip (pH 4 to 7) was placed gel side down in the IEF tray and covered with mineral oil. IEF was performed using a Protean IEF cell (Bio-Rad) at 20°C under rehydration conditions for 12 h, with 250 V for 20 min with a linear ramp, 8,000 V for 2.5 h with a linear ramp, and 8,000 V with a rapid ramp. Following IEF, the IPG strip was incubated in ReadyPrep equilibration buffers 1 and 2 for 10 min each and then placed on top of a zymogram gel prepared as described above. The second dimension was run at 120 V for 6 h. The gel wash, incubation, and stain steps were the same as the zymogram procedures described above. qRT-PCR. Quantitative real-time PCR (qRT-PCR) was adapted from the procedures of Watson et al. and Zhang et al. (20, 23). At the selected times, cultures were mixed with RNAprotect reagent (Qiagen) as recommended by the manufacturer. After incubation at room temperature for 5 min, cells were collected by centrifugation at 5,000 ⫻ g for 10 min, and total RNA was then extracted from S. degradans cell culture by using an RNeasy kit (Qiagen). The
resulting RNA was converted to cDNA using a QuantiTect reverse transcription kit (Qiagen). For gene-specific qRT-PCR, primer pairs were designed using online software (http://frodo.wi.mit.edu/primer3). Primers were selected to target regions internal to the open reading frame of the gene being investigated. Primers were screened for melting temperature (Tm) values between 58 and 60°C, with a total amplicon size between 120 and 180 bp (Table 1). The dihydrofolate reductase (folA) and guanylate kinase (spoR) housekeeping genes were selected as reference genes (18). Each 20-l qRT-PCR mixture contained 10 l of 2⫻ LightCycler 480 SYBR green master mix, 1 l of cDNA, and 1 l each of 5 M forward and reverse primers. Real-time PCR was performed on a Light Cycler 480 instrument (Roche) according to the manufacturer’s instructions. Cycling conditions were as follows: initial denaturation at 95°C for 4 min and 45 cycles of 95°C for 15 s, 56°C for 15 s, and 72°C for 20 s. Data were interpreted using Roche software.
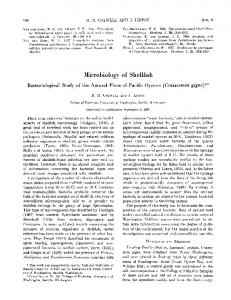
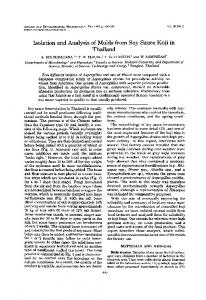
RESULTS Glucanase activity in zymograms. To evaluate the expression of glucanases during culture on glucose, zymograms were obtained during exponential-phase growth on glucose. At least four enzymes appeared to be expressed basally in the glucose medium (Fig. 1). Low levels of glucanase activity, as indicated by the zones of clearing in the -glucan gels, were apparent for products that migrated in 2D zymograms at masses equivalent to ⬃120 kDa, with a pI near 4.5; ⬃90 kDa, with a pI near 4.1; 65 kDa, with a pI near 6.0; and 50 kDa, with a pI of around 4.7. Using the theoretical molecular mass of each enzyme together with its calculated pI, this suggests that Cel5A (127 kDa; pI ⫽ 4.7), Gly5L (93.3 kDa; pI ⫽ 4.2), Gly5M (94.9 kDa; pI ⫽ 4.1), Cel9B (89 kDa; pI ⫽ 4.7) or Cel6A (82 kDa; pI ⫽ 4.4), Cel5G (68 kDa; pI ⫽ 6.0), and Cel5C (49 kDa; pI ⫽ 4.4), Bgl1A (53 kDa; pI ⫽ 5.0), or Bgl1B (50 kDa; pI ⫽ 4.9) could be expressed basally if the major components of the cellulolytic system have
VOL. 77, 2011
CELLULOLYTIC TRANSCRIPTOME OF SACCHAROPHAGUS DEGRADANS
5593
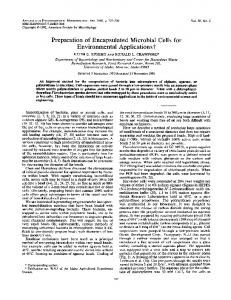
FIG. 1. Zymograms of glucanases induced during growth on Avicel. Cells were grown to an OD600 of 0.3 to 0.5 in medium containing glucose as the sole carbon source, harvested, and transferred to the same volume of medium containing an equivalent amount of Avicel. Samples were removed at the indicated times and normalized to the OD600. Protein samples for 2D gels were prepared using a ReadyPrep 2-D cleanup kit and a ReadyPrep 2-D starter kit (Bio-Rad). Using Bio-Rad equipment, protein samples were fractionated by isoelectric point from pH 4 to pH 7 according to the manufacturer’s instructions. The samples were then fractionated by SDS-PAGE, with 0.1% barley -glucan included in the resolving gel. Gels were incubated in refolding buffer (20 mM PIPES buffer [pH 6.8], 2.5% Triton X-100, 2 mM dithiothreitol, 2.5 mM CaCl2) for 1 h at room temperature and then held overnight in fresh refolding buffer at 4°C. The gels were transferred to PIPES buffer, incubated at 37°C, and stained with 0.25% Congo red. Calculated masses are shown on the left, in kDa. The experiment was repeated at least three times with similar results.
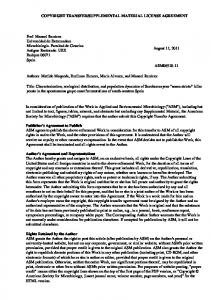
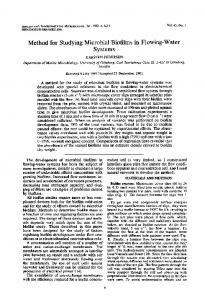
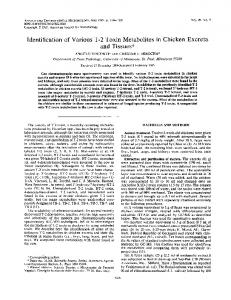
been identified. Purified forms of the glucosidases as well as known endoglucanases exhibited glucanase activity in zymograms (data not shown), hence their inclusion. The absence of phosphate in the zymogram washes minimized phosphorylase activity. Kinetics of glucanase induction. To obtain a better understanding of induced glucanase expression, S. degradans cells were harvested from early-exponential-phase cultures grown in medium containing glucose as the primary carbon source and transferred to a medium containing Avicel as the primary carbon source. Periodically, samples containing equivalent amounts of cells were fractionated by SDS-PAGE, and zymograms of glucanase activity were obtained. Consistent with the observed amplification of the cellulase activity of the cells (5), increasing numbers and levels of the various glucanases were detected during a 24-h induction period, during which the bacterium utilized cellulose as the primary carbon source (Fig. 1). In addition to basally expressed polypeptides, new species of proteins of around 90 kDa were induced by 2 h after the nutritional shift to Avicel. The 90-kDa glucanase species exhibiting the highest activity appeared to change after 10 h of induction. There were major differences in the pI and more subtle changes in mass for glucanases in the samples obtained after 10 h. Maximal glucanase activity was detected after 24 h of culture on Avicel, with a variety of expressed glucanases that ranged in size from 32 to 130 kDa. No changes in glucanase activity (both species and amount) in zymograms were observed when cultures were maintained on glucose (data not shown). Transcript levels of cellulolytic system genes during growth on glucose. Attempts to identify basally expressed polypeptides with glucanase activity by mass spectrometry (MS) were unsuccessful, most likely due to the low expression of the glucanases and high sensitivity of the zymogram assay. Instead, we used transcript levels of the known components of the cellulolytic system measured by qRT-PCR to estimate basal expression of each enzyme during growth on glucose. Of the genes encoding -1,4-endoglucanases, the apparent basal expression was highest for cel5A, cel5B, cel5G, cel5I, and cel9A (Fig. 2).
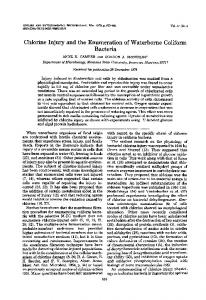
Transcript levels of these genes were 2.5 to 3.5% that of the dihydrofolate reductase (folA) housekeeping gene but were equivalent to that of the housekeeping gene encoding guanylate kinase (spoR) (75 to 125%) in simultaneous experiments (data not shown). Several genes for -glucosidases were also expressed basally, with cytoplasmic bgl1A being the most expressed of all of the monitored genes, with basal transcript levels 10 times higher than those of most of the others. Transcript levels for the other tested genes were ⬍1.0% that of folA. The higher transcript levels of the indicated genes are consistent with the observed basal expression deduced to represent Cel5A, Cel5G, and Bgl1A, which have similar masses and pIs, but does not explain the ⬃90-kDa glucanase activity. Gly5L does have the correct properties, and in separate experiments, basal expression was detected (data not shown). Transcript levels of cellulolytic system genes during growth on Avicel. To estimate the effect of cellulose on the expression of cellulolytic system genes, the transcript levels for each of the known cellulolytic system genes were determined 2, 4, 10, and 24 h after a nutritional shift from glucose as the primary carbon source to the equivalent level of cellulose in the form of particulate Avicel. These genes have been shown previously to exhibit enhanced expression during growth on Avicel (20, 23). Transcript levels at each time point were normalized to that of folA, which was relatively insensitive to growth rate (19). With the exception of bgl1B, the relative transcript levels of the monitored genes increased upon growth on cellulose. Further analysis showed that there were at least 3 patterns of expression (Table 2). The first set of genes included cel5A, cel5C, cel5G, bgl1B, and cel3B, which were induced modestly during growth on cellulose (⬍6-fold), with maximal expression obtained and maintained beginning around 2 to 4 h after induction. The majority of cellulolytic system genes (cel5B, cel5E, cel5F, cel5H, cel5J, cel9A, bgl1A, bgl3C, ced3A, cep94A, and cep94B) clustered in pattern 2. Expression of these genes was induced strongly by cellulose, as transcript levels increased at least 17-fold and, in some cases, 3,000-fold. Genes of this set reached their highest relative expression at 4 to 10 h postinduction but then diminished at 24 h. A third pattern of expres-
5594
ZHANG AND HUTCHESON
APPL. ENVIRON. MICROBIOL.
FIG. 2. Transcript levels of cellulolytic system genes during growth on glucose. S. degradans was cultured on glucose to an OD600 of 0.3 to 0.4, harvested, and transferred to the same volume of medium containing the indicated substrate. After 10 h, the RNA was isolated using RNAprotect bacterial reagent (Qiagen) and an RNeasy minikit (Qiagen). The cDNA was synthesized using a QuantiTect reverse transcription kit. The 120to 200-bp fragments of each indicated gene or two control genes (guanylate kinase and dihydrofolate reductase genes) were amplified using a SYBR green master mix kit (Roche) and a Light Cycler 480 instrument (Roche). Roche software was used to estimate transcript levels. Similar results were obtained in three replicates of the experiment.
sion was identified that included cel5D, cel5I, cel6A, and cel9B, whose transcript levels continued to increase throughout the induction period, to as high as 4,800-fold higher than the control housekeeping gene level. Influence of cellodextrins on cellulolytic system induction. Of the apparent basally expressed glucanases, Cel5A, Gly5L, and Cel5G are secreted enzymes associated with the production of cellobiose, cellotetraose, or cellodextrins from cellulose (10, 16, 20). To explore whether released cellodextrins could
TABLE 2. Relative transcript levels of selected cellulolytic system genes after transfer to medium with Avicel Fold increase (mean ⫾ SD)a at indicated time (h)
Gene
cel5A cel5B cel5C cel5D cel5E cel5F cel5G cel5H cel5I cel5J cel6A cel9A cel9B bgl1A bgl1B bgl3C ced3A ced3B cep94A cep94B
2
4
10
24
1 ⫾ 0.5 12 ⫾ 9.1 6 ⫾ 2.5 4 ⫾ 2.0 9 ⫾ 2.3 98 ⫾ 11.4 1 ⫾ 0.1 107 ⫾ 29 4 ⫾ 1.5 4 ⫾ 0.8 11 ⫾ 5.1 17 ⫾ 1.9 3 ⫾ 1.6 4 ⫾ 0.8 1 ⫾ 0.6 19 ⫾ 6 14 ⫾ 8.0 4 ⫾ 0.3 44 ⫾ 12 5 ⫾ 1.5
2 ⫾ 0.4 27 ⫾ 5.5 2 ⫾ 1.2 5 ⫾ 1.0 32 ⫾ 11 1,227 ⫾ 296 1 ⫾ 0.4 1,623 ⫾ 553 161 ⫾ 75 77 ⫾ 48 209 ⫾ 91 37 ⫾ 6 34 ⫾ 21 24 ⫾ 1.6 1 ⫾ 1.0 25 ⫾ 7 14 ⫾ 6 4 ⫾ 1.6 314 ⫾ 101 57 ⫾ 19
3 ⫾ 1.0 37 ⫾ 15 5 ⫾ 2.1 14 ⫾ 8 37 ⫾ 36 425 ⫾ 63 3 ⫾ 2.1 3,053 ⫾ 849 634 ⫾ 316 98 ⫾ 157 438 ⫾ 123 30 ⫾ 23 81 ⫾ 28 13 ⫾ 3 1 ⫾ 0.2 30 ⫾ 2 17 ⫾ 8 6 ⫾ 2.7 162 ⫾ 36 19 ⫾ 4
3 ⫾ 0.9 15 ⫾ 0.8 3 ⫾ 0.9 21 ⫾ 9 14 ⫾ 3.8 161 ⫾ 37 5 ⫾ 3.7 1,452 ⫾ 974 4,809 ⫾ 1,140 5⫾1 791 ⫾ 189 12 ⫾ 5 562 ⫾ 15 3 ⫾ 1.1 2 ⫾ 0.6 13 ⫾ 0.4 7 ⫾ 4.6 4 ⫾ 0.1 121 ⫾ 33 6 ⫾ 0.6
a Fold increase relative to the transcript level detected during culture in glucose medium. The experiment was repeated at least three times with similar results.
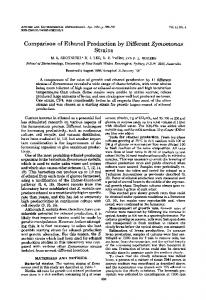
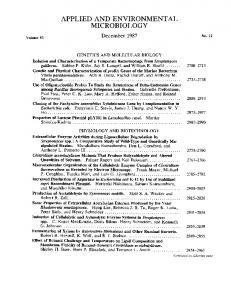
influence the expression of cellulose genes, the transcript levels of cel5A, cel5H, and cel5I, representative genes for each of the observed expression patterns, were monitored as before, using medium containing Avicel alone or Avicel supplemented with low levels (0.004%) of cellodextrins, cellotetraose, or cellobiose. As described above, expression of the representative pattern 1, 2, and 3 genes was as expected, with low-level expression of the pattern 1 gene, strongly induced expression of the pattern 2 gene that was maximal at 10 h, and slow induction of the pattern 3 gene (Fig. 3). Addition of cellodextrins, cellotetraose, or cellobiose to the inducing cellulose suspension stimulated accumulation of all transcripts. Both faster induction of gene expression, as indicated by the accumulation of transcripts, and the magnitude of the apparent induction were stimulated by the addition of 0.004% of the tested cellodextrins to the 0.2% cellulose used as a growth substrate. Similar results were obtained for the pattern 2 gene cel5F (data not shown). The results are consistent with cellodextrins and, most likely, cellobiose released by the activity of basally expressed glucanases functioning as signal molecules to induce expression of cellulolytic system genes with each of the expression patterns. DISCUSSION The cellulolytic system of S. degradans is complex, involving at least 12 GH5 endoglucanases, a GH6 endoglucanase, and 2 GH9 endoglucanases, as well as multiple GH1 and GH3 -glucosidases and at least 1 GH94 cellobiose phosphorylase (10, 17, 20, 23). It is well established that expression of the genes for these enzymes is induced by cellulose, presumably through contact with native cellulose (5, 16, 20, 23). The mechanism by which this occurs is not obvious. The results presented here indicate that most of the genes for the known cellulolytic system in S. degradans are regulated at the transcriptional level. Three patterns of cellulose-dependent expression were ob-
VOL. 77, 2011
CELLULOLYTIC TRANSCRIPTOME OF SACCHAROPHAGUS DEGRADANS
FIG. 3. Influence of cellodextrins on transcript levels of cel5A (A), cel5H (B), and cel5I (C). S. degradans was cultured on glucose to an OD600 of 0.33 to 0.35, harvested, and transferred to the same volume of medium containing the indicated substrate: 0.2% Avicel (diamonds), 0.2% Avicel plus 0.004% cellodextrin (squares; Cd), 0.2% Avicel plus 0.004% cellotetraose (circles; Ct), or 0.2% Avicel plus 0.004% cellobiose (triangles; Cb). RNA isolation and qRT-PCR were performed as described in the legend to Fig. 2. This experiment was done at least three times.
served that differed in kinetics and magnitude. Most importantly, basally expressed, secreted endoglucanases were identified that would release cellobiose or cellodextrins from insoluble cellulose. Cellobiose and cellodextrins, in turn, strongly stimulated the expression of many cellulolytic system genes. These observations suggest that unlike many other cellulolytic bacteria, S. degradans uses multiple mechanisms to sense and regulate expression of its cellulolytic system. Both the zymograms and qRT-PCR indicated that at least some glucanases are expressed basally at a low level during growth on glucose. MS-MS was unsuitable for the identification of these induced activities due to their apparently low expression. The physical properties of the glucanase activities detected in zymograms, however, could be used to deduce potential source genes. From this information, several candidate glucanases appeared to be expressed basally during growth on glucose. The transcript levels of the source genes argue that Cel5A, Cel5G, Gly5L, and Bgl1B are the major glucanases responsible for the observed basal glucanase activities.
5595
The zymograms confirmed that complex induction of the cellulolytic system occurred during growth on cellulose, but the most glucanase activity was observed after 24 h of growth with cellulose as the primary carbon source. The transcript levels of the genes for the known cellulolytic system glucanases mirrored, in general, the activities detected in the zymograms. The highest transcript levels were also observed after 24 h of induction with cellulose. Thus, assuming that the mRNAs and enzymes have similar stabilities, most, but not all, of the glucanase activities in the zymograms could be accounted for by the known glucanases of the cellulolytic system. The lack of specificity in the zymograms, however, coupled with the long reaction times, could enable glucanases of other specificities to exhibit activity in the assay. There may also be other members of the cellulolytic system that have yet to be identified. Examples might be the ⬃90-kDa glucanases with an apparent pI of 4.2. These glucanase activities are best attributed to Gly5L and/or Gly5M, which exhibit the expected physical properties for the deduced gene products (9) but whose function has not been established (17). Each of the secreted endoglucanases thought to be expressed basally forms cellobiose, cellotetraose, or other cellodextrins (20). Thus, it is reasonable to predict that these enzymes release these soluble cellodextrins and cellobiose from insoluble cellulose. This provides a mechanism for the observed contact-dependent induction of the glucanases. Upon contact of the bacterium with cellulose, the basally expressed glucanases would release soluble forms of cellodextrins. The tested soluble cellodextrins were strong inducers of representative cellulolytic system genes. In the case of the examined pattern 1 gene, cellotetraose was the strongest inducer. For the tested pattern 2 genes, cellobiose appeared to be the strongest inducer. For pattern 3, assuming that induction occurred early or the inducers were stable, cellodextrins in general were the strongest inducers. The involvement of soluble cellodextrins in the regulation of the cellulolytic system of S. degradans is similar to the regulatory paradigms of other cellulolytic microorganisms. The soluble cellodextrins or derivatives can act as inducers to initiate expression of the whole cellulolytic system (e.g., see references 2, 18, and 22). The observed multiple patterns of expression argue that the regulation of the S. degradans cellulolytic system is complex and likely to involve multiple mechanisms. For example, at least three patterns of expression for the tested members of the cellulolytic system were detected. Thus, each pattern could represent a distinct regulatory mechanism responding to a different inducer. Identification of the predicted regulatory systems that respond to the signaling cellobiose and the other cellodextrins remains cryptic, as few genes annotated to produce transcriptional factors cluster with known members of the cellulolytic system. The enhancement of representative endoglucanase gene expression by cellobiose and the tested cellodextrins indicates that the bacterium has one or more receptors for these molecules that function in the sensory system to induce expression of the cellulolytic system. Cellobiose and cellodextrins are produced by the secreted endoglucanases, but the other basally expressed enzyme, Bgl1A, is a cytoplasmic -glucosidase that would convert internalized cellobiose and cellodextrins to glucose. Glucose is not unique to cellulose metabolism and therefore is unlikely to be a signal molecule
5596
ZHANG AND HUTCHESON
(17, 20, 23). Thus, it can be predicted that perception of the cellodextrins or cellobiose by S. degradans must occur outside the cytoplasm. Most likely this occurs at the cell membrane. The abundant TonB-dependent receptors of this bacterium or membrane-associated AraC homologs could function in this capacity (21), but additional work is needed to identify the receptor(s) for cellobiose/cellodextrins.
APPL. ENVIRON. MICROBIOL.
10.
11.
12.
ACKNOWLEDGMENTS
13.
This research was supported by award DEB0621297 from the National Science Foundation to S.W.H. We thank Alma Polo-Barrios for her critical reading of the manuscript.
14.
REFERENCES
15.
1. Andrykovitch, G., and I. Marx. 1988. Isolation of a new polysaccharidedigesting bacterium from a salt marsh. Appl. Environ. Microbiol. 54:3–4. 2. Beguin, P., and J. P. Aubert. 1994. The biological degradation of cellulose. FEMS Microbiol. Rev. 13:25–58. 3. Deng, Y., and S. Fong. 2010. Development and application of a PCR-targeted gene disruption method for studying CelR function in Thermobifida fusca. Appl. Environ. Microbiol. 76:2098–2106. 4. Ekborg, N., et al. 2005. Saccharophagus degradans gen. nov., sp. nov., a versatile marine degrader of complex polysaccharides. Int. J. Syst. Evol. Microbiol. 55:1545–1549. 5. Ensor, L., S. K. Stotz, and R. M. Weiner. 1999. Expression of multiple insoluble complex polysaccharide degrading enzyme systems by a marine bacterium. J. Ind. Microbiol. Biotechnol. 23:123–126. 6. Foreman, P. K., et al. 2003. Transcriptional regulation of biomass-degrading enzymes in the filamentous fungus Trichoderma reesei. J. Biol. Chem. 278: 31988–31997. 7. Gold, N., and V. Martin. 2007. Global view of the Clostridium thermocellum cellulosome revealed by quantitative proteomic analysis. J. Bacteriol. 189: 6787–6795. 8. Gonzalez, J., and R. M. Weiner. 2000. Phylogenetic characterization of marine bacterium strain 2-40, a degrader of complex polysaccharides. Int. J. Syst. Evol. Microbiol. 50:831–834. 9. Han, S., H. Yukawa, M. Inui, and R. Doi. 2003. Transcription of Clostridium
16.
17. 18. 19.
20.
21.
22. 23.
cellulovorans cellulosomal cellulase and hemicellulase genes. J. Bacteriol. 185:2520–2527. Hutcheson, S., H. Zhang, and M. Suvorov. 2011. Carbohydrase systems of Saccharophagus degradans degrading polymers of marine origin. Mar. Drugs 9:59–79. Marushima, K., Y. Ohnishi, and S. Horinouchi. 2009. CebR as a master regulator for cellulose/cellooligosaccharide catabolism affects morphological development in Streptomyces griseus. J. Bacteriol. 191:5930–5940. Newcomb, M., C. Chen, and J. Wu. 2007. Induction of the celC operon of Clostridium thermocellum by laminaribiose. Proc. Natl. Acad. Sci. U. S. A. 104:3747–3752. Sabathe, F., A. Belaich, and P. Soucaille. 2002. Characterization of the cellulolytic complex (cellulosome) of Clostridium acetobutylicum. FEMS Microbiol. Lett. 217:15–22. Sanchez-Herrera, L. M., A. C. Ramos-Valdivia, M. de la Torre, L. M. Salgado, and T. Ponce-Noyola. 2007. Differential expression of cellulases and xylanases by Cellulomonas flavigena grown on different carbon sources. Appl. Microbiol. Biotechnol. 77:589–595. Spiridonov, N., and D. Wilson. 2000. A celR mutation affecting transcription of cellulase genes in Thermobifida fusca. J. Bacteriol. 182:252–255. Suvorov, M., R. Kumar, H. Zhang, and S. Hutcheson. 2011. Novelties of the cellulolytic system of a marine bacterium applicable to cellulosic sugar production. Biofuels 2:59–70. Taylor, L., et al. 2006. A complete cellulase system in the marine bacterium Saccharophagus degradans strain 2-40. J. Bacteriol. 188:3849–3861. Tomme, P., R. A. Warren, and N. R. Gilkes. 1995. Cellulose hydrolysis by bacteria and fungi. Adv. Microb. Physiol. 37:1–81. Vandecasteel, S., W. Peetermans, R. Merckx, and J. Van Eldere. 2001. Quantification of expression of Staphylococcus epidermidis housekeeping genes with Taqman quantitative PCR during in vitro growth and under different conditions. J. Bacteriol. 183:7094–7101. Watson, B., H. Zhang, A. Longmire, Y.-H. Moon, and S. Hutcheson. 2009. Processive endoglucanases mediate degradation of cellulose by Saccharophagus degradans 2-40. J. Bacteriol. 191:5697–5705. Weiner, R., et al. 2008. Complete genome sequence of the complex carbohydrate-degrading marine bacterium, Saccharophagus degradans strain 2-40. PLoS Genet. 4:e1000087. Wilson, D. 2004. Studies of Thermobifida fusca plant cell wall degrading enzymes. Chem. Rec. 4:72–82. Zhang, H., et al. 2011. Hydrolytic and phosphorolytic metabolism of cellobiose by the marine aerobic bacterium Saccharophagus degradans 2-40T. J. Ind. Microbiol. Biotechnol. doi:10.1007/s10295-011-0945-4.