Fauna norvegica 2016 Vol. 36: 1-7.
Increased precision of growth data gained by reading multiple scales from each individual of Atlantic salmon (Salmo salar ) Tormod Haraldstad1,2, Thrond Oddvar Haugen2, Reidar Borgstrøm2 and Bror Jonsson3 Haraldstad T, Haugen TO, Borgstrøm R and Jonsson B. 2016. Increased precision of growth data gained by reading multiple scales from each individual of Atlantic salmon Salmo salar. Fauna norvegica 36: 1-7. The precision of growth estimates based on fish scales often remains uncertain because of withinindividual variation in scale size and scale patterns, and also due to measurement errors. Based on scale readings of Atlantic salmon, we show that errors decreased with number of times and number of scales read per fish. The annual number of scale circuli was not constant, but positively correlated with annual specific growth rates. Number of circuli deposited after the last winter correlated positively with sampling date. There was no significant relationship between mean inter-circuli distance and the total circuli number during the first and second year at sea. For growth estimation in scientific studies, we recommend the use of 4-5 scales per fish. Consideration should be given to both circuli number and inter-circuli distances when estimating growth rate instead of relying on inter-circuli distances only. doi: 10.5324/fn.v36i0.1954. Received: 2015-11-19. Accepted: 2016-01-15. Published online: 2016-02-24. ISSN: 1502-4873 (printed), 1891-5396 (electronic). Keywords: circuli number, inter-circuli distances, measurement error, sampling error, scale reading 1. Norwegian Institute for Water Research, Jon Lilletuns vei 3, NO-4879 Grimstad, Norway 2. Department of Ecology and Natural Resource Management, Norwegian University of Life Sciences, P.O. Box 5003, NO-1432 Ås, Norway 3. Norwegian Institute for Nature Research, Gaustadalléen 21, NO-0349 Oslo, Norway Corresponding author: Tormod Haraldstad E-mail:
[email protected]
INTRODUCTION Fish scales are typically used for age determination and retrospective individual growth analyses (Marco-Ruis et al. 2013). For correct estimation, the sampling of a high number of scales from each fish is recommended (Jonsson & Stenseth 1976; Shearer 1992). This is to decrease measurement errors such as those documented by Jonsson & Stenseth (1976) when scales of brown trout Salmo trutta Linneaus, 1758 were used for growth estimation, both as a function of number of times read and number of scales measured. Despite such recommendations the majority of scale analyses are frequently performed on only one scale from each individual. It should be noted that developments in the equipment for scale image analysis have made it possible to improve the accuracy during recent years (e.g. Peyronnet et al. 2007), making it easier to
measure distances within each scale than in early studies of the methodology such as Jonsson & Stenseth (1976). Even with such technical improvements, the measurement uncertainties remain an important source of error, which should be estimated, and errors due to variation in scale size will not be influenced by the improved scale reading equiment. As fish increase in length, circuli are deposited at the scale margin (Wootton 1998). In salmonids, scale circuli formation rate and inter-circuli distances have been positively correlated with growth rate (e.g. Pearson 1966; Fisher & Pearcy 2005). Thus, number of circuli and inter-circuli distances in anadromous species like Atlantic salmon Salmo salar Linneaus, 1758 scales may reflect the variation in growth rate during the years at sea (Peyronnet et al. 2007). Friedland et al. (1993) provided an estimate of the scale circuli depositon rate for a
1
Haraldstad et al.: Growth estimation in Atlantic salmon
group of tagged fish and found that that approximately four circuli per month were formed during the first spring and summer at sea, and two circuli per month were formed in the autumn and winter when the individual growth rate is low. Based on these assumptions, Friedland et al. (2005) calculated indices meant to represent early growth of salmon at sea. A modification of this method was used in Friedland et al. (2009 a, b). Implicit in these later studies was the recognition that the circuli deposition rate is not fixed, but varies among individuals within populations and life stages (Dietrich and Cunjak 2007). Aims of the present study were to calculate growth from the number of circuli, and by measurements of inter-circuli widths in scales of anadromous Atlantic salmon to estimate errors of sampling and measurement in the growth analysis, and thus provide recommendations regarding the number of scales that should be used and number of times each scale should be measured. We hypothesized that (i) inter-circuli distances, but not number of scale-circuli in the first marine growth zone increased with growth-rate of the fish, and that (ii) number of scale-circuli in the growth zone following the last marine winter annulus increased with date of sampling.
posterior edge of the dorsal fin to the anterior edge of the anal fin, as recommended by Dannevig & Høst (1931). The scales were stored dry in paper envelopes. For each individual, a random sample of ten scales was used for further analyses. Only scales with small central plates were used in order to avoid missing the first annulus (Jonsson & Stenseth 1976). The scales were cleaned in a Petri dish with soapy water and rubbed clean between two fingers (Shearer 1992), and thereafter placed between two glass slides and dried overnight. An impression of each scale was pressed onto a cellulose acetate slide by a scale press. A stereoscopic microscope (Leica MS5, 16 x magnifications) with digital camera (Leica DFC320, 0.63x magnification) was used to record an image (2088 x 1550 pixels) of each scale impression. Using the program Adobe Photoshop Elements 2.0, the quality of the scale images was improved (increasing contrast) and scale measurements taken by use of the program Image pro express 6.3. All distances, measured in pixels, were made along the longest axis of the scale, from the
MATERIAL AND METHODS During 2004-2010 fishing seasons, Atlantic salmon (n=245, Table 1) on their spawning migration were caught with a bag net at Stumpodden (58°01´N; 7°44´E), situated one-kilometre southwest of the outlet of the River Mandalselva on the Skagerrak coast of Norway. A large portion of the captured individuals is probably hatched in Mandalselva, and heading for their home river to spawn. The dominant age-group in the catches were 2SW (1SW: 9%, 2SW: 67%, 3SW: 3%, previous spawners: 20%, escaped farmed salmon: 1%). The fish were caught for human consumption, but before processed, the total length was measured (mm), and approximately 50 scales per individual were taken from a restricted area above the lateral line, midway between the
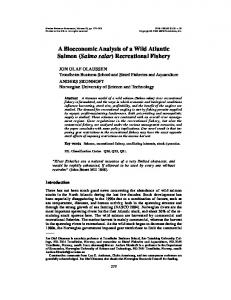
Figure 1. Scale from 2 SW Atlantic salmon illustrating: End of freshwater growth, summer growth (grey line), winter growth (black line at sea) and the annual zones during growth at sea (picture resolution 2088x1550 pixels).
Table 1. Bag net catches of Atlantic salmon at Stupodden (58°01´N; 7°44´E) , situated one-kilometre south-west of the outlet of River Mandalselva, Norway. Year 2004 2005 2006 2007 2008 2009 2010 Sum
2
1 SW 8 7 4 1
2 22
2 SW 24 25 31 40 24 11 6 161
3 SW 2 1 2 1 1 7
4 SW
1
1
Previous spawners 6 12 14 7 2 5 1 47
Not aged 1
Escaped farmed salmon 1
1 1
1 1
1 4
3
Sum 41 45 50 53 28 17 11 245
Fauna norvegica 36: 1-7. 2016
focus to the scale margin (Fig. 1). The end of the freshwater growth zone was identified by a substantial increase in inter-circuli distances. The seawinter bands of the scales were identified by short inter-circuli distances and forking of the circuli (Wootton 1998). The annual zone is a theoretical line running between the last of the narrow spaced circuli of a winter band and the first of the wide spaced circuli of the following summer band, indicating that one year of growth is completed (Shearer 1992). The start of an annual growth zone was identified by the first continuous circulus cutting over the narrow spaced, incomplete circulus and/or the first widely spaced circulus after the winter band. As growth is reduced during homeward migration, narrow inter-circuli distances may be formed at the edge of the scale (Shearer 1992). Accordingly, this was not regarded as part of the last sea-winter band. The inter-circuli distances of the last four circuli in the freshwater growth zone as well as all inter-circuli distances in the marine phase were measured. The software recognized the inter-circuli distances by analysing the contrast between the dark circuli and the light spacing. Dust on the camera lens or on the scales led to some incorrect identifications by the program. Due to this all scales were controlled manually, and errors corrected. The total number of circuli deposited during the years at sea was recovered from the measurements. To quantify sampling error, two measurements (total radius and radius at smolting) were made along the longest radius axis of 10 scales from each of 36 randomly chosen individuals. Each scale was measured once. In order to quantify measurement errors, 10 randomly selected scales were measured 20 times each in random order. The ratio between the freshwater growth zone and the total scale length was used in the analysis. All measurements were carried out by a single observer to minimize error created by different observers having a slightly different technique or interpretation of where certain events occur (e.g. end of fresh water growth) on the scale. In order to allow for quantifying the relationship between fish growth and circuli deposition rates, annual growth rates were back-calculated from the scale annuli. By assuming proportional growth of scales and fish body length (e.g., Jonsson & Stenseth 1976; Dietrich & Cunjak 2007), the annual specific growth rate during first year at sea could be back-calculated from ln(Rt)–ln(Rt–1), where Rt and Rt-1 are scale annuli radius at age t and t-1, respectively. Here, t-1 represents age at smolting. First-year sea growth was used for this purpose as number of observations was highest for this growth interval, and thus allowing for the most powerful statistical analyses. The statistical tests were carried out in R (R version 2.12.0 (2010-05-31), R Development Core team 2010). In order to access the 95% confidence limits of the measurement errors, the data were re-sampled 1000 times using a non-parametric bootstrapping routine (Manly 1997). The coefficient of variation was used to estimate the measurement error compared with the numbers of repetitive measurements. For quantifying the
within-individual sampling error, the difference (bias) between respective individual scale measurements and mean of those found for 10 scales (assumed to represent the correct value) were calculated. The overall sampling error was estimated as the mean of individual-biased coefficient of variation estimated from 10 scale readings. In order to predict fish length from scale radius, linear least squares regression based on ln-transformed fish length and scale radius was used. When testing and quantifying the effect of various exogenous (water temperature) and endogenous (spawning history and sea-age) factors on the various circuli responses (number and distances), ID (unique identification for scale) was used as a random factor in linear mixed model (LME) analyses, accounting for size variation among scales sampled from the same fish (sampling error). An ordinary linear model approach was used to predict number of circuli deposited as a function of the annual specific growth rate. Because there were multiple scale measurements and only one growth measurement per individual, it was not possible to use ID as random factor in these analysis. Therefore, the mean number of circuli per individual, weighted by the inverse of the variance for the multiple scales measured per individual was used as response. LME models were fitted using the lmeprocedure available from the nlme package in R (Pinheiro et al. 2015; R Development Core team 2010), and linear models were fitted using the lme-procedure (stat package). Model selection was based on Akaike`s information criterion (AIC) following procedures available in Zuur et al. (2009). An approximate determination coefficient (R2) for the mixed models (Nagelkerke 1991) was also derived.
RESULTS Measurement errors and sampling error
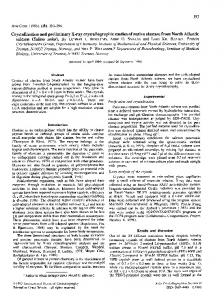
Scale measurement errors were low, on average 0.12% ± 0.03% (SD) for the total scale radius and 0.61% ± 0.15% (SD) for the scale radius at smolting (Fig. 2A). The slope of the regression of measurement error over number of readings declined with increasing number of scales read, but stabilized after ten readings. There was a positive, but not significant relationship between the scale size and the measurement error (R2 = 0.50; P>0.05). The within-individual sampling error declined at a decreasing rate when more scales were measured (Fig. 2B). The average sampling variation coefficient for ten different scales was 4.57 ± 1.65 %.(± SD, n=36).
Scale size in relation to fish length
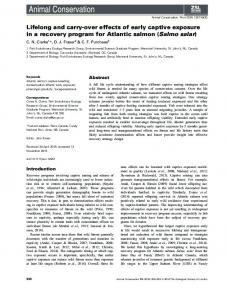
Total individual length was positively correlated with the scale radius (R2 = 0.62, Fig. 3A, Table 2a). Previous spawners added a slightly negative, but not statistically significant effect on the relationship between scale radius and fish length (Table 2a), Despite the non-significant effect from pre-spawners on scale radius, we decided to exclude such individuals in the remaining
3
Haraldstad et al.: Growth estimation in Atlantic salmon
analyses as many of the scales belonging to this group were difficult to read. We found no significant sea-age (SW) or catchdate effect on the scale radius - fish length relationship.
Circuli formation rate
The specific growth rate of Atlantic salmon during the first year at sea was positively correlated with the corresponding number of scale circuli (R2 = 0.67, Fig 3B). An additive model including sea-age and day of year to the catch date (day number) received the highest AIC support (Table 2b) in predicting the number of circuli deposited after the last sea-winterband (R2 = 0.87, Fig. 4). 1SW fish deposited a larger number of circuli (e.g., at day 180
the estimated number of circuli was 10.95) than the 2SW (5.60 circuli) and 3SW (3.94 circuli).
The relationship between circuli number and inter-circuli distances
There was no significant correlation between circuli number and mean inter-circuli distance for 1SW and MSW Atlantic salmon during the first year at sea (R2 = 0.101; P > 0.05). Furthermore, there was no significant correlation between circuli number and mean inter-circuli distance for second-year sea growth groups (R2 = 0.079; P > 0.05).
3.5 0.115 3.0 Relative bias (%)
Among-readings variance coefficient (%)
0.120
0.110
0.105
0.100
2.5
2.0
1.5
0.095
A
5
10
15
B
20
Number of readings per scale
2
4
6
8
10
Number of scales measured per individual
Figure 2. (A) Error due to measurement, CV %, as a function of number of times the radius (total scale radius) of one scale was read. (B) Error due to sampling as function of number of scales read. ln(relative bias) = -3.29 – 0.51*ln(number of scales).
55 900
800 Number of circuli
Fish length (mm)
50
700
600
45 40 35 30 25
A
1000
1400 Mean scale radius (pixels)
1800
B
1.0
1.2
1.4
1.6
Specific growth rate for 1st year at sea
Figure 3. (A) Total body length (L ± S.E., mm) and mean scale radius (X, pixels). lnL = 0.788(±0.2969) + 0.807(±0.041)lnX, P < 0.001. (B) Mean number of scale circuli deposited during the first growth year at sea (CSW1) as function of specific growth rate (gSW1). CSW1= -1.353(±1.914)+32.833(±1.516) gSW1, P < 0.001. Dashed lines show 95% confidence intervals of the predicted linear model (solid line) in both cases.
4
Fauna norvegica 36: 1-7. 2016
Table 2. (a) Model selection based on the effect of previous spawners on scale radius/fish length relationship with parameter estimate and ANOVA table for the selected model, (b) the effect of the number of circuli deposited after the last winter-band at sea with parameter estimate, with ANOVA table for the selected model, and (c) the effect of sea-age groups and circuli number on mean inter-circuli distances, with parameter estimate and ANOVA table for the selected model Model (a) Response: Scale radius Scale radius vs Fish length + Previous spawner Scale radius vs Fish length * Previous spawner Scale radius vs Fish length Parameter estimate Parameter Intercept Fish length Previous spawn
Value 317.78 1.38 -21.42
SE 57.02 0.07 13.82
ANOVA Test statistics Term Fish length Previous spawn
df 1 1
(b) Response: number of circuli deposited after the last winter-band at sea Sea age + day number Sea age * day number Sea age + number of days >7°C at Lindesnes Sea age * number of days >7°C at Lindesnes Sea age + number of days >8°C at Lindesnes Sea age * number of days >8°C at Lindesnes Parameter estimate Parameter Intercept Sea age 2 Sea age 3 Sea age 4 Day number
Value -8.65 -5.35 -7.01 -8.90 0.11
SE 3.35 0.88 1.06 1.90 0.01
ANOVA Test statistics Term Sea age Day number
df 3 1
(c) Response: Mean inter-circuli distances sea-age groups (1SW, MSW) * circuli number sea-age groups (1SW, MSW) + circuli number circuli number Parameter estimate Parameter Intercept Sea-age groups (1SW, MSW) Circuli number Interaction Parameter estimate Parameter Intercept Maximum circuli number (MSW)
Value 16.91 1.57 -0.01 -0.05 Value 12.767 0.068
SE 1.23 1.31 0.03 0.03 SE 0.400 0.016
AIC 11552.75 11554.92 11560.24
∆AIC
F-value 330.19 2.40
P-value