[10] Paolo Ciaccia, Danilo Montesi, Wilma Penzo, and Alberto Trom- betta. Imprecision and user ..... [72] Congjun Yang and King-Ip Lin. An index structure for ...
M ASARYK U NIVERSITY FACULTY OF I NFORMATICS
}
w A| y < 5 4 23 1 0 / -. , )+ ( %&' $ # !" � � �� � � � � � �
�� � �
� �� � � � �
Scalable and Distributed Similarity Search P H .D. T HESIS
Michal Batko
Brno, May 2006
Acknowledgement I would like to thank my supervisor Pavel Zezula for guidance, insight and patience during this research.
iii
Abstract This Ph.D. thesis concerns the problem of distributed indexing techniques for similarity search in metric spaces. Solutions for efficient evaluation of similarity queries, such as range or nearest neighbor queries, existed only for centralized systems. However, the amount of data produced in digital form grows exponentially every year and the traditional paradigm of one huge database system holding all the data seems to be insufficient. The distributed computing paradigm – especially the peer-to-peer data networks and GRID infrastructure – is a promising solution to the problem, since it allows to employ virtually unlimited pool of computational and storage resources. Nevertheless, the centralized indexing similarity searching structures cannot be directly used in the distributed environment and some adjustments and design modifications are needed. In this thesis, we describe a distributed metric space based index structure, which was, as far as we know, the very first distributed solution in this area. It adopts the peer-to-peer data network paradigm and implements the basic two similarity queries – the range query and the k-nearest neighbors query. The technique is fully scalable and can grow easily over practically unlimited number of computers. It is also strictly decentralized, there is no “global” centralized component, thus the emergence of hot-spots is minimized. The properties of the structure are verified experimentally and we also provide a comprehensive comparison of this method with another three distributed metric space indexing techniques that were proposed so far.
Supervisor: prof. Ing. Pavel Zezula, CSc.
v
Keywords index structures distributed computing scalability peer-to-peer networks metric space similarity search range query nearest neighbor query
vii
Contents 1 Introduction . . . . . . . . . . . . . . . . . . . . . . 2 The Similarity Search Problem . . . . . . . . . . . 2.1 The Metric Space . . . . . . . . . . . . . . . . 2.2 Distance Measures . . . . . . . . . . . . . . . 2.2.1 Minkowski Distances . . . . . . . . . 2.2.2 Quadratic Form Distance . . . . . . . 2.2.3 Edit Distance . . . . . . . . . . . . . . 2.2.4 Tree Edit Distance . . . . . . . . . . . 2.2.5 Jacard’s Coefficient . . . . . . . . . . . 2.2.6 Hausdorff Distance . . . . . . . . . . . 2.2.7 Time Complexity . . . . . . . . . . . . 2.3 Similarity Queries . . . . . . . . . . . . . . . . 2.3.1 Range Query . . . . . . . . . . . . . . 2.3.2 Nearest-Neighbor Query . . . . . . . 2.3.3 Reverse Nearest-Neighbor Query . . 2.3.4 Similarity Join . . . . . . . . . . . . . . 2.3.5 Combinations of Queries . . . . . . . 2.3.6 Complex Similarity Queries . . . . . . 3 The Scalability Challenge . . . . . . . . . . . . . . 3.1 Basic Partitioning Principles . . . . . . . . . . 3.1.1 Ball Partitioning . . . . . . . . . . . . . 3.1.2 Generalized Hyperplane Partitioning 3.1.3 Excluded Middle Partitioning . . . . . 3.2 Avoiding Distance Computations . . . . . . . 3.2.1 Object-Pivot Distance Constraint . . . 3.2.2 Range-Pivot Distance Constraint . . . 3.2.3 Pivot-Pivot Distance Constraint . . . . 3.2.4 Double-Pivot Distance Constraint . . 3.2.5 Pivot Filtering . . . . . . . . . . . . . . 3.3 Dynamic Index Structures . . . . . . . . . . . 1
. . . . . . . . . . . . . . . . . . . . . . . . . . . . . .
. . . . . . . . . . . . . . . . . . . . . . . . . . . . . .
. . . . . . . . . . . . . . . . . . . . . . . . . . . . . .
. . . . . . . . . . . . . . . . . . . . . . . . . . . . . .
. . . . . . . . . . . . . . . . . . . . . . . . . . . . . .
. . . . . . . . . . . . . . . . . . . . . . . . . . . . . .
5 9 11 13 14 15 16 17 18 19 19 20 20 21 22 23 24 24 27 28 29 29 30 31 31 33 36 37 39 41
4
5
2
3.3.1 M-tree . . . . . . . . . . . . . . . . . . . . . . . . 3.3.2 D-index . . . . . . . . . . . . . . . . . . . . . . . 3.3.3 Scalability Experiments . . . . . . . . . . . . . . 3.4 Research Objective . . . . . . . . . . . . . . . . . . . . . Distributed Index Structures . . . . . . . . . . . . . . . . . . 4.1 Scalable and Distributed Data Structures . . . . . . . . . 4.1.1 Distributed Linear Hashing . . . . . . . . . . . . 4.1.2 Distributed Random Tree . . . . . . . . . . . . . 4.1.3 Distributed Dynamic Hashing . . . . . . . . . . 4.1.4 Scalable Distributed Order Preserving Data Structures . . . . . . . . . . . . . . . . . . . . . . . . . 4.2 Unstructured Peer-to-Peer Networks . . . . . . . . . . . 4.2.1 Napster . . . . . . . . . . . . . . . . . . . . . . . 4.2.2 Gnutella . . . . . . . . . . . . . . . . . . . . . . . 4.3 Distributed Hash Table Peer-to-Peer Networks . . . . . 4.3.1 Content-Addressable Network . . . . . . . . . . 4.3.2 Chord . . . . . . . . . . . . . . . . . . . . . . . . 4.4 Tree-based Peer-to-Peer Networks . . . . . . . . . . . . 4.4.1 P-Grid . . . . . . . . . . . . . . . . . . . . . . . . 4.4.2 P-Tree . . . . . . . . . . . . . . . . . . . . . . . . 4.5 Multi-dimensional Range Queries . . . . . . . . . . . . 4.5.1 Space-filling Curves with Range Partitioning . . 4.5.2 Multidimensional Rectangulation with kd-trees 4.6 Nearest Neighbors Queries . . . . . . . . . . . . . . . . 4.6.1 pSearch . . . . . . . . . . . . . . . . . . . . . . . 4.6.2 Small-World Access Methods . . . . . . . . . . . GHT* – Native Peer-to-Peer Similarity Search Structure . . 5.1 Architecture . . . . . . . . . . . . . . . . . . . . . . . . . 5.2 Address Search Tree . . . . . . . . . . . . . . . . . . . . 5.3 Storage Management . . . . . . . . . . . . . . . . . . . . 5.3.1 Bucket Splitting . . . . . . . . . . . . . . . . . . . 5.3.2 Choosing Pivots . . . . . . . . . . . . . . . . . . . 5.4 Insertion of Objects . . . . . . . . . . . . . . . . . . . . . 5.5 Range Search . . . . . . . . . . . . . . . . . . . . . . . . . 5.6 Nearest-Neighbors Search . . . . . . . . . . . . . . . . . 5.7 Deletions and Updates of Objects . . . . . . . . . . . . . 5.8 Image Adjustment . . . . . . . . . . . . . . . . . . . . . 5.9 Logarithmic Replication Strategy . . . . . . . . . . . . .
41 46 50 52 55 56 57 58 60 60 61 62 62 63 64 65 66 66 67 68 68 69 69 70 70 73 74 75 76 77 78 78 79 80 82 84 85
5.10 Joining the Peer-to-Peer Network . . . . . . . . . . . . 5.11 Leaving the Peer-to-Peer Network . . . . . . . . . . . 6 GHT* Evaluation . . . . . . . . . . . . . . . . . . . . . . . . 6.1 Datasets and Computing Infrastructure . . . . . . . . 6.2 Performance of Storing Data . . . . . . . . . . . . . . . 6.3 Performance of Similarity Queries . . . . . . . . . . . 6.3.1 Global Costs . . . . . . . . . . . . . . . . . . . . 6.3.2 Parallel Costs . . . . . . . . . . . . . . . . . . . 6.3.3 Comparison of Range and Nearest-Neighbors Search Algorithms . . . . . . . . . . . . . . . . 6.4 Data Volume Scalability . . . . . . . . . . . . . . . . . 7 Scalability Comparison of Distributed Similarity Search 7.1 MCAN . . . . . . . . . . . . . . . . . . . . . . . . . . . 7.2 M-Chord . . . . . . . . . . . . . . . . . . . . . . . . . . 7.3 VPT* . . . . . . . . . . . . . . . . . . . . . . . . . . . . 7.4 Comparison Background . . . . . . . . . . . . . . . . . 7.5 Scalability with Respect to the Size of the Query . . . 7.6 Scalability with Respect to the Size of Datasets . . . . 7.7 Number of Simultaneous Queries . . . . . . . . . . . . 7.8 Comparison Summary . . . . . . . . . . . . . . . . . . 8 Conclusions . . . . . . . . . . . . . . . . . . . . . . . . . . . 8.1 Summary . . . . . . . . . . . . . . . . . . . . . . . . . . 8.2 Research Directions . . . . . . . . . . . . . . . . . . . . Bibliography . . . . . . . . . . . . . . . . . . . . . . . . . . . . .
. . . . . . . .
86 87 89 89 90 93 93 97
. . . . . . . . . . . . . . .
102 104 107 108 110 112 114 115 122 124 125 129 130 130 132
3
Chapter 1
Introduction The search problem is constrained in general by the type of data stored in the underlying database, the method of comparing individual data instances, and the specification of the query by which users express their information needs. The traditional approach, typical for common database systems, applies the search operation to structured (attribute-type) data. Then, when a query is given, the records exactly matching the query are returned. Complex data types – such as images, videos, time series, text documents, DNA sequences, etc. – are becoming increasingly important in modern data processing applications. A common type of searching in such applications is based on a gradual rather than the exact relevance, so it is called the similarity or the content-based retrieval. The notion, what does the similarity mean in particular, may vary greatly between different data domains, applications or even from one user to another. Treating data collections as metric objects brings a great advantage in generality, because many data classes and information seeking strategies conform to the metric view. Accordingly, a single metric indexing technique can be applied to many specific search problems quite different in nature. In this way, the important extensibility property of indexing structures is automatically satisfied. An indexing scheme that allows various forms of queries, or which can be modified to provide additional functionality, is of more value than an indexing scheme otherwise equivalent in power or even better in certain respects, but which cannot be extended. Because of the solid mathematical foundations underlying the notion of metric space, straightforward but precise partitioning and pruning rules can be constructed. This is very important for developing index structures, especially in cases where query execution costs 5
1. I NTRODUCTION are not only I/O-bound but also CPU-bound. Many metric index structures have been proposed and their results demonstrate significant speed-up (both in terms of distance computations and disk-page reads) in comparison with the sequential search. Unfortunately, the search costs are also linearly increasing with the size of the dataset. This means that when the data file grows, sooner or later the response time becomes intolerable. On the other hand, it is estimated that 93% of data now produced is in a digital form. The amount of data added each year exceeds exabyte (i.e. 1018 bytes) and it is estimated to grow exponentially. In order to manage similarity search in multimedia data types such as plain text, music, images, and video, this trend calls for putting equally scalable infrastructures in motion. In this respect, the GRID infrastructures and the Peer-to-Peer communication paradigm are quickly gaining in popularity due to their scalability and selforganizing nature, forming bases for building large-scale similarity search indexes at low costs. Most of the numerous peer-to-peer search techniques proposed in the recent years have focused on the single-key retrieval. Since the retrieved records either exist (and then they are retrieved) or they do not, there are no problems with the query relevance or degree of matching. Although techniques for range or nearest neighbor queries were proposed very recently, they are usually limited to a specialized domain of objects or efficient only for a specific application and they lack the extensibility of the metric space approach. Thus, the objective of our work is to combine the extensibility of the metric space similarity search with the power and high scalability of the peer-to-peer data networks employing their virtually unlimited storage and computational resources. This thesis is organized as follows. Chapter 2 embraces a background and definitions of the similarity search problem in metric spaces. In Chapter 3 we discuss the problem of scalability, i.e. the ability to maintain a reasonable search response while the stored dataset grows. Chapter 4 provides a survey of existing distributed index-searching structures. We focus mainly on the scalable and distributed index structures paradigm, which consequently evolved into the peer-to-peer data networks. In the next stage, we propose a novel peer-to-peer based technique for similarity search in met6
1. I NTRODUCTION ric spaces that scales up with (nearly) constant search response time. Exhaustive experimental confirmation of its properties is provided in Chapter 6. Finally, we describe another variant of our structure along with another two recently published distributed similarity search structures in Chapter 7 and show the results of a comprehensive experimental comparison between them. We conclude in Chapter 8 and outline the future research directions.
7
Chapter 2
The Similarity Search Problem Searching has always been one of the most prominent data processing operations. However, the exact-match retrieval, typical for traditional databases, is neither feasible nor meaningful for data types in the present digital age. The reason is that the constantly expanding data of modern digital collections lacks structure and precision. Because of this, what constitutes a match to a request is often different from that implied in more traditional, well-established areas. A very useful, if not necessary, search paradigm is to quantify the proximity, similarity, or dissimilarity of a query object versus the objects stored in a database to be searched. Roughly speaking, objects that are near a given query object form the query response set. A useful abstraction for nearness is provided by the mathematical notion of metric space [42]. We consider the problem of organizing and searching large datasets from the perspective of generic or arbitrary metric spaces, sometimes conveniently labelled distance spaces. In general, the search problem can be described as follows: Problem 2.0.1 Let D be a domain, d a distance measure on D, and (D, d) a metric space. Given a set X ⊆ D of n elements, preprocess or structure the data so that proximity queries are answered efficiently. From a practical point of view, X can be seen as a file (a dataset or a collection) of objects that takes values from the domain D, with d as the proximity measure, i.e. the distance function defined for an arbitrary pair of objects from D. Though several types of similarity queries exist and others are expected to appear in the future, the basic types are known as the similarity range and the nearest neighbor(s) queries. In a distance space, the only possible operation on data objects is the computation of a distance function on pairs of objects which 9
2. T HE S IMILARITY S EARCH P ROBLEM satisfies the triangle inequality. In contrast, objects in a coordinate space – coordinate space being a special case of metric space – can be seen as vectors. Such spaces satisfy some additional properties that can be exploited in storage (index) structure designs. Naturally, the distance between vectors can be computed, but each vector can also be uniquely located in coordinate space. Further, vector representation allows us to perform operations like vector addition and subtraction. Thus, new vectors can be constructed from prior vectors. For more information, see e.g., [26, 7] for surveys of techniques that exploit the properties of coordinate space. Since many data domains in use are represented by vectors, there might seem to be little point in hunting efficient index structures in pure metric spaces, where the number of possible geometric properties would seem limited. The following discussion should clarify the issue and provide sufficient evidence of the importance of the distance searching problem. Applications managing non-vector data like character strings (natural language words, DNA sequences, etc.) do exist, and their number is growing. But even when the objects processed are vectors, the properties of the underlying coordinate space cannot always be easily exploited. If the individual vectors are correlated, i.e. there is cross-talk between them, the neighborhood of the vectors seen through the lens of the distance measure between them will not map directly to their coordinate space, and vice versa. Distance functions which allow user-defined weights to be specified better reflect the user’s perception of the problem and are therefore preferable. This occurs, for instance, when searching images using color similarity, where cross-talk between color components is a factor that must be taken into account. Existing solutions for searching the coordinate space suffer from so-called dimensionality curse – such structures either become slower than naive algorithms with linear search times or they use too much space. Though the structure of indexed data may be intrinsically much simpler (the data may, e.g., lie in a lower-dimensional hyperplane), this is typically difficult to ascertain. Moreover, some spaces have coordinates restricted to small sets of possible values (perhaps even binary), so that the use of such coordinates is not necessarily helpful. 10
2. T HE S IMILARITY S EARCH P ROBLEM Depending on the data objects, the distance measure and the dimensionality of a given space, we agree that the use of coordinates can be advantageous in special cases, resulting in non-extensible solutions. But we also agree with [15], that to strip the problem down to its essentials by only considering distances, it is reasonable to find the minimal properties needed for fast algorithms. In summary, the primary reasons for looking at the distance data search problem seriously are the following: 1. There are numerous applications where the proximity criteria offer no special properties but distance, so a metric search becomes the sole option. 2. Many specialized solutions for proximity search perform no better than indexing techniques based on distances. Metric search thus forms a viable alternative. 3. If a good solution utilizing generic metric space can be found, it will provide high extensibility. It has the potential to work for a large number of existing proximity measures, as well as many others to be defined in the future.
2.1 The Metric Space A similarity search can be seen as a process of obtaining data objects in order of their distance or dissimilarity from a given query object. It is a kind of sorting, ordering, or ranking of objects with respect to the query object, where the ranking criterion is the distance measure. Though this principle works for any distance measure, we restrict the possible set of measures by the metric postulates. Suppose a metric space M = (D, d) defined for a domain of objects (or the objects’ keys or indexed features) D and a total (distance) function d. In this metric space, the properties of the function d : D × D 7→ R, sometimes called the metric space postulates, are typically characterized as:
11
2. T HE S IMILARITY S EARCH P ROBLEM ∀x, y ∈ D, d(x, y) ≥ 0
non-negativity,
∀x, y ∈ D, d(x, y) = d(y, x)
symmetry,
∀x, y ∈ D, x = y ⇔ d(x, y) = 0
identity,
∀x, y, z ∈ D, d(x, z) ≤ d(x, y) + d(y, z)
triangle inequality.
For brevity, some authors call the metric function simply the metric. There are also several variations of metric spaces. In order to specify them more easily, we first transform the metric space postulates above into an equivalent form in which the identity postulate is decomposed into (p3) and (p4): (p1)
∀x, y ∈ D, d(x, y) ≥ 0
non-negativity,
(p2)
∀x, y ∈ D, d(x, y) = d(y, x)
symmetry,
(p3)
∀x ∈ D, d(x, x) = 0
reflexivity,
(p4)
∀x, y ∈ D, x 6= y ⇒ d(x, y) > 0
positiveness,
(p5)
∀x, y, z ∈ D, d(x, z) ≤ d(x, y) + d(y, z)
triangle inequality.
If the distance function does not satisfy the positiveness property (p4), it is called a pseudo-metric. In this thesis, we do not consider pseudo-metric functions separately, because such functions can be transformed to the standard metric by regarding any pair of objects with zero distance as a single object. Such a transformation is correct: if the triangle inequality (p5) holds, we can prove that d(x, y) = 0 ⇒ ∀z ∈ D, d(x, z) = d(y, z). Specifically, by combining the triangle inequalities d(x, z) ≤ d(x, y) + d(y, z) and d(y, z) ≤ d(x, y) + d(x, z), we get d(x, z) = d(y, z), if d(x, y) = 0. If, on the other hand, the symmetry property (p2) does not hold, we talk about a quasi-metric. For example, let the objects be different 12
2. T HE S IMILARITY S EARCH P ROBLEM locations within a city, and the distance function the physical distance a car must travel between them. The existence of one-way streets implies the function must be asymmetrical. There are techniques to transform asymmetric distances into symmetric form, for example: dsym (x, y) = dasym (x, y) + dasym (y, x). To round out our list of possible metric distance function variants, we conclude this section with a version which satisfies a stronger constraint on the triangle inequality. It is called the super-metric or the ultra-metric. Such a function satisfies the following tightened triangle inequality: ∀x, y, z ∈ D, d(x, z) ≤ max{d(x, y), d(y, z)}. The geometric characterization of the super-metric requires every triangle to have at least two sides of equal length, i.e. to be isosceles, which implies that the third side must be shorter than the others. Ultra-metrics are widely used in the field of biology, particularly in evolutionary biology. By comparing the DNA sequences of pairs of species, evolutionary biologists obtain an estimate of the time which has elapsed since the species separated. From these distances, an evolutionary tree (sometimes called phylogenetic tree) can be reconstructed, where the weights of the tree edges are determined by the time elapsed between two speciation events [60, 61]. Having a set of extant species, the evolutionary tree forms an ultra-metric tree with all the species stored in leaves and an identical distance from root to leaves. The ultra-metric tree is a model of the underlying ultra-metric distance function.
2.2 Distance Measures The distance functions of metric spaces represent a way of quantifying the closeness of objects in a given domain. In the following, we present examples of distance functions used in practice on various types of data. Distance functions are often tailored to specific applications or a class of possible applications. In practice, distance functions are specified by domain experts, however, no distance function restricts the range of queries that can be asked with this metric. 13
2. T HE S IMILARITY S EARCH P ROBLEM Depending on the character of values returned, distance measures can be divided into two groups: • discrete – distance functions which return only a small (predefined) set of values, and • continuous – distance functions in which the cardinality of the set of values returned is very large or infinite. An example of a continuous function is the Euclidean distance between vectors, while the edit distance on strings represents a discrete function. Some metric structures are applicable only in the area of discrete metric functions. In the following, we mainly survey metric functions used for complex data types like multidimensional vectors, strings or sets. However, even domains as simple as the real numbers (D = R) can be seen in terms of metric data, by defining the distance function as d = |oi − oj |, that is, as the absolute value of the difference of any pair of numbers (oi , oj ) from D. 2.2.1 Minkowski Distances The Minkowski distance functions form a whole family of metric functions, designated as the Lp metrics, because the individual cases depend on the numeric parameter p. These functions are defined on n-dimensional vectors of real numbers as: v u n uX p Lp [(x1 , . . . , xn ), (y1 , . . . , yn )] = t |xi − yi |p , i=1
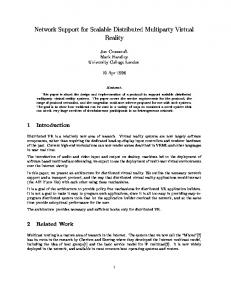
where the L1 metric is known as the Manhattan distance (also the CityBlock distance), the L2 distance denotes the well-known Euclidean distance, and the L∞ = maxni=1 |xi −yi | is called the maximum distance, the infinite distance or the chessboard distance. Figure 2.1 illustrates some members of the Lp family, where the shapes denote points of a 2-dimensional vector space that are at the same distance from the central point. The Lp metrics find use in a number of cases where numerical vectors have independent coordinates, e.g., in measurements of scientific experiments, environmental observations, or the study of different aspects of the business process. 14
2. T HE S IMILARITY S EARCH P ROBLEM
L1
L2
L6
Loo
Figure 2.1: The sets of points at a constant distance from the central point for different Lp distance functions. 2.2.2 Quadratic Form Distance Several applications using vector data have individual components, i.e. feature dimensions, correlated, so a kind of cross-talk exists between individual dimensions. Consider, for example, color histograms of images, where each dimension represents a specific color. To compute a distance, the red component, for example, must be compared not only with the dimension representing the red color, but also with the pink and orange, because these colors are similar. The Euclidean distance L2 does not reflect any correlation of features of color histograms. A distance model that has been successfully applied to image databases in [25], and that has the power to model dependencies between different components of features, is provided by the quadratic form distance functions in [32, 64]. In this approach, the distance measure of two n-dimensional vectors is based on an n×n positive semi-definite matrix M = [mi,j ], where the weights mi,j denote how strong the connection between two components i and j of vectors ~x and ~y is, respectively. These weights are usually normalized so that 0 ≤ mi,j ≤ 1 with the diagonal elements mi,i = 1. The following expression represents a generalized quadratic distance measure dM , where the superscript T denotes vector transposition: p dM (~x, ~y) = (~x − ~y )T · M · (~x − ~y ). Observe that this definition of distance also subsumes the Euclidean distance when the matrix M is equal to the identity matrix. Also the weighted Euclidean distance measure can be expressed using the matrix with non-zero elements on the diagonal representing weights of the individual dimensions, i.e. M = diag(w1, . . . , wn ). Applying 15
2. T HE S IMILARITY S EARCH P ROBLEM such a matrix, the quadratic form distance formula turns out to be as follows, yielding the general formula for the weighted Euclidean distance: v u n uX dM (~x, ~y ) = t wi (xi − yi )2 . i=1
As an example, consider simplified color histograms with three different colors (blue, red, orange) represented as 3-D vectors. Assuming three normalized histograms of a pure red image ~x = (0, 1, 0), a pure orange image ~y = (0, 0, 1) and a pure blue image ~z = (1, 0, 0), the √ evaluates to the following distances: L2 (~x, ~y ) = √ Euclidean distance 2 and L2 (~x, ~z ) = 2. This implies that the orange and the blue images are equidistant from the red. However, human color perception is quite different and perceives red and orange to be more alike than red and blue. This can be modeled √ with the matrix M shown below, yielding √ a ~x, ~y distance equal to 0.2, while the distance ~x, ~z evaluates to 2. 1.0 0.0 0.0 M = 0.0 1.0 0.9 0.0 0.9 1.0
The quadratic form distance measure may be computationally expensive, depending upon the dimensionality of the vectors. Color image histograms are typically high-dimensional vectors consisting of 64 or 256 distinct colors (vector dimensions). 2.2.3 Edit Distance
The closeness of sequences of symbols (strings) can be effectively measured by the edit distance, also called the Levenshtein distance, presented in [50]. The distance between two strings x = x1 · · · xn and y = y1 · · · ym is defined as the minimum number of atomic edit operations (insert, delete, and replace) needed to transform string x into string y. The atomic operations are defined formally as follows: • insert the character c into the string x at the position i: ins(x, i, c) = x1 x2 · · · xi cxi+1 · · · xn ; • delete the character at the position i from the string x: del(x, i) = x1 x2 · · · xi−1 xi+1 · · · xn ; 16
2. T HE S IMILARITY S EARCH P ROBLEM • replace the character at the position i in x with the new character c: replace(x, i, c) = x1 x2 · · · xi−1 cxi+1 · · · xn . The generalized edit distance function assigns weights (positive real numbers) to individual atomic operations. Hence, the distance between strings x and y is the minimum value of the sum of weighted atomic operations needed to transform x into y. If the weight of insert and delete operations differ, the edit distance is not symmetric (violating property (p2) defined in Section 2.1) and therefore not a metric function. To see why, consider the following example, where the weights of atomic operations are set as wins = 2, wdel = 1, wreplace = 1: dedit (“combine”, “combination”) = 9 – replacement e → a, insertion of t, i, o, n dedit (“combination”, “combine”) = 5 – replacement a → e, deletion of t, i, o, n
Within this thesis, we only assume metric functions, thus the weights of insert and delete operations must be the same. However, the weight of the replace operation can differ. Usually, the edit distance is defined with all weights equal to one. An excellent survey on string matching can be found in [55]. Using weighting functions, we can define a most generic edit distance which assigns different costs even to operations on individual characters. For example, the replacement a → b can be assigned a different weight than a → c. To retain the metric postulates, some additional limits must be placed on weight functions, e.g. symmetry of substitutions – the cost of a → b must be the same as the cost of b → a. 2.2.4 Tree Edit Distance The tree edit distance is a well-known proximity measure for trees, extensively studied in [30, 16]. The tree edit distance function defines 17
2. T HE S IMILARITY S EARCH P ROBLEM a distance between two tree structures as the minimum cost needed to convert the source tree to the target tree using a predefined set of tree edit operations, such as the insertion or deletion of a node. In fact, the problem of computing the distance between two trees is a generalization of the edit distance to labeled trees. The individual cost of edit operations (atomic operations) may be constant for the whole tree, or may vary with the level in the tree at which the operation is carried out. The reason for having different weights for tree levels is that the insertion of a single node near the root may be more significant than adding a new leaf node. This will, of course, depend on the application domain. Several strategies for setting costs and computing the tree edit distance are described in the doctoral thesis by Lee [48]. Since XML documents are typically modeled as rooted labeled trees, the tree edit distance can also be used to measure the structural dissimilarity of XML documents. 2.2.5 Jacard’s Coefficient Let us now focus on a different type of data and present a similarity measure that is applicable to sets. Assuming two sets A and B, Jacard’s coefficient is defined as follows: d(A, B) = 1 −
|A ∩ B| . |A ∪ B|
This distance function is simply based on the ratio between the cardinalities of intersection and union of the compared sets. As an example of an application that deals with sets, suppose we have access to a log file of web addresses (URLs) accessed by visitors to an Internet Caf´e. Along with the addresses, visitor identifications are also stored in the log. The behavior of a user browsing the Internet can be expressed as the set of visited network sites and Jacard’s coefficient can be applied to assess the similarity (or dissimilarity) of individual users’ search interests. An application of this metric to vector data is called the Tanimoto similarity measure dT S , (see for example [43]), defined as: dT S (~x, ~y ) = 18
~x · ~y , k~xk2 + k~y k2 − ~x · ~y
2. T HE S IMILARITY S EARCH P ROBLEM where ~x · ~y is the scalar product of ~x and ~y , and k~xk is the Euclidean norm of ~x. 2.2.6 Hausdorff Distance An even more complicated distance measure defined on sets is the Hausdorff distance [37]. In contrast to Jackard’s coefficient, where any two elements of sets must be either equal or completely distinct, the Hausdorff distance matches elements based upon a distance function de . Specifically, the Hausdorff distance is defined as follows. Assume: dp (x, B) = inf de (x, y), y∈B
dp (A, y) = inf de (x, y), x∈A
ds (A, B) = sup dp (x, B), x∈A
ds (B, A) = sup dp (A, y). y∈B
Then the Hausdorff distance over sets A, B is: d(A, B) = max{ds (A, B), ds (B, A)}. The distance de (x, y) between two elements of sets A and B can be arbitrary, e.g. the Euclidean distance, and is application-specific. Succinctly put, the Hausdorff distance measures the extent to which each point of the “model” set A lies near some point of the “image” set B and vice versa. A typical application is the comparison of shapes in image processing, where each shape is defined by a set of points in a 2-dimensional space. 2.2.7 Time Complexity In general, computing a distance is a nontrivial process which will certainly be much more computationally intensive than a keyword comparison as used in traditional search structures. For example, the Lp norms (metrics) are computed in linear time dependent on the dimensionality n of the space. However, the quadratic form distance is much more expensive because it involves multiplications by 19
2. T HE S IMILARITY S EARCH P ROBLEM a matrix M. Thus, the time complexity in principle is O(n2 + n). Existing dynamic programming algorithms which evaluate the edit distance on two strings of length n and m have time complexity O(nm). Tree edit distance is even more demanding and has a worstcase time complexity of O(n4 ), where n refers to the number of tree nodes. For more details see for example [48]. Similarity metrics between sets are also very time-intensive to evaluate. The Hausdorff distance has a time complexity of O(nm) for sets of size n and m. A more sophisticated algorithm by [3] can reduce its complexity to O((n + m)log(n + m)). In summary, the high computational complexity of metric distance functions gives rise to an important objective for metric index structures, namely minimizing the number of distance evaluations.
2.3 Similarity Queries A similarity query is defined explicitly or implicitly by a query object q and a constraint on the form and extent of proximity required, typically expressed as a distance. The response to a query returns all objects which satisfy the selection conditions, presumed to be those objects close to the given query object. In the following, we first define elementary types of similarity queries, and then discuss possibilities for combining them. 2.3.1 Range Query Probably the most common type of a similarity query is the similarity range query R(q, r). The query is specified by a query object q ∈ D, with some query radius r as the distance constraint. The query retrieves all objects found within distance r of q, formally: R(q, r) = {o ∈ X, d(o, q) ≤ r}. If needed, individual objects in the response set can be ranked according to their distance with respect to q. Observe that the query object q need not exist in the collection X ⊆ D to be searched, and the only restriction on q is that it belongs to the metric domain D. For 20
2. T HE S IMILARITY S EARCH P ROBLEM
o4
r
o1
o4
3.3
2.5
o2
q
q
o1 o2
3.3
2.0 o3
o3
o5 o6
o5 (a)
o6
(b)
Figure 2.2: (a) Range query R(q, r) and (b) nearest neighbor query 3NN(q). convenience, Figure 2.2a shows an example of a range query. In a geographic application, a range query can formulate the requirement: Give me all museums within a distance of two kilometers from my hotel. When the search radius is zero, the range query R(q, 0) is called a point query or exact match. In this case, we are looking for an identical copy (or copies) of the query object q. The most usual use of this type of query is in delete algorithms, when we want to locate an object to remove from the database. 2.3.2 Nearest-Neighbor Query Whenever we want to search for similar objects using a range search, we must specify a maximal distance for objects to qualify. But it can be difficult to specify the radius without some knowledge of the data and the distance function. For example, the range r = 3 of the edit distance metric represents less than four edit operations between compared strings. This has a clear semantic meaning. However, a distance of two color-histogram vectors of images is a real number whose quantification cannot be so easily interpreted. If too small a query radius is specified, the empty set may be returned and a new search with a larger radius will be needed to get any result. On the other hand, if query radii are too large, the query may be computationally expensive and the response sets contain many nonsignificant objects. 21
2. T HE S IMILARITY S EARCH P ROBLEM An alternative way to search for similar objects is to use nearest neighbor queries. The elementary version of this query finds the closest object to the given query object, that is the nearest neighbor of q. The concept can be generalized to the case where we look for the k nearest neighbors. Specifically, kNN(q) query retrieves the k nearest neighbors of the object q. If the collection to be searched consists of fewer than k objects, the query returns the whole database. Formally, the response set can be defined as follows: kNN(q) = {R ⊆ X, |R| = k ∧ ∀x ∈ R, y ∈ X − R : d(q, x) ≤ d(q, y)}. When several objects lie at the same distance from the k-th nearest neighbor, the ties are solved arbitrarily. Figure 2.2b illustrates the situation for a 3NN(q) query. Here the objects o1 , o3 are both at distance 3.3 and the object o1 is chosen as the third nearest neighbor (at random), instead of o3 . If we continue with our geographic application, we can pose a query: Tell me which three museums are the closest to my hotel. 2.3.3 Reverse Nearest-Neighbor Query In many situations, it is interesting to know how a specific object is perceived or ranked in terms of distance by other objects in the dataset, i.e., which objects view the query object q as their nearest neighbor. This is known as a reverse nearest neighbor search. The generic version, conveniently designated kRNN(q), returns all objects with q among their k nearest neighbors. An example is illustrated in Figure 2.3a, where the dotted circles denote the distance to the second nearest neighbor of objects oi . Objects satisfying the 2RNN(q) query, that is those objects with q among their two nearest neighbors, are represented by black points. Recent work, such as [45, 67, 72, 66, 44], has highlighted the importance of reverse nearest-neighbor queries in decision support systems, profile-based marketing, document repositories, and management of mobile devices. The response set of the general kRNN(q) query may be defined as follows: kRNN(q) = {R ⊆ X, ∀x ∈ R : q ∈ kNN(x) ∧ ∀x ∈ X − R : q 6∈ kNN(x)}. 22
2. T HE S IMILARITY S EARCH P ROBLEM 0
2
3
o1
o1
o4
1
o4 o2
q
o2 o3
o3 o5
o5 o6
o6 (a)
(b)
Figure 2.3: (a) A reverse nearest neighbor query 2RNN(q) and (b) a similarity self join query SJ(2.5). Qualifying objects are filled. Observe that even an object located far from the query object q can belong to the kRNN(q) response set. At the same time, an object near q need not necessarily be a member of the kRNN(q) result. This characteristic of the reverse nearest neighbor search is called the nonlocality property. A specific query can ask for: all hotels with a specific museum as the nearest cultural heritage site. 2.3.4 Similarity Join The development of Internet services often requires the integration of heterogeneous sources of data. Such sources are typically unstructured whereas the intended services often require structured data. An important challenge here is to provide consistent and error-free data, which entails some kind of data cleaning or integration typically implemented by a process called a similarity join. The similarity join between two datasets X ⊆ D and Y ⊆ D retrieves all pairs of objects (x ∈ X, y ∈ Y ) whose distance does not exceed a given threshold µ ≥ 0. Specifically, the result of the similarity join J(X, Y, µ) is de23
2. T HE S IMILARITY S EARCH P ROBLEM fined as: J(X, Y, µ) = {(x, y) ∈ X × Y : d(x, y) ≤ µ} If µ = 0, we get the traditional natural join. If the datasets X and Y coincide, i.e. X = Y , we talk about the similarity self join and denote it as SJ(µ) = J(X, X, µ), where X is the searched dataset. Figure 2.3b presents an example of a similarity self join SJ(2.5). For illustration, consider a bibliographic database obtained from diverse resources. In order to clean the data, a similarity join request might identify all document titles with an edit distance smaller than two. Another application might maintain a collection of hotels and a collection of museums. The user might wish to find all pairs of hotels and museums which are a five minute walk apart. 2.3.5 Combinations of Queries As an extension of the query types defined above, we can define additional types of queries as combinations of the previous ones. For example, we might combine a range query with a nearest-neighbor query to get kNN(q, r) with the response set: kNN(q, r) = {R ⊆ X, |R| ≤ k ∧ ∀x ∈ R, y ∈ X − R : d(q, x) ≤ d(q, y) ∧ d(q, x) ≤ r}. In fact, we have constrained the result from two sides. First, all objects in the result-set should lie at a distance not greater than r, and if there are more than k of them, just the first (i.e., the nearest) k are returned. By analogy, we can combine a similarity self join and a nearest neighbor search. In such queries, we limit the number of pairs returned for a specific object to the value k. 2.3.6 Complex Similarity Queries Efficient processing of queries consisting of more than one similarity predicate, i.e., complex similarity queries, differs substantially from traditional (Boolean) query processing. The problem was studied first by [22, 23]. The basic lesson learned is that the similarity score (or grade) a retrieved object receives as a whole depends not only on the scores it gets for individual predicates, but also on how such scores 24
2. T HE S IMILARITY S EARCH P ROBLEM are combined. In order to understand the problem, consider a query for circular shapes of red color. In order to find the best match, it is not enough to retrieve the best matches for the color features and the shapes. Naturally, the best match for the whole query need not be the best match for a single (color or shape) predicate. To this aim, [22] has proposed the so-called A0 algorithm which solves the problem. This algorithm assumes that for each query predicate we have an index structure able to return objects of decreasing similarity. For every predicate i, the algorithm successively creates a set Xi containing objects which best match the query predicate. This building phase T continues until all sets Xi contain at least k common objects, i.e. | i Xi | = k. This implies that the cardinalities of sets Xi are not known in advance, so a rather complicated incremental similarity search is needed (please refer to [34] for details). For all S objects o ∈ i Xi , the algorithm evaluates all query predicates and establishes their final ranks. Then the first k objects are returned as a result. This algorithm is correct, but its performance is not very optimal and the expected query execution costs can be quite high. [14] have concentrated on complex similarity queries expressed through a generic language. On the other hand, they assume that query predicates are from a single feature domain, i.e. from the same metric space. Contrary to the language level that deals with similarity scores, the proposed evaluation process is based on distances between feature values, because metric indexes can use just distances to evaluate predicates. The proposed solution suggests that the index should process complex queries as a whole, evaluating multiple similarity predicates at a time. The flexibility of this approach is demonstrated by considering three different similarity languages: fuzzy standard, fuzzy algebraic and weighted sum. The possibility to implement such an approach is demonstrated through an extension of the M-tree [13]. Experimental results show that performance of the extended M-tree is consistently better than the A0 algorithm. The main drawback of this approach is that even though it is able to employ more features during the search, these features are compared using a single distance function. An extension of the M-tree [12] which goes further is able to compare different features with arbitrary distance functions. This index structure outperforms the A0 algorithm as well. 25
2. T HE S IMILARITY S EARCH P ROBLEM A similarity algebra with weights has been introduced in [10]. This is a generalization of relational algebra to allow the formulation of complex similarity queries over multimedia databases. The main contribution of this work is that it combines within a single framework several relevant aspects of the similarity search, such as new operators (Top and Cut), weights to express user preferences, and scores to rank search results.
26
Chapter 3
The Scalability Challenge In the previous chapter, we have explained the metric space background, which in fact gives us the notion, what the similarity search is. However, we haven’t said, how to actually evaluate the similarity queries. A naive approach to solve a basic similarity query such as a range search R(q, r) or a nearest neighbor search NN(q) is to compare the the query object q with all the stored objects, evaluating the distance between the query object and every object o in the database. Specifically, we report all objects o ∈ D that d(q, o) ≤ r for a particular range search R(q, r). The nearest neighbor is also easily obtained, if we maintain a so far q-closest object on as we scan through all the objects in the database, i.e. we assign on = o whenever d(o, q) < d(on , q). After scanning the whole dataset, the on is the nearest neighbor of the query object q. It is obvious that this approach is far from being effective, since we need to compute an expensive distance computation for each stored object and the number of those evaluations is linearly proportional to the size of database. Thus, the goal is to design and maintain some additional information allowing an enhanced performance of the search. The scalability of the similarity search is also a very important problem. Definition 3.0.1 The scalability is the ability to support larger volumes of data and more users with minimal impact on the effectiveness of the search evaluation. We say that the scalability of a problem is linear if the costs grow linearly with the size of the problem, e.g., a twice as big problem has a twice as big response as an original small problem. From this point of view, we can employ two general techniques to lower the expenses of the index search computations. The first one 27
3. T HE S CALABILITY C HALLENGE is the partitioning of the metric space, i.e. we can limit the number of objects that must be accessed while evaluating a particular index operation. In fact, the method improves the I/O scalability and we describe the general overview in Section 3.1. The second group of techniques allows us to avoid usually expensive distance computations using some previously computed distances, and thus affect the CPU scalability. The description of them can be found in Section 3.2. Both the groups are practically applicable to any generic metric space index, since they are based on the triangular inequality of the metric function only. With those basic principles a more effective similarity query evaluation is possible. In the following, we provide a brief explanation of two advanced dynamic metric index structures – the M-Tree (see Section 3.3.1) and the D-Index (see Section 3.3.2). We also provide the scalability experiment results for those two structures, which were adopted from [74], compared to the aforementioned sequential scan. From these we can deduct that the centralized indexes indeed improve the similarity search a lot with respect to the naive algorithm. However, even these advanced techniques scale linearly with the size of the problem. Thus, the response of the search becomes unacceptable at a certain point. With this respect, we lay down our scalability challenge in Section 3.4 – is it possible to achieve logarithmic or even constant scalability for a metric space indexing technique?
3.1 Basic Partitioning Principles Partitioning, in general, is one of the most fundamental principles of any storage structure, aiming at dividing the search space into sub-groups, so that once a query is given, only some of these groups are searched. Given a set S ⊆ D of objects in metric space M = (D, d), [70] defines ball partitioning and generalized hyperplane partitioning, while [73] suggests excluded middle partitioning. In the following, we briefly characterize these techniques.
28
3. T HE S CALABILITY C HALLENGE
S2
p2
dm p
dm S1 S1
S1 S2
2ρ
p
S3 S2
p1 (a)
(b)
(c)
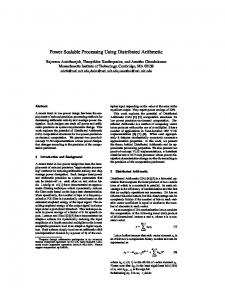
Figure 3.1: Examples of partitioning: (a) the ball partitioning, (b) the generalized hyperplane partitioning, and (c) the excluded middle partitioning. 3.1.1 Ball Partitioning Ball partitioning breaks the set S into subsets S1 and S2 using a spherical cut with respect to p ∈ D, where p is the pivot, chosen arbitrarily. Let dm be the median of {d(oi , p), ∀oi ∈ S}. Then all oj ∈ S are distributed to S1 or S2 according to the following rules: • S1 ← {oj | d(oj , p) ≤ dm } • S2 ← {oj | d(oj , p) ≥ dm } The redundant conditions ≤ and ≥ assure balance when the median value is not unique. This is accomplished by assigning each element at the median distance to one of the subsets in an arbitrary, but balanced, fashion. An example of a data space containing twenty-three objects is depicted in Figure 3.1a. The selected pivot p and the median distance dm establish the ball partitioning. 3.1.2 Generalized Hyperplane Partitioning Generalized hyperplane partitioning can be considered as an orthogonal principle to ball partitioning. This partitioning also breaks the set S into subsets S1 and S2 . This time, though, two reference objects (pivots) p1 , p2 ∈ D are arbitrarily chosen. All other objects oj ∈ S are assigned to S1 or S2 depending upon their distances from the selected pivots as follows: 29
3. T HE S CALABILITY C HALLENGE • S1 ← {oj | d(p1 , oj ) ≤ d(p2 , oj )} • S2 ← {oj | d(p1 , oj ) ≥ d(p2 , oj )} In contrast to ball partitioning, the generalized hyperplane does not guarantee a balanced split, and a suitable choice of reference points to achieve this objective is an interesting challenge. An example of a balanced split of a hypothetical dataset is given in Figure 3.1b. 3.1.3 Excluded Middle Partitioning Excluded middle partitioning [73] divides S into three subsets S1 , S2 and S3 . In principle, it is an extension of ball partitioning which has been motivated by the following fact: Though similarity queries search for objects lying within a small vicinity of the query object, whenever a query object appears near the partitioning threshold, the search process typically requires accessing both of the ball partitioned subsets. The central idea of excluded middle partitioning is therefore to leave out points near the threshold dm in defining the two subsets S1 and S2 . The excluded points form a third subset S3 . An illustration of excluded middle partitioning can be seen in Figure 3.1c, where the dark objects fall into the exclusion zone. With such an arrangement, the search for similar objects always ignores at least one of the subsets S1 or S2 , provided that the search selectivity is smaller than the thickness of the exclusion zone. Naturally, the excluded points cannot be lost, so they can either be considered to form a third subset or, if the set is large, the basis of a new partitioning process. Given the thickness of the exclusion zone 2ρ, the partitioning can be defined as follows: • S1 ← {oj | d(oj , p) ≤ dm − ρ} • S2 ← {oj | d(oj , p) > dm + ρ} • S3 ← otherwise. Figure 3.1c also depicts a situation where the split is balanced, i.e. the cardinalities of S1 and S2 are the same. However, this is not always guaranteed.
30
3. T HE S CALABILITY C HALLENGE
3.2 Avoiding Distance Computations Since the performance of similarity search in metric spaces is not only I/O, but also CPU-bound, it is very important to limit the number of distance computations as much as possible. To this aim, pruning conditions must be applied not only to avoid accessing irrelevant set of objects, but also to minimize the number of distances computed. The rationale behind such strategies is to use alreadyevaluated distances between some objects, while properly applying the metric space postulates – namely the triangle inequality, symmetry, and non-negativity – to determine bounds on distances between other objects. In this section, we describe several bounding strategies, originally proposed in [34] and refined in [35]. These techniques represent general pruning rules that are employed, in a specific form, in practically all index structures for metric spaces. The following rules thus form the basic formal background. The individual techniques described differ as to the type of distance we have available, as well as what kind of distance computation we seek to avoid. 3.2.1 Object-Pivot Distance Constraint The basic type of bounding constraint is the object-pivot distance constraint, so called because it is usually applied to leaf nodes containing the data, i.e. the metric objects of the searched collection. Figure 3.2 demonstrates a situation in which such a bounding constraint can be beneficial with respect to the trivial sequential scan computing distances to all objects. Assume a range query R(q, r) is issued (see Figure 3.2a) and the search algorithm has reached the left-most leaf node as illustrated in Figure 3.2b. At this stage, the sequential scan would examine all objects in the leaf, i.e. compute the distances d(q, o4), d(q, o6), d(q, o10 ), and decide qualifying objects. However, provided the distances d(p2 , o4 ), d(p2 , o6 ), d(p2 , o10 ) are in memory (having been computed during insertion) and the distance from q to p2 is d(q, p2), some distance evaluations can be omitted. Figure 3.3a shows a detail view of the situation. The dashed lines represent distances we do not know and the solid lines, known distances. Suppose we need to estimate the distance between the query 31
3. T HE S CALABILITY C HALLENGE
o3
o 11 d m1
o9 d m3
o5
p1 d m2 o4
p1
p3
o 10
o6
r
o1
p2
o2
q p2 o8
o7
p3
o 4 o 6 o 10 o 1 o 5 o 11 o 2 o 9
(a)
o3 o7 o8
(b)
Figure 3.2: Range search for query R(q, r): (a) from the geometric point of view, (b) algorithm accessing the left-most leaf node.
o 10 o4 o6 o4
o4
o6 o 10
r
o4
o6 o 10
r
q p2
o 10 o4 o6
o6 o 10
r
(a)
(b)
(c)
Furthest from q
q p2
Closest to q
q p2
Figure 3.3: Illustration of the object-pivot constraint: (a) our model situation, (b) the lower bound, and (c) the upper bound.
32
3. T HE S CALABILITY C HALLENGE object q and the database object o10 . Given only an object and the distance from it to another object, the object’s precise position in space cannot be determined. Knowledge of the distance alone is not enough. With respect to p2 , for example, the object o10 could lie anywhere along the dotted circle representing all equidistant positions. This also implies the existence of two extreme possible positions for o10 with respect to the query object q, a closest and furthest possible position. The former is depicted in Figure 3.3b while the latter is shown in Figure 3.3c. Systematically, the lower bound is computed as the absolute value of the difference between d(q, p2) and d(p2 , o10 ), while the sum d(q, p2 ) and d(p2 , o10 ) forms the upper bound on the distance d(q, o10 ). In our example, the lower bound on distance d(q, o10 ) is greater than the query radius r, thus we are sure the object o10 cannot qualify the query and can skip it in the search process without actually computing the distance. If, on the contrary, we focus on the object o6 , it can be seen from Figure 3.3c that the upper bound on d(q, o6 ) is less than r. As a result, o6 can be directly included in the query response set because the distance d(q, o6) cannot exceed r. In both cases described, one distance computation is omitted, speeding up the search process. Concerning the object o4 , we discover that the lower bound is less than the radius r and the upper bound is greater than r. That means o4 must be compared directly against q using the distance function, i.e. d(q, o4 ) must be computed to decide whether o4 is relevant to the query or not. We formally summarize the ideas described in Lemma 3.2.1. Lemma 3.2.1 Given a metric space M = (D, d) and three arbitrary objects q, p, o ∈ D, it is always guaranteed: |d(q, p) − d(p, o)| ≤ d(q, o) ≤ d(q, p) + d(p, o). Consequently, the distance d(q, o) can be bounded from below and above, provided the distances d(q, p) and d(p, o) are known. 3.2.2 Range-Pivot Distance Constraint The object-pivot distance constraint described above assumes that all distances between the database objects oi and the respective pivot 33
3. T HE S CALABILITY C HALLENGE Closest to q
o4
o4
o6
r
rl
q p2 rh
o 10
o4
o6
r
rl
q p2 rh
(a)
Furthest from q
o 10
r
o6 rl q p2
o 10
rh (b)
(c)
Figure 3.4: Illustration of the range-pivot constraint: (a) our model situation, (b) the lower bound, and (c) the upper bound. p are known. However, some metric structures try to minimize the space needed to build the index, so storing such an amount of data is not acceptable. An alternative is to store only a range (a distance interval) in which the database objects occur with respect to p. Here, we can apply a weaker condition called the range-pivot distance constraint. Consider Figure 3.2 with the range query R(q, r) again and assume the search procedure is just about to enter the left-most leaf node of our sample tree. At this stage, a sophisticated search algorithm should decide if it is necessary to visit the leaf or not, i.e. whether any qualifying object can be found at this node. If we know the interval [rl , rh ] in which distances from the pivot p2 to all objects o4 ,o6 ,o10 occur, it can be applied to solve the problem. A detail of such a situation is depicted in Figure 3.4a, where the dotted circles represent limits of the range and the known distance between the pivot and the query is emphasized by a solid line. The shortest distance from q to any object lying within the range is rl − d(q, p2) (see Figure 3.4b). Obviously, no object can be closer to q, because it would be nearer p2 than the threshold rl otherwise. By analogy, we can define the upper bound as rh + d(q, p2 ), see Figure 3.4c. In this way, we have two expressions which limit the distance between an object and the query q. To reveal the usefulness of this, consider range queries again. If the lower bound is greater than the query radius r, we are sure that
34
3. T HE S CALABILITY C HALLENGE
o
rh
rl
o
rh
rl
p
o
rh
rl
p
p
q q q (a)
(b)
(c)
Figure 3.5: Illustration of Lemma 3.2.2 with three different positions of the query object: (a) above, (b) below and (c) within the range [rl , rh ]. no qualifying object can be found and the node need not be accessed. On the other hand, if the upper bound is less than or equal to r, we can conclude that all objects qualify and directly include all descendant objects in the query response set – no further distance computations are needed at all. Note that in the model situation depicted in Figure 3.4, we can neither directly include nor prune the node, so the node must be accessed and its individual objects examined instance by instance. Up to now, we have only examined one possible position for the query and range, and stated two rules concerning the search radius r. Before we give a formal definition of the range-pivot constraint, we illustrate three different query positions in Figure 3.5, namely: above the range [rl , rh ] in (a), below the range in (b), and within the interval in (c). We can bound d(q, o), provided rl ≤ d(p, o) ≤ rh and the distance d(q, p) is known. The dotted and dashed line segments denote the lower and upper bounds, respectively. At a general level, the problem can be formalized as follows: Lemma 3.2.2 Given a metric space M = (D, d) and objects o, p ∈ D such that rl ≤ d(o, p) ≤ rh , and given some q ∈ D and an associated distance d(q, p), the distance d(q, o) can be restricted by the range: max{d(q, p) − rh , rl − d(q, p), 0} ≤ d(q, o) ≤ d(q, p) + rh .
35
3. T HE S CALABILITY C HALLENGE 3.2.3 Pivot-Pivot Distance Constraint We have just described two principles which lead to a performance boost in search algorithms. Now, we turn our attention to a third approach which, while weaker than the foregoing two, still provides some benefit. Consider a situation in which the range search algorithm has approached the internal node with pivot p1 (the root node of the structure) and the distance d(q, p1 ) has been evaluated. Here, the algorithm can apply Lemma 3.2.2 to decide which subtrees to visit. The careful reader may object that the range of distances with respect to the pivot p1 must be known separately for both left and right branches. But this is simple to achieve, because every object inserted into the structure must be compared with p1 . Thus, we can assume that the correct intervals are known. The specifics of applying Lemma 3.2.2 are left to the reader as an easy exercise. Without loss of generality, we assume the algorithm has followed the left branch, reaching the node with pivot p2 . Now, the algorithm could compute the distance d(q, p2 ) and apply Lemma 3.2.2 again. But since we know the distance d(q, p1), then if we also know the distance between pivots p1 and p2 , we can employ Lemma 3.2.1 to get an estimate of d(q, p2) without computing it, since d(q, p2 ) ∈ [rl′ , rh′ ]. In fact, we have now an interval on d(q, p2 ) and an interval on d(p2 , oi ), where objects oi are descendants of p2 . Specifically, we have d(q, p2) ∈ [rl′ , rh′ ] and d(p2 , oi ) ∈ [rl , rh ]. Figure 3.6 illustrates both intervals. Figure 3.6a depicts the range on d(q, p2 ) with the known distance d(q, p1 ) emphasized. In Figure 3.6b, the second interval on distances d(p2 , oi ) is given in addition to the first interval, indicated by two dotted circles around the pivot p2 . The purpose of these ranges is to give bounds on distances between q and database objects oi , leading to a faster qualification process that does not require evaluating distances between q and oi , nor even computing d(q, p2 ). The figure shows both ranges intersect, which implies that the lower bound on d(q, oi ) is zero. On the other hand, the sum rh + rh′ obviously forms the upper bound on the distances d(q, oi ). The example in Figure 3.6 only depicts the case when the ranges intersect. In Figure 3.7, we show what happens when the intervals do not coincide. In this case, the lower limit is equal to rl′ − rh , which can be seen easily from Figure 3.7a. Figure 3.7b shows another view 36
3. T HE S CALABILITY C HALLENGE o 11
o 11
o5
r’h
p1 o4 r
o1
p1 r’h
o6
o 10
o5
rh
o4 r
q p2
rl o6 q p2 r’l
o1 o 10
r’l (a)
(b)
Figure 3.6: (a) The lower rl′ and upper rh′ bounds on distance d(q, p2 ), (b) the range [rl , rh ] on distances from p2 and database objects – the range from (a) is also included. of the upper bound. The third possible position for the interval is opposite that depicted in Figure 3.7. This time, the intervals have been reversed, giving a lower limit of rl − rh′ . The general formalization of this principle is as follows: Lemma 3.2.3 Given a metric space M = (D, d) and objects o, p, q ∈ D such that rl ≤ d(p, o) ≤ rh and rl′ ≤ d(q, p) ≤ rh′ , the distance d(q, o) can be bounded by the range: max{rl′ − rh , rl − rh′ , 0} ≤ d(q, o) ≤ rh + rh′ .
3.2.4 Double-Pivot Distance Constraint The three previous approaches to speeding up the retrieval process in metric structures all use a single pivot, in keeping with the ball partitioning paradigm. Next we explore an alternate strategy based upon generalized hyperplane partitioning. As defined in Section 3.1, this technique employs two pivots to partition the metric space. Figure 3.8a shows an example of generalized hyperplane partitioning in which pivots p1 , p2 are used to divide the space into two subspaces – objects nearer p1 belonging to the left subspace and objects nearer to p2 to the right. The vertical dashed line represents 37
3. T HE S CALABILITY C HALLENGE
rh
rl
r ’l rl
r ’h
p o
r ’h
r ’l
rh p r h + r ’h
o
q
q
r ’l − rh (a)
(b)
Figure 3.7: Illustration of Lemma 3.2.3: (a) the ranges [rl , rh ] and [rl′ , rh′ ] do not intersect, so the lower bound is rl′ − rh ; (b) the upper limit rh + rh′ . q’ o
o
p1
q
(a)
p2
o
p1
q
(b)
p2
p1
q
p2
(c)
Figure 3.8: Illustration of Lemma 3.2.4: (a) the lower bound on d(q, o), (b) the equidistant positions of q with respect to the lower bound, and (c) shrinking the lower bound. points equidistant from both pivots. With this partitioning we cannot establish an upper bound on the distance from query object q to database objects oi , because the database objects may be arbitrarily far away from the pivots. Thus only lower limits can be defined. First, let us examine the case in which objects o and q are in the same subspace, not considered in Figure 3.8. Obviously the lower bound will equal zero, since it is possible some objects may be identical. Next, we consider the situation in Figure 3.8a, where the lower bound (depicted by a dotted line) is equal to (d(q, p1 ) − d(q, p2))/2. In Figure 3.8b, the hyperbolic curve represents all possible positions of the query object q with a constant value of (d(q, p1 )−d(q, p2))/2. If we move the query object q up vertically while maintaining the distance 38
3. T HE S CALABILITY C HALLENGE to the dashed line, the expression (d(q, p1) −d(q, p2 ))/2 decreases. For illustration, see Figure 3.8c, where q ′ represents the new position of the query object. Consequently, the expression (d(q, p1 ) − d(q, p2))/2 is indeed the lower bound on d(q, o). The formal definition of this double-pivot distance constraint is given in Lemma 3.2.4. Lemma 3.2.4 Assume a metric space M = (D, d) and objects o, p1 , p2 ∈ D such that d(o, p1 ) ≤ d(o, p2). Given a query object q ∈ D and the distances d(q, p1 ) and d(q, p2), the distance d(q, o) is lower-bounded as follows: � � d(q, p1) − d(q, p2) max , 0 ≤ d(q, o). 2
We should point out this constraint does not employ any alreadyevaluated distance from a pivot to a database object. If we knew such distances to both pivots we would simply apply Lemma 3.2.1 twice, for each pivot separately. The concept of using known distances to more pivots is detailed in the following. 3.2.5 Pivot Filtering Given a range query R(q, r), we can eliminate database objects by applying Lemma 3.2.1, provided we know the distance between p and all database objects. This situation is demonstrated in Figure 3.9a, where the white area contains objects that cannot be eliminated under such a distance criterion. After elimination, the search algorithm would proceed by inspecting all remaining objects and comparing them against the query object using the original distance function, i.e. for all non-discarded objects oi , verify the query condition d(q, oi) ≤ r. To achieve a greater degree of pruning, several pivots can be combined into a single pivot filtering technique [20]. The underlying idea is shown in Figure 3.9b, where the reader can observe the improved filtering effect for two pivots. We formalize this concept in the following lemma. Lemma 3.2.5 Assume a metric space M = (D, d) and a set of pivots P = {p1 , . . . , pn }. We define a mapping function Ψ: (D, d) → (Rn , L∞ ) as 39
3. T HE S CALABILITY C HALLENGE
r q
r q
p p2
p1 (a)
(b)
Figure 3.9: Illustration of filtering technique: (a) using a single pivot, (b) using a combination of pivots. follows: Ψ(o) = (d(o, p1), d(o, p2), . . . , d(o, pn )). Then, we can bound the distance d(q, o) from below: L∞ (Ψ(q), Ψ(o)) ≤ d(q, o).
The mapping function Ψ(·) returns a vector of distances from an object o to all pivots in P . For a database object, the vector actually contains the pre-computed distances to pivots. On the other hand, the application of Ψ(·) on a query object q requires computation of distances from the query object to all pivots in P . Once we have the vectors Ψ(q) and Ψ(o), the lower bound criterion can be applied to eliminate the object o if |d(q, pi) − d(o, pi)| > r for any pi ∈ P . The white area in Figure 3.9b represents the objects that cannot be eliminated from the search using two pivots. These objects will still have to be tested directly against the query object q with the original metric function d. The mapping Ψ(·) is contractive, i.e. the distance L∞ (Ψ(o1 ), Ψ(o2)) is never greater than the distance d(o1 , o2 ) in the original metric space. The bad outcome of a range query performed in the projected space (Rn , L∞ ) may contain some spurious objects that do not qualify for the original query. To get the final result, the outcome has to be tested by the original distance function d. More details about the metric space transformations can be found in the next section. 40
3. T HE S CALABILITY C HALLENGE
3.3 Dynamic Index Structures In the previous, we describe some general techniques to prune the search space and avoid some computations based on the properties of the metric function. Now, we have the tools necessary to design a more efficient index structure than the sequential scan. We provide the descriptions of only two major dynamic techniques, others can be found in exhaustive surveys [9] or [35]. The first one is a multiway tree based structure called M-tree – see Section 3.3.1. The second one – D-index in Section 3.3.2 – uses another paradigm known from the traditional primary key indexing: the hashing. 3.3.1 M-tree The M-tree is, by nature, designed as a dynamic and balanced index structure capable of organizing data stored on a disk. By building the tree in a bottom-up fashion from its leaves to its root, the M-tree shares some similarities with R-trees [31] and B-trees [17]. This concept results in a balanced tree structure independent of the number of insertions or deletions and has a positive impact on query execution. In general, the M-tree behaves like the R-tree. All objects are stored in (or referenced from) leaf nodes while internal nodes keep pointers to nodes at the next level, together with additional information about their subtrees. Recall that R-trees store minimum bounding rectangles in non-leaf nodes that cover their subtrees. In general metric spaces, we cannot define such bounding rectangles because a coordinate system is lacking. Thus M-trees use an object called a pivot, and a covering radius, to form a bounding ball region. In the M-tree, pivots play a role similar to that in the GNAT access structure, but unlike in GNAT, all objects are stored in leaves. Because pre-selected objects are used, the same object may be present several times in the M-tree – once in a leaf node, and once or several times in internal nodes as a pivot. Each node in the M-tree consists of a specific number of entries, m. Two types of nodes are presented in Figure 3.10. An internal node entry is a tuple hp, r c , d(p, pp ), ptri, where p is a pivot and r c is the corresponding covering radius around p. The parent pivot of p is 41
3. T HE S CALABILITY C HALLENGE Internal Node:
p 1 r c1 d(p 1,p p) ptr 1 p 2 r c2 d(p 2,p p) ptr 2 ... pm r cm d(pm,p p) ptrm
Leaf Node: o1 d(o1,o p) o2 d(o2,o p) ... om d(om,o p)
Figure 3.10: Graphical representation of the internal and leaf nodes of the M-tree. denoted as pp and d(p, pp ) is the distance from p to the parent pivot. As we shall soon see, storing distances to parent objects enhances the pruning effect of search processes. Finally, ptr is a pointer to a child node. All objects o in the subtree rooted through ptr are within the distance r c from p, i.e. d(o, p) ≤ r c . By analogy, a tuple ho, d(o, op)i forms one entry of a leaf node, where o is a database object (or its unique identifier) and d(o, op) is the distance between o and its parent object, i.e. the pivot in the parent node. Figure 3.11 depicts an M-tree with three levels, organizing a set of objects o1 , . . . , o11 . Observe that some covering radii are not necessarily minimum values for their corresponding subtrees. Look, e.g., at the root node, where neither the covering radius for object o1 nor that for o2 is optimal. (The minimum radii are represented by dotted circles.) Obviously, using minimum values of covering radii would reduce the overlap of individual bounding ball regions, resulting in a more efficient search. For example, the overlapping balls of the root node in Figure 3.11 become disjoint when the minimum covering radii are applied. The original M-tree does not consider such optimization, but [11] have proposed a bulk-load algorithm for building the tree which creates a structure that sets the covering radii to their minimum values. The M-tree is a dynamic structure, thus we can build the tree gradually as new data objects come in. The insertion algorithm looks for the best leaf node in which to insert a new object oN and stores the object there if enough space is available. The heuristics for finding the most suitable leaf node proceeds as follows: The algorithm descends down through a subtree for which no enlargement of the covering radius r c is needed, i.e. d(oN , p) ≤ r c . If multiple subtrees exist with this property, the one for which object oN is closest to its pivot is 42
3. T HE S CALABILITY C HALLENGE
o5 o 10
o3
o6
o1 o1
0.0
o6
1.4
1.4 0.0
o 10
1.2 3.3
o 10
0.0
o3
o7
o9
4.5 −.−
o2
o7
0.0
o5
o4
6.9 −.−
o7 1.2
o8
o1
o1
o2
o 11
1.3
1.3 3.8
o 11 1.0
o2
o2 0.0
2.9 0.0
o8
2.9
o4
1.6 5.3
o4
0.0
o9
1.6
Figure 3.11: Example of an M-tree consisting of three levels. Above, a 2-D representation of partitioning. Pivots are denoted by crosses and the circles around pivots correspond to values of covering radii. The dotted circles represent the minimum values of covering radii. chosen. Such a heuristics supports the creation of compact subtrees and tries to minimize covering radii. Figure 3.11 depicts a situation in which object o11 could be inserted into the subtrees around pivots o7 and o2 . Because o11 is closer to o7 than to the pivot o2 , it is inserted into the subtree of o7 . If there is no pivot for which zero enlargement is needed, the algorithm’s choice is to minimize the increase of the covering radius. In this way, we descend through the tree until we come to a leaf node where the new object is inserted. During the tree traversal phase, the covering radii of all affected nodes are adjusted. Insertion into a leaf may cause the node to overflow. The overflow of a node N is resolved by allocating a new node N ′ at the same level and by redistributing the m + 1 entries between the node subject to overflow and the one newly created. This node split requires two new pivots to be selected and the corresponding covering radii adjusted to reflect the current membership of the two new nodes. 43
3. T HE S CALABILITY C HALLENGE Naturally, the overflow may propagate towards the root node and, if the root splits, a new root is created and the tree grows up one level. A number of alternative heuristics for splitting nodes is considered in [13]. Through experimental evaluation, a strategy called the minimum maximal radius mM RAD 2 has been found to be the most efficient. This strategy optimizes the selection of new pivots so that the corresponding covering radii are as small as possible. Specifically, two objects pN , pN ′ are used as new pivots for nodes N, N ′ if c c the maximum (i.e. the larger, max(rN , rN ′ )) of corresponding radii is minimum. This process reduces overlap within node regions. Starting at the root, the range search algorithm for R(q, r) traverses the tree in a depth-first manner. During the search, all the stored distances to parent objects are brought into play. Assuming the current node N is an internal node, we consider all non-empty entries hp, r c , d(p, pp), ptri of N as follows: • If |d(q, pp) − d(p, pp)| − r c > r, the subtree pointed to by ptr need not be visited and the entry is pruned. This pruning criterion is based on the fact that the expression |d(q, pp ) − d(p, pp )| − r c forms the lower bound on the distance d(q, o), where o is any object in the subtree ptr. Thus, if the lower bound is greater than the query radius r, the subtree need not be visited because no object in the subtree can qualify the range query. • If |d(q, pp) − d(p, pp )| − r c ≤ r holds, we cannot avoid computing the distance d(q, p). Having the value of d(q, p), we can still prune some branches via the criterion: d(q, p) − r c > r. This pruning criterion is a direct consequence of the lower bound in Lemma 3.2.2 with substitutions rl = 0 and rh = r c (i.e. the lower and upper bounds on the distance d(p, o)). • All non-pruned entries are searched recursively. Leaf nodes are similarly processed. Each entry ho, d(o, op)i is examined using the pruning condition |d(q, op )−d(o, op)| > r. If it holds, the entry can be safely ignored. This pruning criterion is the lower bound in Lemma 3.2.1. If the entry cannot be discarded, the distance d(q, o) is evaluated and the object o is reported if d(q, o) ≤ r. Note that in all three steps where pruning criteria hold, we discard some 44
3. T HE S CALABILITY C HALLENGE entries without computing distances to the corresponding objects. In this way, the search process is made faster and more efficient. The algorithm for k-nearest-neighbors queries is based on the range search algorithm, but instead of the query radius r the distance to the k-th current nearest neighbor is used – for details see [13]. From a theoretical point of view, the space complexity of the M-tree involves O(n + mmN ) distances, where n is the number of distances stored in leaf nodes, mN is the number of internal nodes, and each node has a capacity of m entries. The construction complexity claimed is O(nm2 logm n) distance computations. A dynamic structure called the Metric Tree (M-tree) is proposed in [13]. It can handle data files that change size dynamically, which becomes an advantage when insertions and deletions of objects are frequent. In contrast to other metric trees, the M-tree is built bottomup by splitting its fixed-size nodes. Each node is constrained by sphere-like (ball) regions of the metric space. A leaf node entry contains an identification of the data object, its feature value used as an argument for computing distances, and its distance from a routing object (pivot) that is kept in the parent node. Each internal node entry keeps a child node pointer, the covering radius of the ball region that bounds all objects indexed below, and its distance from the associated pivot. Obviously, the distance to the parent pivot has no meaning for the root. The pruning effect of search algorithms is achieved by using the covering radii and the distances from objects to their pivots in parent nodes. Dynamic properties in storage structures are highly desirable but typically have a negative effect on performance. Furthermore, the insertion algorithm of the M-tree is not deterministic, i.e., inserting objects in different order results in different trees. That is why the bulk loading algorithm has been proposed in [11]. The basic idea of this algorithm works as follows: Given a set of objects, the initial clustering produces k sets of relatively close objects. This is done by choosing k distant objects from the set and making them representative samples. The remaining objects get assigned to the nearest sample. Then, the bulk-loading algorithm is invoked for each of these k sets, resulting in an unbalanced tree. Special refinement steps are applied to make the tree balanced.
45
3. T HE S CALABILITY C HALLENGE Separable set 3 Separable set 1
2,ρ
S [11]
o3 1,ρ
S [0]
2,ρ
o1
S [−1]
2,ρ
S [−−]
dm 2ρ
p
S [00] 2,ρ
1,ρ
S [−]
2,ρ
o2
1,ρ
S [1]
S [10]
S [1−]
2,ρ
2ρ
S [0−]
2,ρ
S [−0] 2,ρ
S [−−] Separable set 0 Exclusion set
Separable set 2
(a)
dm 2,ρ S [01]
2,ρ
(b)
Figure 3.12: (a) The bps split function and (b) the combination of two bps functions. 3.3.2 D-index In tree-like indexing techniques, search algorithms traverse trees and visit nodes which reside within the query region. This represents logarithmic search costs in the best case. Indexes based on hashing, sometimes called key-to-address transformation paradigms, contrast by providing a direct access to searched regions with no additional traversals of the underlying structure. In this section, we describe an interesting hash-based index structure that supports disk storage. The Distance Index (D-index) is a multi-level metric structure, based on hashing objects into buckets which are search-separable on individual levels – see Section 3.1.3 for the concept of partitioning with exclusion. The structure supports easy insertion and bounded search costs because at most one bucket per level need be accessed for range queries with a search radius up to some predefined value ρ. At the same time, the use of a pivot-filtering strategy described in Section 3.2.5 significantly cuts the number of distance computations in the accessed buckets. In what follows, we provide an overview of the D-index, which is fully specified in [21]. A preliminary idea of this approach is available in [28]. Before presenting the structure, we provide more details on the partitioning principles employed by the technique, which are based on multiple definition of a mapping function called the ρ-split function. An example of a ρ-split function named bps (ball-partitioning split) is illustrated in Figure 3.12a. With respect to the parameter (dis-
46
3. T HE S CALABILITY C HALLENGE tance) ρ, this function uses one pivot p and the median distance dm to partition a dataset into three subsets. The result of the following bps function uniquely identifies the set to which an arbitrary object o ∈ D belongs: 0 if d(o, p) ≤ dm − ρ 1,ρ 1 if d(o, p) > dm + ρ bps (x) = (3.1) − otherwise
In principle, this split function uses the excluded middle partitioning strategy described in Section 3.1.3. To illustrate, consider Figure 3.12 again. The split function bps returns zero for the object o3 , one for the object o1 (it lies in the outer region), and ‘−’ for the object o2 . The subset of objects characterized by the symbol ‘−’ is called the exclusion set, while the subsets characterized by zero and one are separable sets. 1,ρ 1,ρ In Figure 3.12a, the separable sets are denoted by S[0] (D), S[1] (D) 1,ρ and the exclusion set by S[−] (D). Recall that D is the domain of a given metric space. Because this split function produces two separable sets, we call it a binary bps function. Objects of the exclusion set are retained for further processing. To emphasize the binary behavior, Equation 3.1 uses the superscript 1 which denotes the order of the split function. The same notation is retained for resulting sets. Two sets are separable if any range query using a radius not greater than ρ fails to find qualifying objects in both sets. Specifically, for any pair of objects oi and oj such that bps1,ρ (oi ) = 0 and bps1,ρ (oj ) = 1, the distance between oi and oj is greater than 2ρ, i.e. d(oi , oj ) > 2ρ. This is obvious from Figure 3.12a, however, it can also be easily proved using the definition of the bps function and applying the triangle inequality. We call such a property of ρ-split functions the separable property. For most applications, partitioning into two separable sets is not sufficient, so we need split functions that are able to produce more separable sets. In the D-index, we compose higher order split functions by using several binary bps functions. An example of a system of two binary split functions is provided in Figure 3.12b. Observe that the resulting exclusion set is formed by the union of the exclusion sets of the original split functions. Furthermore, the new separable sets are obtained as the intersections of all possible pairs of the original separable sets. Formally, we have n binary bps1,ρ split functions, 47
3. T HE S CALABILITY C HALLENGE each of them returning a single value from the set {0, 1, −}. The joint n-order split function is denoted as bpsn,ρ and the return value can be seen as a concatenated string of results of participating binary functions, that is, the string b = (b1 , . . . , bn ), where bi ∈ {0, 1, −}. In order to obtain an addressing scheme, which is essential for any hashing technique, we need another function that transforms the string b into an integer. The following function hbi returns an integer value in the range [0..2n ] for any string b ∈ {0, 1, −}n : � P [b1 , b2 , . . . , bn ]2 = nj=1 2n−j bj , if ∀j bj 6= − hbi = 2n , otherwise When no string elements are equal to ‘−’, the function hbi simply treats b as a binary number, which is always smaller than 2n . Otherwise the function returns 2n . By means of ρ-split functions and the h·i operator, we assign an integer number i (0 ≤ i ≤ 2n ) to each object o ∈ D and in this respect, group objects from D in 2n +1 disjoint subsets. Considering again the 2,ρ 2,ρ 2,ρ 2,ρ illustration in Figure 3.12b, the sets denoted as S[00] , S[01] , S[10] , S[11] 2,ρ 2,ρ 2,ρ 2,ρ are mapped to S[0] , S[1] , S[2] , S[3] (i.e. four separable sets). The re2,ρ 2,ρ 2,ρ 2,ρ 2,ρ maining combinations S[0−] , S[1−] , S[−0] , S[−1] , S[−−] are all interpreted 2,ρ as a single set S[4] (i.e. the exclusion set). Once again, the first 2n sets are called separable sets and the exclusion set is formed by the set of objects o for which hbpsn,ρ(o)i evaluates to 2n . The most important fact is that the combination of split functions also satisfies the separable property. We say that such a disjoint separation of subsets, or partitioning, is separable up to 2ρ. This property is used during retrieval, because a range query with radius r ≤ ρ never requires accessing more than one of the separable sets and, possibly the exclusion set. Naturally, the more separable sets we have, the larger the exclusion set is. For a large exclusion set, the D-index allows an additional level of splitting by applying a new set of split functions to the exclusion set of the previous level. This process is repeated until the exclusion set is conveniently small. The storage architecture of the D-index is based on a two dimensional array of buckets used for storing data objects. On the first level, a bps function is applied to the whole dataset and a list 48
3. T HE S CALABILITY C HALLENGE of separable sets is obtained. Each separable set forms a separable bucket. In this respect, a bucket represents a metric region and organizes all objects from the metric domain falling into it. Specifically, on the first level, we get a one-dimensional array of buckets. The exclusion set is partitioned further at the next level, where another bps function is applied. Finally, the exclusion set on the final level, which will not be further partitioned, forms the exclusion bucket of the whole multi-level structure. Formally, a list of h split functions P 2 ,ρ 1 ,ρ h ,ρ , . . . , bpsm ) forms 1 + hi=1 2mi buckets as follows: , bpsm (bpsm 2 1 h B1,0 , B1,1 , . . . , B1,2m1 −1 B2,0 , B2,1 , . . . , B2,2m2 −1 .. .
Bh,0 , Bh,1, . . . , Bh,2mh −1 , Eh In the structure, objects from all separable buckets are included, but only the Eh exclusion bucket is present because exclusion buckets Ei 2 ւ ց 2 < p3 , p 4 > < p5 , p 6 > 3 ւ ց ւ ց BID1 BID2 BID3 NNID1 Figure 5.1: An example of an Address Search Tree. Figure 5.2 illustrates the instances of AST structure in a network of three peers. The dashed arrows indicate the NNID pointers while the solid arrows represent the BID pointers. Observe that Peer 1 has no buckets, while the other two peers contain objects located only under specific leaves. Peer 1
Legend: Bucket NNID or BID Inner node
Peer 2
Peer 3
Figure 5.2: The GHT* network of three peers.
5.3 Storage Management As we have already explained, the atomic storage unit of the GHT∗ is a bucket. The number of buckets and their capacity on a peer always 76
5. GHT* – N ATIVE P EER - TO -P EER S IMILARITY S EARCH S TRUCTURE have upper bounds, but these can be different for different peers. Since the bucket identifiers are only unique within a peer, a bucket in the global context is addressed by a pair (NNID, BID). To achieve scalability, the GHT∗ must be able to split buckets and allocate new storage and network resources. As is intuitively clear, splitting one bucket into two implies changes in the AST, i.e. the tree must grow. The complementary operation, merging two buckets into one, forces the AST to shrink. 5.3.1 Bucket Splitting The bucket splitting operation is triggered by the insertion of an object into an already-full bucket. The procedure consists of the following three steps: • A new bucket is allocated. If the capacity exists on the local peer, the bucket is created there. Otherwise, the bucket is allocated either to another peer with free capacity, or a new peer is used. • A pair of pivots is chosen from objects of the overflowing bucket as detailed in Section 5.3.2. • Objects from the overflowing bucket closer to the second pivot than to the first one are moved to the new bucket. p1 p2
SPLIT
p2
p1 BID 1
BID 1
BID 2
Figure 5.3: Splitting of a bucket in GHT. Figure 5.3 illustrates splitting one bucket into two. First, two objects are selected from the original bucket as pivots p1 and p2 . Then, the distances between the pivots and every object in the original 77
5. GHT* – N ATIVE P EER - TO -P EER S IMILARITY S EARCH S TRUCTURE bucket are computed. All objects closer to the pivot p2 are moved into a new bucket BID2 . A new inner node with the two pivots is added into the AST. 5.3.2 Choosing Pivots A specific choice of pivot mechanism directly impacts the performance of the GHT∗ structure. However, the selection can be a timeconsuming operation, typically requiring many distance computations. To smooth this process, the authors use an incremental pivot selection algorithm which is based on the hypothesis that the GHT structure performs better if the distance between pivots is great. First, the first two objects inserted into an empty bucket become pivot candidates. Then, distances to the candidates are computed for every other object inserted. If at least one of these distances is greater than the distance between the current candidates, the new object replaces one of the candidates, so the distance between the new pair of candidates is greater. After a sufficient number of insertions, the distance between the candidates is large with respect to the bucket dataset. However, the technique need not choose the most distant pair of objects. When the bucket overflows, the candidates become pivots and the split is executed.
5.4 Insertion of Objects Inserting an object oN starts in a peer by traversing its local AST from the root. For every inner node < p1 , p2 >, the left branch is followed if d(p1 , oN ) ≤ d(p2 , oN ), otherwise the right branch is followed. Once a leaf node has been reached, a BID or NNID pointer is obtained. If it is the BID pointer, the inserted object is stored in the local bucket that the BID points to. Otherwise, the NNID pointer found is applied to forward the request to the peer, where the insertion continues recursively until an AST leaf with the BID pointer is reached. For an example refer to Figure 5.1 again, where the AST is shown. To insert object oN , the peer starts traversing the AST from the root. Assume that d(p1 , oN ) > d(p2 , oN ), so the right branch is taken where distances d1 = d(p5 , oN ) and d2 = d(p6 , oN ) are evaluated. If d1 ≤ d2 78
5. GHT* – N ATIVE P EER - TO -P EER S IMILARITY S EARCH S TRUCTURE the left branch is taken which is a leaf node with BID3 . Therefore, the object oN is stored locally in a bucket denoted by BID3 . In the opposite situation, i.e. d1 > d2 , the right branch leading to a leaf with NNID1 is traversed. Reaching the leaf with NNID, the insertion must be forwarded to the peer denoted by NNID1 and the insert operation continues there. In order to avoid redundant distance computations when searching the AST on the other peer, a path, once-determined, in the original AST is forwarded as well. The path is encoded as a bit-string called BPATH, where each node is represented by one bit – “0” represents the left branch, “1” represents the right branch. Every bit in this path is also accompanied by the respective serial number of the inner node. This is used to recognize possible out-of-date entries and if such entries are found, to update the AST with a more recent version. (The mechanism is explained in Section 5.8). When a BPATH is received by a peer, it helps to quickly traverse the AST, because the distance computations to pivots are not repeated. During this quick traversal, the only check is to see if the serial number of the respective inner node equals the serial number stored in the BPATH. If not, the search resumes with standard AST traversal, and the pivot distances are evaluated until the traversal is finished. To clarify the concept, see Figure 5.1. A BPATH representing the traversal to the leaf node BID3 can be expressed as “1[2], 0[3]”. First, the right branch from the root (the first bit thus being one) is taken and the serial number of the root node is two (denoted by the number in brackets). Then, the left branch with serial number three (thus “0[3]” is the next item) is taken. Finally, reaching a leaf node, the traversal is finished.
5.5 Range Search Range search for query R(q, r) is processed as follows. By analogy to insertion, the evaluation of a range search operation in GHT∗ also starts by traversing the local AST of the peer which issued the query. However, a different traversal condition is used in every inner node
79
5. GHT* – N ATIVE P EER - TO -P EER S IMILARITY S EARCH S TRUCTURE < p1 , p2 >, specifically: d(p1 , q) − r ≤ d(p2 , q) + r
(5.1)
d(p1 , q) + r > d(p2 , q) − r
(5.2)
The right subtree of the inner node is traversed if Condition 5.1 qualifies and the left subtree is traversed whenever Condition 5.2 holds. From the equations derived from Lemma 3.2.4 of Chapter 3, it is clear that both conditions may qualify for a particular range search. Therefore, multiple paths may qualify and finally, multiple leaf nodes may be reached. For all qualifying paths having an NNID pointer in their leaves, the query request is recursively forwarded (including known BPATH) to identified peers until a BID pointer is found in every leaf. If multiple paths point to the same peer, only one request with multiple BPATH attachments is sent. The range search condition is evaluated by the peers in every bucket determined by the BID pointers, together forming the response as a set of qualifying objects.
5.6 Nearest-Neighbors Search In principle, there are two strategies for evaluating kNN queries. The first starts with a very large query radius, covering all the data in a given dataset, to identify the degree to which specific regions might contain searched neighbors. The information is stored in a priority stack (queue) so that the most promising regions are accessed first. As suitable objects are found, the search radius is reduced and the stack adjusted accordingly. Though this strategy never accesses regions which do not intersect the query region bounded by the distance from the query object to its k-th nearest neighbor, processing of regions is strictly serial. On a single computer, the approach is optimal [33], but it is not convenient for distributed environments aiming at exploiting parallelism. The second strategy starts with a zero radius to locate the first region to explore and then extends the radius to locate other candidate regions, if the result-set is still not complete. The nearest-neighbors search in the GHT∗ structure adopts the second approach. 80
5. GHT* – N ATIVE P EER - TO -P EER S IMILARITY S EARCH S TRUCTURE The algorithm first searches for a bucket which has a high probability of containing nearest neighbors. In particular, it seeks a bucket in which the query object would be stored using an insert operation. The accessed bucket’s objects are sorted according to their distances with respect to the query object q. Assume there are at least k objects in the bucket, so that the first k objects, the objects with the shortest distances to q, are candidates for the result-set. However, there may be other objects in different buckets that are closer to the query object than some of the candidates. In order to check this, a range search is issued with the radius equal to the distance of the k-th candidate. In this way, a set of objects is obtained which always has cardinality greater than or equal to k. If all the retrieved objects are sorted and only the first k possessing the shortest distances are retained, the exact answer to the query is obtained. If less than k objects are found during the search in the first bucket, another strategy must be applied because the upper bound on the distance to the k-th nearest neighbor is unknown. The range search operation is once again executed, but the radius must be estimated. If enough objects are returned from the range query (at least k), the search is complete – the result is again the first k objects from the sorted result of the range search. Otherwise, the radius must be expanded and the search done again until enough objects are obtained. There are two possible strategies for estimating the radius: (1) the optimistic strategy, in which the number of distance computations is kept low but multiple incremental range searches might be performed in order to retrieve all necessary objects, and (2) the pessimistic strategy, which prefers bigger range radii at the expense of additional distance computations. Optimistic strategy The objective is to minimize the costs, i.e. the number of buckets accessed and distance computations carried out, using a smallish radius, at the risk of more iterations being necessary if not enough objects are found. In the first iteration, the bounding radius of the candidates is used, i.e. the distance to the last candidate, even though there are fewer than k candidates. The optimistic strategy hopes that there will be enough objects in the other buckets within this radius. Let x be the number of objects returned from the 81
5. GHT* – N ATIVE P EER - TO -P EER S IMILARITY S EARCH S TRUCTURE last range query. If x ≥ k, the search is finished, because the result is guaranteed, otherwise, the radius is expanded by factor 1 + k−x k and the algorithm iterates again. The higher the number of missing objects, the more the radius is enlarged. Pessimistic strategy The estimated radius is chosen rather large so that the probability of a next iteration is minimized, while risking excessive (though parallel) bucket accesses and distance computations. To estimate the radius, the distance between pivots of inner nodes is used, because the algorithm presumes pivots are very distant. More specifically, the pessimistic strategy traverses the AST from the leaf up to the tree root, using the distance between pivots of the current node as the range radius. Every iteration climbs up one level in the AST until the search terminates or the root is encountered. If there are still not enough objects retrieved, the maximum distance of the metric is used and all objects in the structure are examined.
5.7 Deletions and Updates of Objects For simplicity reasons, the updates are not handled specifically. Instead, if the algorithm needs to update an object, it first deletes the previous instance of this object and inserts the new one. The deletion of an object o takes place in two phases. First, a search is made for a particular peer and a bucket containing the object being deleted. The insert traversal algorithm is used for this. More specifically, the algorithm searches for the leaf node in the AST containing the BID pointer b, where object o would be inserted. The bucket b is sought to determine whether the object is really there. If not, the algorithm finishes, because the object is not present in the structure. Otherwise, the object is removed from the bucket b. At this point, an object has been removed from the structure. However, if many objects are removed from buckets, the overall load of the GHT∗ structure would degrade. Many nearly-empty buckets would also worsen efficiency at the whole-system level. Therefore, an algorithm is provided to merge two buckets into one in order to increase the load factor of the bucket. First, the algorithm must detect (after a deletion) that the bucket 82
5. GHT* – N ATIVE P EER - TO -P EER S IMILARITY S EARCH S TRUCTURE 4
1
Np
111 000 000 111 000 111 2
BID1
4
Delete Nb
BID3
111 000 000 111 000 111 3
...
BID3 BID1
...
BID2 BID3
BID2
Figure 5.4: Removing a bucket pointer from the AST. has become underfilled and needs to be merged. This can be easily implemented by, e.g., a minimal-load threshold for a bucket. Let Nb be the leaf node representing the pointer to the underfilled bucket b. A bucket to merge with the underfilled bucket must be found. The algorithm, as a rule, always merges the right bucket with the left one, because after a split the original bucket stays in the left and the new one goes to the right. Let Np be the parent inner node of the node Nb . If the node Nb is a right sub-node of the node Np , then the algorithm reinserts all the objects from the underfilled bucket to the left subtree of node Np and removes node Np from the AST, shrinking the path from the root. Similarly, if Nb is a left sub-node, all the objects from the right branch are taken and reinserted into the left branch, and Np is removed from the AST. Possible bucket overflows are handled as usual. To allow other peers to detect changes in the AST, the serial numbers of all inner nodes in the subtree with root Np are incremented by one. Figure 5.4 outlines the concept. We are removing the bucket BID3 , so first we reinsert the data to the left subtree of its parent (the shaded node). For every object in BID3 we decide according to pivots in the left subtree (specifically, the hatchmarked node) whether to go to bucket BID1 or bucket BID2 . Then we remove the leaf node with BID3 and, preserving the binary tree, we also remove the parent node. One can also see that the serial numbers of the affected nodes are incremented by one.
83
5. GHT* – N ATIVE P EER - TO -P EER S IMILARITY S EARCH S TRUCTURE
5.8 Image Adjustment An important advantage of the GHT∗ structure is update independence. During object insertion, a peer can split an overflowing bucket without informing other nodes in the network. Similarly, deletions may merge buckets. Consequently, peers need not have their ASTs up-to-date with respect to the data, but the advantage is that the network is not flooded with many “adjustment” messages for every update. AST updates are thus postponed and actually done when the respective insertion, deletion, or search operations are executed. The inconsistency in the ASTs is recognized on a peer that receives an operation request with corresponding BPATH from another peer. In fact, if the BPATH derived from the AST of the current peer is longer than the received BPATH, this indicates that the sending peer has an out-of-date version of the AST and must be updated. The other possibility is inconsistency between serial numbers in the BPATH and the inner nodes of the AST. The current peer easily determines a subtree that is missing or outdated on the sending peer because the root of this subtree is the last correct element of the received BPATH. Such a subtree is sent back to the peer through an Image Adjustment Message, IAM. If multiple BPATHs are received by the current peer (which can occur in case of range queries) several subtrees can be sent back through one IAM (including all found inconsistencies). Naturally, the IAM process can also involve multiple peers. Whenever a peer finds an NNID in its AST leaf during the path expansion, the request must be forwarded to the located peer. This peer can also detect an inconsistency and respond with an IAM. This image adjustment message updates the ASTs of all previous peers, including the first peer starting the operation. This is a recursive procedure which guarantees that, for an insertion, deletion or a search operation, every involved peer is correctly updated. An example of a communication during a query execution is given by Figure 5.5. At the beginning, the peer with NNID1 starts to evaluate a query. According to its local AST the query must be forwarded to peer NNID2 . However, this peer detects that the BPATHs from the forwarded request are not complete – i.e. using local AST of peer NNID2 the BPATHs are extended and new leaf nodes with 84
5. GHT* – N ATIVE P EER - TO -P EER S IMILARITY S EARCH S TRUCTURE Peer
Reply
NNID3
Forward Request
Peer
NNID1
Forward
Peer
Peer
NNID2
Reply and IAM
NNID4
Reply Forward Reply
Peer
NNID5
Figure 5.5: Message passing during a query and image adjustments. NNID3 , NNID4 , and NNID5 are reached. Therefore, the request is forwarded to those peers and processed there. The peers were contacted by NNID2 , so they respond with the query results back to peer NNID2 . Finally, peer NNID2 passes the responses to peer NNID1 as the final result-set along with image adjustment, which is represented by the respective subtrees of the local AST of the peer NNID2 .
5.9 Logarithmic Replication Strategy As explained previously, every inner node of the AST contains two pivots and the AST structure is present in a more or less accurate form on every peer. Therefore, the number of replicated pivots increases linearly with the number of peers used. In order to reduce replication, the authors propose a more economical strategy which achieves logarithmic replication among peers at the cost of a moderately increased number of forwarded requests. Inspired by the lazy updates strategy by [40], the logarithmic replication scheme uses a slightly modified AST containing only the necessary number of inner nodes. More precisely, the AST on a specific 85
5. GHT* – N ATIVE P EER - TO -P EER S IMILARITY S EARCH S TRUCTURE Peer 1
Peer 1
Peer 2
Peer 3 Standard AST
Peer 2 Logarithmic AST
Figure 5.6: Example of the logarithmic AST. peer stores only those nodes containing pointers to local buckets (i.e. leaf nodes with BID pointers) and all their ancestors. However, the resulting AST is still a binary tree which substitutes all subtrees leading exclusively to leaf nodes with NNID pointers by the leftmost leaf node of the subtree. The rationale for choosing the leftmost leaf node derives from the split strategy, which always retains the left node and adds the right one. Figure 5.6 illustrates this principle. In a way, the logarithmic AST can be seen as the minimum subtree of the fully updated AST. The search operation with the logarithmic replication scheme may require more forwarding (compared to the full replication scheme), but replication is significantly reduced.
5.10 Joining the Peer-to-Peer Network The GHT∗ scales-up to process a large volume of data by utilizing more and more peers. In principle, such an extension can be solved in several ways. In the GRID infrastructure, for example, new peers are added by standard commands. In the prototype implementation, authors use a pool of available peers known to every active peer. They do not use a centralized registering service. Instead, they exploit broadcast messaging to notify active peers about a new peer that has become available. When a new network node becomes available, the following actions occur: 86
5. GHT* – N ATIVE P EER - TO -P EER S IMILARITY S EARCH S TRUCTURE • The new node with its NNID sends a broadcast message saying “I am here”. This message is received by each active peer in the network. • The receiving peers add the announced NNID to their local pool of available peers. Additional storage and computational resources required by an active peer are extended as follows: • The active peer picks up one item from the pool of available peers. An activation message is sent to the chosen peer. • With another broadcast message, the chosen peer announces: “I am being used now” so that other active peers can remove its NNID from their pools of available peers. • The chosen peer initializes its own pool of available peers, creates a copy of the AST, and sends the caller the “Ready to serve” reply message. The algorithm is illustrated in Figure 5.7, where the numbers represent the messages sent in the order they appear. The darker computer is a new peer that has just joined the network. It announces its presence by an “I am here” message (1) delivered to all other active peers. Then an active peer (at top left) needs a new peer. It contacts the shaded peer in order to activate it (2). The shaded peer broadcasts “I am being used now” to all others (3) and responds with “Ready to serve” to the first peer (4). If a peer does not want to be activated, it might respond to the first message immediately saying that it is not available any more. The requesting peer then removes it from its pool and continues with the next one.
5.11 Leaving the Peer-to-Peer Network As stated earlier, peers may want to leave the network. The proposed technique does not deal with the unexpected exit of peers which may occur due to the unreliability in the network, operating 87
5. GHT* – N ATIVE P EER - TO -P EER S IMILARITY S EARCH S TRUCTURE 2 4 1
1
3
3
1
1
3
3
Figure 5.7: New peer allocation using broadcast messages. system crashes among peers, etc. To recover from such situations, replication and fault tolerance mechanisms are required to preserve data even if part of the system goes down unexpectedly. However, this is stated by the authors of the GHT∗ to be a future research challenge and has not yet been addressed. Therefore, if a peer wants to leave the network, it must perform a clean-up first. There are two kinds of peers – peers which store some data in their local buckets and peers which do not. Those which do not provide use of their storage may leave the system safely without causing problems and need not inform the others. However, peers which hold data must first ensure that data is not lost. In general, such a peer uses the deletion mechanism and reinserts the data again, but without offering its storage capacity to the network any longer. The peer thus gets rid of all its objects and does not receive new ones.
88
Chapter 6
GHT* Evaluation In this section, we report on our experience with the distributed index GHT∗ using our prototype implementation in Java. First, we describe our computing infrastructure and the datasets used for the evaluation – see Section 6.1. Section 6.2 shows results of the storage characteristics of the GHT∗ structure for different settings and replication strategies. The next section demonstrates the GHT∗ performance during evaluation of similarity queries. The global costs, which represent the expenses directly comparable to centralized structures, are observed in Section 6.3.1. In Section 6.3.2, we show the enhancement of distributed computing, i.e. the parallel costs, which represent the actual response time of the search system. In both sections, we show results of range and nearest-neighbors queries, which are then compared with each other in Section 6.3.3. The final group of experiments concentrates on the scalability aspects of the GHT∗ . The point we would most like to emphasize in this section is that, even with a huge and permanently growing dataset, the index distributed on sufficient number of peers is able to maintain practically constant response times to similarity queries.
6.1 Datasets and Computing Infrastructure We conducted our experiments using two real-life datasets. The first was a dataset of 45-dimensional vectors of color image features (labeled VEC) compared via the quadratic form distance function. The second dataset consisted of sentences from the Czech language corpus (labeled STR), with the edit distance function used to quantify sentence proximity. Both datasets contained 100,000 objects, vectors or sentences, respectively. 89
6. GHT* E VALUATION We used a local network of 100 workstations, which are publicly available for students. The computers are connected by a highspeed 100Mbit switched network with access times approximately 5ms. Since the computers have enough memory, we used the simplest setting of the GHT∗ implementation, in which the buckets are implemented as unordered lists of objects stored in RAM. However, more advanced settings are possible, such as organizing the buckets by a centralized index, for example the M-tree or D-index and storing the data on disks. Such schemas would additionally extend the efficiency of the distributed index, but would also further complicate the evaluation of results. The computers were not exclusively dedicated to our performance trials. In such an environment, it is practically impossible to maintain identical behavior for each participating computer, and the speed and actual response times of the computers may vary depending on their actual computational load. Therefore we do not report absolute response times but rather the number of distance computations to show CPU costs, the number of buckets accessed for I/O costs, and the number of messages used to indicate network communication costs.
6.2 Performance of Storing Data In order to assess the properties of the GHT∗ storage, we have inserted all the 100,000 objects from both the datasets using the following four different allocation configurations: nb bs
1 4,000
5 1,000
5 2,000
10 1,000
In Figure 6.1, we report load factors for the increasing size of the STR dataset, because similar experiments for the VEC dataset exhibit similar behavior. Observe that the load factor is increasing until a bucket split occurs, then it goes sharply down. Naturally, the effects of a new bucket activation become less significant as the size of the dataset and the number of buckets increase. In sufficiently large datasets, the load factor was around 35% for the STR and 53% for the VEC dataset. The lower load for the STR 90
6. GHT* E VALUATION data is mainly attributed to the variable size of the STR sentences – each vector in the VEC dataset was of the same length. In general, the overall load factor depends on the pivot selection method and on the distribution of objects in the metric space. It can also be observed from Figure 6.1 that the peer capacity settings, i.e. the number of buckets and the bucket size, do not significantly affect the overall bucket load. 1 nb=1 bs=4000 nb=5 bs=1000 nb=5 bs=2000 nb=10 bs=1000
load factor
0.8 0.6 0.4 0.2 0
0
20000
40000 60000 data−set size
80000
100000
Figure 6.1: Load factor for the STR dataset The second set of experiments evaluates the replication factor of the GHT∗ separately for the logarithmic and the full replication strategies. Figures 6.2a and 6.2b show the replication factors for increasing dataset sizes using different allocation configurations. We again report only results for the STR dataset because the experiments with the VEC dataset did not reveal any different dependencies. Figure 6.2a concerns the full replication strategy. Though the observed replication is quite low, it grows in principle linearly with the increasing dataset size, because complete AST is replicated on each computer node. In particular, the replication factor rises whenever a new peer is applied (after splitting) and then it goes down slowly as new objects are inserted until another peer is activated. The increasing number of used (active) peers can be seen in Figure 6.3. Figure 6.2b is reflecting the same experiments, but using the logarithmic replication scheme. The replication factor is more than 10 times lower than it is for the full replication strategy. Moreover, we can see the logarithmic tendency of the graphs for all the allocation configurations. Using the same allocation configuration (for example when nb = 5, bs = 2000), the replication factor after 100,000 inserted 91
6. GHT* E VALUATION (a)
(b) 0.012
0.2
replication factor (full)
0.16 0.14
replication factor (logarithmic)
nb=1 bs=4000 nb=5 bs=1000 nb=5 bs=2000 nb=10 bs=1000
0.18
0.12 0.1 0.08 0.06 0.04
nb=1 bs=4000 nb=5 bs=1000 nb=5 bs=2000 nb=10 bs=1000
0.01 0.008 0.006 0.004 0.002
0.02 0
0
20000
40000 60000 data−set size
80000
100000
0
0
20000
40000 60000 data−set size
80000
100000
Figure 6.2: Replication factor for the STR dataset: (a) full replication scheme, (b) logarithmic replication scheme objects is 0.118 for the full replication scheme and only 0.005 for the logarithmic replication scheme. In this case, the replication using the logarithmic scheme is more than twenty times lower than for the full replication scheme. 90 nb=1 bs=4000 nb=5 bs=1000 nb=5 bs=2000 nb=10 bs=1000
number of active servers
80 70 60 50 40 30 20 10 0
0
20000
40000 60000 data−set size
80000
100000
Figure 6.3: Number of peers used to store the STR dataset Though the trends of the graphs are very similar, the specific instances depend on the applied allocation configuration. In particular, the more objects stored on one peer, the lower the replication factor. For example, the configuration nb = 5, bs = 1, 000 (i.e. maximally 5,000 objects per peer) results in a higher replication than the configuration nb = 5, bs = 2000 with maximally 10,000 objects per peer. Moreover, we can see that the configuration with one bucket per peer is significantly worse than the similar setting with 5 buckets per peer and 1,000 objects in one bucket. On the other hand, the other two settings with 10,000 objects per peer (either as 10 buckets with 1 000 92
6. GHT* E VALUATION objects or 5 buckets with 2,000 objects) achieve almost the same replication.
6.3 Performance of Similarity Queries In order to study the performance of the GHT∗ for changing queries, we have measured the costs of range and nearest-neighbors queries for different sizes of query radii and different numbers of neighbors, respectively. To achieve deterministic and reliable experimental results, we used the logarithmic replication schema for all participating peers. We also used a constant number of buckets per peer and capacity. Specifically, every peer was capable of holding up to five buckets with a maximum 1,000 objects per bucket. All inputs for graphs in this section were obtained by averaging the results of fifty queries with a different set of (randomly chosen) query objects and search radius or number of neighbors, respectively. 6.3.1 Global Costs A distributed structure uses the power of networked computers to speed up query evaluation by parallel execution. However, every participating peer must employ its resources and that naturally incurs some costs. In this section, we provide the total cost needed over all trials, i.e. the sum of costs for each peer employed during query evaluation. In general, total costs are directly comparable to those of centralized indexes, because these represent the costs the distributed structure would need if run on a single computer. Of course, there are some additional costs due to the distributed nature of the algorithms. In particular, a centralized structure incurs no network communication costs. Buckets Accessed (I/O costs) The first trial focused on relationships between query size and total number of buckets and peers accessed. Figure 6.4 reports these results separately for the VEC and STR datasets, for different radii of range queries together with the 93
6. GHT* E VALUATION number of retrieved objects (divided by 100 to make the graphs easier to evaluate). If the radius increases, the number of peers accessed grows practically linearly, the number of accessed buckets a bit faster. However, the number of retrieved objects satisfying the query, i.e., the result-set size, may grow exponentially. This is in accordance with the I/O behavior of centralized metric indexes such as the Mtree or the D-index on the global (not distributed) scale. STR
VEC 70 60 50 40 30 20 10 0 600
result set size/100 buckets accessed peers accessed
800
1000 1200 1400 range query radius
1600
140 120 100 80 60 40 20 0
result set size/100 buckets accessed peers accessed
0
5 10 15 range query radius
20
Figure 6.4: Average number of buckets, peers, and objects retrieved as a function of radius. We have also measured these characteristics for kNN queries, and the results are shown in Figure 6.5. We again report the number of buckets and peers accessed with respect to the increasing value of k. As should be clear, the value k also represents the number of objects retrieved. These trials once again reveal a behavior similar to centralized indexes – total costs are low for small values of k, but grow very rapidly as the number of neighbors increases. Distance Computations (CPU costs) In the following experiments, we have concentrated on the total cost of the similarity queries measured by the number of distance computations. Specifically, Figure 6.6 shows the results for increasing radii in range queries. The total cost is the sum of all distance computations performed by every accessed peer in accessed buckets plus “navigation” costs. The navigation cost is measured in terms of distance computations in the AST (shown separately in the graph). Since these costs are well below 1%, they can be neglected for practical purposes. Observe that total costs have once again been divided by 100. 94
6. GHT* E VALUATION VEC 140
STR 140
buckets accessed peers accessed
120 100
100
80
80
60
60
40
40
20
20
0
10
100 k
buckets accessed peers accessed
120
1000
10000
0
10
100 k
1000
10000
Figure 6.5: Average number of buckets, peers, and objects retrieved as a function of k. STR
VEC 200
total/100 AST
150 100 50 0 600 800 1000 1200 1400 1600 range query radius
300 distance computations
distance computations
250
total/100 AST
250 200 150 100 50 0
0
5 10 15 range query radius
20
Figure 6.6: Total and AST distance computations as a function of radius. In Figure 6.7, we show total distance computation costs of kNN queries for different values of k. The results were obtained similarly as for range queries, and for convenience we provide the AST computations as well. It can be seen that, even for the computationally more expensive nearest-neighbors queries, AST navigation costs are only marginal and can be neglected. Compared to centralized indexes, the GHT∗ performs better than the sequential scan, but the M-tree and D-index achieve better results (see Section 3.3.3). However, the GHT∗ can perform distance computations in parallel, which is the main advantage of the distributed index. We elaborate on this issue in the next section. 95
6. GHT* E VALUATION VEC
STR 300
total/100 AST
1000
distance computations
distance computations
1200
800 600 400 200 0
10
100 k
1000
10000
total/100 AST
250 200 150 100 50 0
10
100 k
1000
10000
Figure 6.7: Total and AST distance computations as a function of k. Messages Sent (communication cost) Algorithms for the evaluation of similarity queries in GHT∗ send messages whenever they need to access other peers. More specifically, if an NNID pointer for the peer is encountered in a leaf node during evaluation, a message is sent to that peer. These are termed request messages. Messages destined for the same peer (i.e. multiply-reached leaf nodes contain the same NNID) are clustered and sent together within one message. Figures 6.8 and 6.9 depict the total number of request messages sent by peers involved in a range and kNN search, respectively. We have also measured the number of messages that had to be forwarded because of improper addressing. This situation occurs when a request message arrives at a peer that does not evaluate the query in its local buckets and only passes (forwards) the message to a more appropriate peer. This cost is a little higher for the kNN algorithm because its first phase needs to navigate to the proper bucket first. Intuitively, the total number of (request) messages is strictly related to the number of peers accessed. This fact is confirmed by trials using both range and nearest-neighbors queries. We have also observed that, even with the logarithmic replication strategy, the average number of messages forwarded is below 15% of the total number of messages sent during query execution. Messages are specific to a distributed environment and therefore have no adequate counterpart in centralized structures. However, in general, trials confirmed the fact that similarity queries are expen96
6. GHT* E VALUATION VEC
STR 2.5
request/10 forward
1.2
number of messages
number of messages
1.4
1 0.8 0.6 600
1.5 1.0 0.5 0
800 1000 1200 1400 1600 range query radius
request/10 forward
2.0
0
5 10 15 range query radius
20
Figure 6.8: Average number of request and forward messages as a function of the radius. VEC 35
request forward
30 25 20 15 10 5 0
request forward
30 messages sent
messages sent
STR 35 25 20 15 10 5
10
100 k
1000
10000
0
10
100 k
1000
10000
Figure 6.9: Average number of request and forward messages as a function of the k. sive, that is the total execution costs are high. 6.3.2 Parallel Costs The objective of this section is to report results using the distributed structure GHT∗ , with an emphasis on parallel costs. As opposed to the total costs, these correspond to the actual response time of the GHT∗ index structure to execute similarity queries. For our purposes, we define the parallel cost as the maximum of the serial costs from all accessed peers. For example, to measure a parallel distance computations cost during a range query, we gather the number of distance computations on each peer accessed during 97
6. GHT* E VALUATION the query. The maximum of those values is the query’s parallel cost, since the range query evaluation has practically no serial component (except for the search in the AST on the first peer, which is very lowcost and so can be neglected). A different situation occurs during the execution of kNN queries, because the kNN search algorithm consists of two phases, which cannot be performed simultaneously. The parallel cost is therefore the sum of the parallel costs of the respective phases. As explained in Section 5.6, the first phase navigates to a single bucket seeking candidates for neighbors. The second phase consists of a range query, for which we have already defined the parallel cost. However, the second phase can be repeated when the number of objects retrieved is still smaller than k. Finally, the parallel cost of a nearest-neighbors query is the sum of the cost of the first phase plus the parallel cost of every needed second phase. Buckets Accessed (I/O costs) The parallel costs for range queries, measured as the maximal number of accessed buckets per peer, are summarized in Figure 6.10. Since the number of buckets per peer is bounded – our trials employed a maximum five buckets per peer – the parallel cost remains stable at around 4.3 buckets per peer. For this reason, the parallel range query cost scales well with increasing query radius. STR 7
6
6 buckets accessed
buckets accessed
VEC 7 5 4 3 2 1 0 600
800
1000 1200 1400 range query radius
1600
5 4 3 2 1 0
0
5
10 15 range query radius
20
Figure 6.10: Parallel cost in accessed buckets as a function of radius. A nearest-neighbors query always requires one bucket access for the first phase. Then multiple second phases may be required and 98
6. GHT* E VALUATION their costs are added to the resulting parallel cost. Figure 6.11 shows these results, with the number of iterations in the second phase of the algorithm represented by the lower curve. It can be seen that, for small values of k, only one iteration is needed and the cost is somewhere around the value 5.4, consisting of 1.0 for the initial bucket and 4.4 for the range query. As the value of k grows above the number of objects in one bucket, more iterations are needed. Obviously, each additional iteration represents a serial step of query execution, so the cost slightly increases, but the increase is not doubled, because the algorithm never accesses buckets which have already been processed. In any case, the number of iterations is not high and in our experiments maximally two iterations were always sufficient. VEC 16 14 12 10 8 6 4 2 0
STR 14
iterations bucket accessed
iterations bucket accessed
12 10 8 6 4 2
10
100 k
1000
10000
0
10
100 k
1000
10000
Figure 6.11: Parallel cost in accessed buckets with the number of iterations as a function of k.
Distance Computations (CPU costs) Parallel distance computations represented the major query execution cost in our trials, and can be considered an accurate approximation to actual query response time. This is mainly thanks to the fact that the time to access buckets and send messages is practically negligible compared to evaluation of the distance metric functions. This proved to be especially true when the computations of edit distance and quadratic form metric functions were very time demanding – accessing a bucket in local memory costs microseconds, while network communications can be achieved in tens of milliseconds. 99
6. GHT* E VALUATION We have applied a standard methodology: We have measured the number of distance computations evaluated by each peer, and taken as the reported cost the maximum of these values. Figure 6.12 shows results averaged for the same set of fifty randomly chosen query objects and a specific radius. Since the number of objects stored per peer is bounded (maximum five buckets per peer and 1,000 objects per bucket), the cost would never exceed this value. Recall that we do not consider AST costs, which are of no practical significance. Thus the structure retains an essentially constant response time for any size query radius. STR
VEC 20000 15000 10000 5000 0 600 800 1000 1200 1400 1600 range query radius
30000 distance computations
distance computations
25000
25000 20000 15000 10000 5000 0
0
5 10 15 range query radius
20
Figure 6.12: Parallel cost in distance computations as a function of radius. The situation is similar for kNN queries but the sequential components of the search algorithm must be properly considered. The results are shown in Figure 6.13 and represent the parallel costs for different numbers of neighbors k, measured in terms of distance computations. It can be seen that costs grow very quickly to a value of around 5,000 distance computations. This value represents the parallel cost of the range query plus the initial search for the first bucket. Some increase in distance computations with k around 800 can also be seen. This is caused by the added sequential phase of the algorithm, i.e., the next iteration. The increase is not dramatic, since only some additional buckets are searched to amend the result-set to k objects. This is in accordance with the buckets accessed in parallel shown in Figure 6.10. It can be seen there that only one additional “parallel” bucket was searched during the second iteration, thus the increase in parallel distance computations may be maximally 1,000 100
6. GHT* E VALUATION (the capacity of a bucket). 16000 14000 12000 10000 8000 6000 4000 2000 0
STR 14000 distance computations
distance computations
VEC
10
100 k
1000
10000
12000 10000 8000 6000 4000 2000 0
10
100 k
1000
10000
Figure 6.13: Parallel cost in distance computations as a function of k.
Messages Sent (communication cost) Parallel communication cost is a bit different from previous cases, since we cannot compute it “per peer”. During the evaluation of a query, every peer can send messages to several other peers, but we can consider the cost of sending several messages to different peers equal to the cost of sending only one message to a specific peer, since a peer sends them all at once. Thus, the parallel communication cost consists of a chain of forwarded messages, the sequential passing of the request to other peers. The number of peers sequentially contacted during a search, is usually called the hop count. In the GHT∗ algorithm, there can be several different “hop” paths. For our purposes, we have taken the longest hop path, i.e., the path with maximal hop count, for the parallel communication cost. Figures 6.14 and 6.15 present the number of hops during a range and kNN search, respectively. Our experimental trials show parallel communication is essentially logarithmically proportional to the number of peers accessed (see Figure 6.4), a desirable property in any distributed structure. The time spent communicating can also be deduced from these graphs. However, it is hard to see the contribution of this cost to the overall response time of a query, since each peer first traverses its AST and forwards messages to the respective peers (if needed), and only then it begins to compute distances inside its buckets. So the communication time is only added to the time spent 101
6. GHT* E VALUATION computing the distances in peers contacted subsequently, which can have only a few objects in their buckets. In this case, the overall response time is practically unaffected by communication costs. VEC
STR
2.5
2.5 hop count
3
hop count
3
2 1.5 1 600
2 1.5
800
1000 1200 1400 range query radius
1600
1
0
5 10 15 range query radius
20
Figure 6.14: Number of parallel messages as a function of radius.
STR 12
8
10 hop count
hop count
VEC 10
6 4 2 0
8 6 4 2
1
10
100 k
1000
10000
0
1
10
100 k
1000
10000
Figure 6.15: Number of parallel messages as a function of k.
6.3.3 Comparison of Range and Nearest-Neighbors Search Algorithms In principle, the nearest-neighbors search can be solved by a range query, provided a specific radius is known. After a kNN query has been solved, it becomes trivial to execute the corresponding range query with a precisely measured radius, i.e., using the distance from the query object to the k-th retrieved object. However, such a radius 102
6. GHT* E VALUATION will generally be unknown, so kNN queries are typically more expensive. We have compared the costs in terms of distance computations of the original nearest-neighbors query execution with the costs of the respective range query with exact radius. In what follows, we provide both the parallel and total costs measured according to the methodology used throughout this section. STR 14000 kNN total/10 kNN parallel range total/10 range parallel
10
100 k
distance computations
distance computations
VEC 16000 14000 12000 10000 8000 6000 4000 2000 0
1000
10000
kNN total/10 kNN parallel range total/10 range parallel
12000 10000 8000 6000 4000 2000 0
10
100 k
1000
10000
Figure 6.16: Comparison of a kNN and range query returning k objects as a function of k. The trials show kNN query execution costs are always slightly higher than those of a comparable range query execution. In particular, total costs are practically equal to those of the range query, mainly because the kNN algorithm never accesses the same bucket twice. The difference is caused by the fact that the estimated radius need not be optimal. A different situation can be observed for parallel costs, since the kNN search needs some sequential execution steps, thus diminishing the possibility for parallel execution. In Figure 6.16, the effects of accessing the first bucket during the first phase of the kNN algorithm can be clearly seen in the difference between the range and kNN parallel cost lines in the graphs. The costs of the second iteration become visible after k > 800, which further worsens the parallel response time of the nearest-neighbors query. However, the parallel response time is still comparable to that of the range query. It is practically stable and does not grow markedly.
103
6. GHT* E VALUATION
6.4 Data Volume Scalability In this section, we detail our tests of scalability of the GHT∗ , i.e., the ability to adapt to the expanding dataset. To measure this experimentally, we have fixed the query parameters by choosing two distinct query radii and three different values for nearest neighbors k. The same set of fifty randomly chosen query objects was employed during the experiment, with the graphs depicting average values. Moreover, we have gradually expanded the original dataset to 1,000,000 objects. The following results were obtained as measures at particular stages of incremental insertion. More specifically, we have measured intraquery parallelism costs after every block of 2,000 inserted objects. We quantify the intraquery parallelism cost as the parallel response of a query measured in terms of distance computations. This is defined to be the maximum of costs incurred on peers involved in the query, including navigation costs in the AST. Specifically, each accessed peer computes its internal cost as the sum of the computations in its local AST, and the computations in its buckets visited during the evaluation. The intraquery cost is then computed as the maximum of the internal costs of all peers accessed during the evaluation. Note also that the intraquery parallelism is proportional to the response time of a query. STR 4000
range 600 range 1500
200 400 600 800 dataset size (x 1000)
distance computations
distance computations
VEC 4000 3500 3000 2500 2000 1500 1000 500 0
1000
3000
range 5 range 15
2000 1000 0
200 400 600 800 dataset size (x 1000)
1000
Figure 6.17: Parallel cost as a function of dataset size for two different radii. The results summarized in Figure 6.17 show intraquery parallelism remains very stable, independently of dataset size. Thus the 104
6. GHT* E VALUATION parallel search time, which is proportional to this cost, remains practically constant, which is to be expected from the fact that storage and computing resources are added gradually as the size of the dataset grows. Of course, the number of distance computations needed for traversing the AST grows with the size of the dataset. However, this contribution is not visible. The reason is that AST growth is logarithmic, while peer expansion is linear. VEC
10000
STR 14000
3 NN 100 NN range for 3 NN range for 100 NN
distance computations
distance computations
12000
8000 6000 4000 2000 0
200 400 600 800 dataset size (x 1000)
1000
12000 10000
3 NN 100 NN range for 3 NN range for 100 NN
8000 6000 4000 2000 0
200 400 600 800 dataset size (x 1000)
1000
Figure 6.18: Parallel cost as a function of dataset size for three different k. The nearest-neighbors results shown in Figure 6.18 exhibit similar behavior, only the absolute cost is a bit higher. This is incurred by the sequential steps of the nearest-neighbors search algorithm, consisting of locating the first bucket, followed by possibly multiple sequential iterations. However, the cost is still nearly constant, thus the query response remains unchanged even if the file grows in size.
105
Chapter 7
Scalability Comparison of Distributed Similarity Search Very recently two other distributed similarity searching structures based on the metric space approach were published. Contrary to the GHT∗ structure, they apply transformation strategies – the metric similarity search problem is transformed into a series of range queries executed on existing distributed keyword structures, namely the CAN [62] and the Chord [68] (see Section 4.3). By analogy, they are called the MCAN [24] and the M-Chord [57]. Each of the structures is able to execute similarity queries for any metric dataset, and they both exploit parallelism for query execution. We have also modified the GHT∗ algorithms changing the underlying partitioning principle from the generalized hyperplane to the ball partitioning (see Section 3.1). We refer to this technique as the VPT∗ and it is a fourth distributed metric based index structure. Since all the structures were implemented using the very same Java framework an interesting question arisen: What are the advantages and disadvantages of the individual approaches in terms of search costs and scalability for different real-life search problems? In this chapter, we first provide a brief specification of the MCAN and M-Chord techniques in Section 7.1 and 7.2 respectively. Since the VPT∗ technique is a modification of the GHT∗ structure, we briefly report on its differences in Section 7.3. To be better comparable with the other two techniques we enhanced the GHT∗ algorithms to avoid some distance computations by using the pivot filtering technique as explained in Section 3.2.5. The rest of this chapter then presents the results of the extensive experimental comparison of all the four aforementioned distributed metric index structures.
107
7. S CALABILITY C OMPARISON OF D ISTRIBUTED S IMILARITY S EARCH
7.1 MCAN In order to manage metric data, the MCAN [24] uses a pivot-based technique that maps data objects x ∈ D to an N-dimensional vector space RN . Then, the CAN [62] Peer-to-Peer protocol is used for partitioning the space and the internal navigation – see Section 4.3.1. Having a set of N pivots p1 , . . . , pN selected from D, MCAN maps an object x ∈ D to the vector space by means of the following function F : D → RN : F (x) = (d(x, p1 ), d(x, p2 ), . . . , d(x, pN )).
(7.1)
The virtual vector space coordinates designate the object x placement within the MCAN structure. The CAN protocol divides the vector space into regions and assigns them to the participating peers. The object x is stored by the peer whose region contains F (x). Using L∞ as a distance function in the vector space, the mapping F is contractive, i.e. L∞ (F (x), F (y)) ≤ d(x, y). It can be proved using the triangle inequality of the metric function d [24]. Thus, the algorithm for Range(q, r) query involve only the regions that cover objects x for which L∞ (F (x), F (q)) ≤ r. In other words, it accesses the regions that intersect the hypercube with side 2r centered in F (q) (see Figure 7.1). In order to further reduce the number of evaluated distances, MCAN uses the additional pivot-based filtering according to Section 3.2.5. All peers use the same set of pivots: the N pivots from the mapping function F (Equation 7.1), plus additional pivots since N is typically low. All the pivots are selected from a sample dataset using the incremental selection technique [8]. Routing in MCAN works in the same way as for the original CAN. Every peer maintains a coordinate-based routing table containing the network identifiers and the coordinates of its neighboring peers in the virtual RN space. In every step, the routing algorithm passes the query to the neighboring peer that is geometrically the closest to the target point in the space. Given a dataset, the average number of neighbors per peer is proportional to the dimensionality N while the average number of hops to reach a peer is inversely proportional to this value [62]. 108
7. S CALABILITY C OMPARISON OF D ISTRIBUTED S IMILARITY S EARCH
Figure 7.1: Example of MCAN range query
The insert operation When inserting an object x ∈ D into MCAN, the initiating peer computes distances between x and all pivots. These values are used for mapping x into RN by Equation 7.1 and then the insertion request is forwarded (using the CAN navigation) to the peer that covers value F (x). The receiving peer stores x and if it reaches its storage capacity limit (or another defined condition) it executes a split. The peer’s region is split into two parts trying to divide the storage equally. One of the new regions is assigned to the new active peer and the other one replaces the original region. Range search algorithm The peer that initiates a Range(q, r) query first computes distances between q and all the pivots. The CAN protocol is then employed in order to reach the region which covers F (q). If a peer, visited during the routing process, intersects the query area, the request is spread to all other involved peers using a multicast algorithm described in de109
7. S CALABILITY C OMPARISON OF D ISTRIBUTED S IMILARITY S EARCH tail in [41, 63]. Every affected peer searches its data storage employing the pivot filtering mechanism and returns the answer directly to the initiator.
7.2 M-Chord Similarly to the previous MCAN method, the M-Chord [57] approach also transforms the original metric space. The core idea is to map the dataspace into a one-dimensional domain and use this domain together with the Chord routing protocol [68]. In particular, this approach exploits the idea of a vector index method iDistance [39] which partitions the data space into clusters (Ci ), identifies reference points (pi ) within the clusters, and defines one-dimensional mapping of the data objects according to their distances from the cluster reference point. Having a separation constant c, the iDistance key for an object x ∈ Ci is idist(x) = d(pi , x) + i · c. Figure 7.2a visualizes the mapping schema. Handling a Range(q, r) query, the space to be searched is specified by iDistance intervals for such clusters that intersect the query sphere – see an example in Figure 7.2b. C2
C2 C0
C0
p2
p2 p0
p0
C1
q
C1 r
p1
p1
(iDistance) 0
c
2*c
(a)
3*c
0
c
2*c
(b)
Figure 7.2: The iDistance principles
110
3*c
7. S CALABILITY C OMPARISON OF D ISTRIBUTED S IMILARITY S EARCH This method is generalized to metric spaces in the M-Chord. No coordinate system can be used to partition a general metric space, therefore, a set of n pivots p0 , . . . , pn−1 is selected from a sample dataset and the space is partitioned according to these pivots. The partitioning is done in a Voronoi-like manner [36] (every object is assigned to its closest pivot). Because the iDistance domain is to be used as the key space for the Chord protocol, the domain is transformed by a uniform orderpreserving hash function h into the M-Chord domain of size 2m . Thus, for an object x ∈ Ci , 0 ≤ i < n, the M-Chord key-assignment formula becomes: m-chord(x) = h(d(pi, x) + i · c) (7.2) Insert Algorithm Having the dataspace mapped into the one-dimensional M-Chord domain, every active node of the system takes over responsibility for an interval of keys. The structure of the system is formed by the Chord circle [68]. This Peer-to-Peer protocol provides an efficient localization of the node responsible for a given search key – see explanation in Section 4.3.2. When inserting an object x ∈ D into the structure, the initiating node Nins computes the m-chord(x) key through Formula 7.2 and employs the Chord to forward a store request to the node responsible for the computed key (see Figure 7.3a). The nodes store the data in a B+ -tree storage according to their M-Chord keys. When a node reaches its storage capacity limit (or another defined condition) it executes a split. A new node is placed on the M-Chord circle, so that the requester’s storage can be split evenly. Range Search Algorithm The node Nq that initiates the Range(q, r) query uses the iDistance pruning idea to determine several M-Chord intervals to be examined. The Chord protocol is then employed to reach the nodes responsible for middle points of the intervals. The request is then spread to all nodes covering the particular interval (see Figure 7.3b). The iDistance pruning technique filters out all objects x ∈ Ci that 111
7. S CALABILITY C OMPARISON OF D ISTRIBUTED S IMILARITY S EARCH insert(x): k:=m−chord(x) forward(k,x)
Nins
request response
0
receive(k,x): store(k,x)
Nq Nx m−chord(x)
(a)
(b)
Figure 7.3: The insert (a) and Range (b) schema of the M-Chord
fulfil |d(x, pi) − d(q, pi )| > r. When inserting an object x into M-Chord, distances d(x, pi ) are computed ∀i : 0 ≤ i < n. These values are stored together with object x and the general metric filtering criterion (see Section 3.2.5) improves the pruning of the search space.
7.3 VPT* This structure is similar to the GHT∗ technique described in Chapter 5, only the underlying partitioning schema is based on ball partitioning of the metric space. The structure, similarly to the GHT∗ , store metric objects in buckets that are held by peers in a peer-topeer network. Peers communicate by interchanging messages, pose queries and evaluate results. The core of the algorithm lay in the modified Address Search Tree (AST) that adopts the Vantage Point Tree [70]. The ball partitioning, which is used by the VPT∗ structure, can be seen in Figure 7.4. In general, this principle also allows to divide a set I into two partitions I1 and I2 . However, only one pivot o11 is selected from the set and the objects are divided by a radius r1 . More specifically, if the distance between the pivot o11 and an object o ∈ I is smaller or equal to the specified radius r1 , i.e. if d(o11 , o) ≤ r1 then the object belongs to partition I1 . The object is assigned to I2 112
7. S CALABILITY C OMPARISON OF D ISTRIBUTED S IMILARITY S EARCH
3
1
r3
6 5
15
7
10
9
11
r2
r2
r3
12
12
r1
8
13
r1
11
4 2
18 17
BID1
BID2
BID3
NNID1
22
19
14 15 20
21 16
BID 1 10 11 14
2
15 16 19
7
20 21
BID 2 5 6 8 13
9
1
BID 3 3 4
12 17 18 22
Figure 7.4: Address Search Tree with the ball partitioning otherwise. This algorithm is used recursively to build a binary tree. Additionally, for every inserted object o, we store all the computed distances to pivots, e.g. for the first traversal step we store the distance d(o11 , o), etc. These precomputed distances are then used for pivot filtering (see Section 3.2.5) to avoid some distance computations. The leaf nodes of the AST follow the same schema for addressing local buckets and remote peers as the original GHT∗ . Range search The search for Range(q, r) query proceed similarly to the GHT∗ , only the traversing condition is different. For every inner node in the tree, we evaluate the following conditions: d(p, q) − r ≤ rp
(7.3)
d(p, q) + r > rp
(7.4)
The right subtree of the inner node is traversed if Condition 7.3 qualifies. The left subtree is traversed whenever Condition 7.4 holds respectively. It is clear that both conditions may qualify at the same time for a particular range search. Therefore, multiple paths may be followed and finally, multiple leaf nodes may be reached. Similarly to the GHT∗ , for all qualifying paths having an NNID pointer in their leaves, the query request is recursively forwarded to identified peers until a BID pointer is found in every leaf. The 113
7. S CALABILITY C OMPARISON OF D ISTRIBUTED S IMILARITY S EARCH range search condition is evaluated by the peers in every bucket determined by the BID pointers. Finally, all qualifying objects form the query response set.
7.4 Comparison Background All the compared systems are dynamic. Each structure maintains a set of available inactive nodes and employs these to split the overloaded nodes, although other splitting scenarios are possible as well. For the experiments, the systems consisted of up to 300 active network nodes. In fact, we have used same pool of computers as for the evaluation of GHT* structure in Chapter 6 only a bigger set was utilized. Each of the GHT∗ and VPT∗ peers maintained five buckets with capacity of 1,000 objects and the MCAN and M-Chord peers had storage capacity of 5,000 objects. We selected the following significantly different real-life datasets to conduct the experiments on: VEC 45-dimensional vectors of extracted color image features. The similarity function d for comparing the vectors is a quadraticform distance [65]. The distribution of the dataset is quite uniform and such a high-dimensional data space is extremely sparse. Unfortunately, this dataset is different from the one used in Chapter 6, since we needed up to one million objects for the experiments in this section. However, the distance distributions are similar in both datasets. TTL titles and subtitles of Czech books and periodicals collected from several academic libraries. These strings are of lengths from 3 to 200 characters and are compared by the edit distance [49] on the level of individual characters. The distance distribution of this dataset is skewed. DNA protein symbol sequences of length sixteen. The sequences are compared by a weighted edit distance according to the NeedlemanWunsch algorithm [56]. This distance function has a very limited domain of possible values – the returned values are integers between 0 and 100. 114
7. S CALABILITY C OMPARISON OF D ISTRIBUTED S IMILARITY S EARCH Observe that none of these datasets can be efficiently indexed and searched by a standard vector data structure. If not stated otherwise, the stored data volume is 500,000 objects. When considering the scalability with respect to the growing dataset size, the whole datasets of 1,000,000 objects are used (900,000 for TTL). As for other settings that are specific for particular data structures, the MCAN uses 4 pivots to build the routing vector space and 40 pivots for filtering. The M-Chord uses 40 pivots as well. The GHT∗ and VPT∗ structures use variable number of pivots according to the depth of the AST tree. All the presented performance characteristics of query processing have been taken as an average over 100 queries with randomly chosen query objects.
7.5 Scalability with Respect to the Size of the Query In the first set of experiments, we have focused on the systems’ scalability with respect to the size of the processed query. Namely, we let the structures handle a set of Range(q, r) queries with growing radii r. The size of the stored data was 500,000 objects. The average load ratio of nodes for all the structures was 60–70% which resulted in approximately 150 active nodes for each tested system. We present results of these experiments for all the three datasets. All graphs in this section represent dependency of various measurements (vertical axis) on the range query radius r (horizontal axis) and the title of the graphs identify the used dataset. For the VEC dataset, we varied the radii r from 200 to 2,000 and for the TTL and DNA datasets from 2 to 20. In the first group of graphs, shown in Figure 7.5, we report on the relation between the query radius size and the number of retrieved objects. As intuitively clear, the bigger the radius the higher the number of objects satisfying the query. Since we have used the same datasets, query objects and radii, all the structures return the same number of objects. We can see that the number of results grows exponentially with respect to the query radius for all the three datasets. Note that, for example, the biggest radius 2,000 in the VEC dataset selects almost 10,000 objects (2% of the whole database), for the TTL dataset the biggest radius retrieves even more objects. Obviously, 115
7. S CALABILITY C OMPARISON OF D ISTRIBUTED S IMILARITY S EARCH VEC retrieved objects
10000 9000 8000 7000 6000 5000 4000 3000 2000 1000 0
all structures
0
500
1000
1500
2000
range query radius
DNA retrieved objects
retrieved objects
TTL 16000 14000 12000 10000 8000 6000 4000 2000 0
all structures
0
5
10
15
range query radius
20
9000 8000 7000 6000 5000 4000 3000 2000 1000 0
all structures
0
5
10
15
20
range query radius
Figure 7.5: Number of retrieved objects such big radii are usually not reasonable for applications (e.g., two titles with edit distance 20 differ a lot), but we provide the results in order to study behavior of the structures also in these cases. On the other hand, smaller radii return reasonable amounts of objects, for instance, radius 6 results in approximately 30 objects in the DNA dataset, which is not clearly readable from the graphs. The number of visited nodes is reported in Figure 7.6. More specifically, the graphs show the ratio of the number of nodes that are involved in a particular range query evaluation to the total number of active peers forming the structure. As mentioned earlier, the total number of active peers participating in the network was around 150, thus, value 20% in the graph means that approximately 30 peers were used to complete the results. We can see that the number of employed peers grows practically linearly with the size of the radius. The only exception is the GHT∗ algorithm, which visits all the participating nodes very soon as the radius grows. This is induced by the fact that the generalized hyperplane partitioning does not guarantee a balanced split as opposed to the other three methods. Moreover, because we count all the nodes that evaluate distances as visited, the VPT∗ and the GHT∗ algorithms are a little bit handicapped. Recall 116
7. S CALABILITY C OMPARISON OF D ISTRIBUTED S IMILARITY S EARCH visited nodes (%)
VEC 100 90 80 70 60 50 40 30 20 10 0
GHT* VPT* MCAN M−Chord
0
500
1000
1500
2000
range query radius
DNA visited nodes (%)
visited nodes (%)
TTL GHT* VPT* MCAN M−Chord
100 80 60 40 20 0
0
5
10
15
range query radius
20
120 100 80 60 40 20 0
GHT* VPT* MCAN M−Chord 0
5
10
15
20
range query radius
Figure 7.6: Percentage of visited nodes that they need to compute distances to pivots during the navigation and thus the nodes that only forwards the query are also counted as visited. Note that the used dataset influences the number of visited nodes. For instance, the DNA metric function has a very limited set of discrete distance values, thus, both the native and transformation methods are not as efficient as for the VEC dataset and more peers have to be accessed. From this point of view, the M-Chord structure performs best for the VEC dataset and also for smaller radii in the DNA dataset, but it is outperformed by the MCAN algorithm for the TTL dataset. The next group of experiments, depicted by Figure 7.7, shows the computational costs with respect to the query radius. We provide a pair of graphs for every dataset. The graphs on the left (a) report the total number of distance computations needed to evaluate a range query. This measure can be considered to be the query costs in centralized index structures. The graphs on the right (b) illustrate the parallel number of distance computations, i.e. the costs of a query in the distributed environment. Since the distance computations are the most time consuming op117
0
500
1000
1500
2000
total distance comp.
range query radius TTL 180000 160000 140000 120000 100000 80000 60000 40000 20000 0
GHT* VPT* MCAN M−Chord
0
5
10
15
20
total distance comp.
range query radius DNA 400000 350000 300000 250000 200000 150000 100000 50000 0
GHT* VPT* MCAN M−Chord
0
5
10
15
range query radius
(a)
20
parallel distance comp.
GHT* VPT* MCAN M−Chord
parallel distance comp.
total distance comp.
VEC 200000 180000 160000 140000 120000 100000 80000 60000 40000 20000 0
parallel distance comp.
7. S CALABILITY C OMPARISON OF D ISTRIBUTED S IMILARITY S EARCH
VEC 4500 4000 3500 3000 2500 2000 1500 1000 500 0
GHT* VPT* MCAN M−Chord
0
500
1000
1500
2000
range query radius TTL 5000 4500 4000 3500 3000 2500 2000 1500 1000 500 0
0
5
10
GHT* VPT* MCAN M−Chord 15 20
range query radius DNA 8000 7000 6000 5000 4000 3000 2000 1000 0
GHT* VPT* MCAN M−Chord
0
5
10
15
20
range query radius
(b)
Figure 7.7: The total (a) and parallel (b) number of distance computations
118
7. S CALABILITY C OMPARISON OF D ISTRIBUTED S IMILARITY S EARCH erations during the evaluation, all the structures employ the pivot filtering criteria (as described in Section 3.2.5) to avoid as much distance computations as possible. As explained, the number of pivots used for filtering strongly affects its effectiveness, i.e. the more pivots we have the more effective the filtering is and the fewer distances need to be computed. The MCAN and the M-Chord structures use a fixed set of 40 pivots for filtering, as opposed to the GHT∗ and VPT∗ which use the pivots in the AST. Thus, objects in buckets in lower levels of the AST have more pivots for filtering and vice versa. Also, the GHT∗ partitioning implies two pivots per inner tree node, but VPT∗ contains only one pivot, resulting in half the number of pivots than for the GHT∗ . In particular, the GHT∗ has used 48 pivots in its longest branch and only 10 in the shortest one, while the VPT∗ has filtered using maximally 18 and minimally 5 pivots. Observe the effects of filtering on total distance computations graphs in Figure 7.7a. We can see that the M-Chord and MCAN structures have practically the same filtering for all the datasets. On the other hand, the VPT∗ index is always the worst, since it has the lowest number of pivots used for filtering. We can also see that the filtering was rather ineffective in the DNA dataset, where the structures have computed the distances up to twice as many objects as for the TTL and VEC datasets. Then, queries with bigger radii in the DNA dataset have to access about 60% of the whole database, which would be very slow in a centralized index. Figure 7.7b illustrates the parallel computational costs of the query processing. We can see that the amount of necessary distance computations is significantly reduced, which comes out from the fact that the computational load is divided among the participating peers running in parallel. We can see that the GHT∗ structure has the best parallel distance computation and seems to be unaffected by the dataset used. However, its lowest parallel cost is counterbalanced by the high percentage of visited nodes (shown in Figure 7.6), which in fact is strictly correlated to the parallel distance computations cost for all the structures. Note also that the increase of parallel cost is bounded by the value of 5,000 distance computations – this is best visible in the TTL dataset. This is a straightforward implication of the fact that every node has only a limited storage capacity, i.e. if a peer holds up to 119
7. S CALABILITY C OMPARISON OF D ISTRIBUTED S IMILARITY S EARCH 5,000 objects it cannot evaluate more distance computations between the query and its objects. This seems to be in contradiction with the M-Chord graph for the DNA dataset, for which the following problem has arisen. Due to the small number of possible distance values of the DNA dataset, the M-Chord transformation resulted into formation of “clusters” of objects mapped onto the same M-Chord key. Those objects had to be kept on one peer only and, thus, the capacity limit of 5,000 objects could be exceeded. VEC maximal hop count
total messages
VEC 400 350 300 250 200 150 100 50 0
GHT* VPT* MCAN M−Chord
0
500
1000
1500
2000
16 14 12 10 8 6 4 2 0
GHT* VPT* MCAN M−Chord
0
350 300 250 200 150 100 50 0
GHT* VPT* MCAN M−Chord
0
5
10
15
20
14 12 10 8 6 4 2 0
5
total messages
maximal hop count 10
1500
2000
0
15
5
10
15
20
range query radius DNA
GHT* VPT* MCAN M−Chord
0
1000
GHT* VPT* MCAN M−Chord
range query radius DNA 600 500 400 300 200 100 0
500
range query radius TTL
maximal hop count
total messages
range query radius TTL
20
25
GHT* VPT* MCAN M−Chord
20 15 10 5 0
0
5
10
15
range query radius
range query radius
(a)
(b)
20
Figure 7.8: The total number of messages (a) and the maximal hop count (b) The last group of measurements in this section, depicted in Figure 7.8, reports on the communication costs, i.e. the traffic load of the underlying computer network. Since all the structures exploit the message passing paradigm and the amount of interchanged data is 120
7. S CALABILITY C OMPARISON OF D ISTRIBUTED S IMILARITY S EARCH small (usually fitting in a few packets), we have measured the number of messages needed to solve a range query as the communication cost. By analogy, we show the total messages cost, which can be interpreted as the overall load of the underlying network infrastructure, and the parallel cost represented by the maximal “hop count”. Recall that the hop count is the number of messages sent in a serial manner, i.e. the sequence of messages forwarded from one node to another. Since the GHT∗ and the VPT∗ count all nodes involved in navigation as visited (as explained earlier), the percentage of visited nodes (Figure 7.6) and the total number of messages (Figure 7.8a) are strictly correlated for these structures. The MCAN structure needs the lowest number of messages for small ranges, but as the radius grows the number of messages increases quickly. This comes from the fact that the MCAN range search algorithm uses multicast to spread the query and, thus, one peer may be contacted with a specific query request several times. However, every peer evaluates a particular request only once. For the M-Chord structure, we can see that the total cost is considerably high even for small radii, but it grows very slowly as the radius increases. In fact, the M-Chord needs to access at least one peer for every M-Chord cluster even for small range queries, see Section 7.2. Then, as the radius increases, adjacent peers within some of the clusters need to be contacted and that increases the total messages costs. The parallel costs, i.e. the maximal hop count, are practically constant for different sizes of the radii for all the structures except the M-Chord for which the maximal hop count grows. The increase is caused by the serial nature of the current algorithm for contacting the adjacent peers in particular clusters. In summary, we can say that all the structures scale well with respect to the size of the radius. In fact, the parallel distance computation costs grow sub-linearly and they are bounded by the capacity limits of the peers. The parallel communication costs remain practically constant for the GHT∗ , VPT∗ and MCAN structures and grows linearly for the M-Chord.
121
7. S CALABILITY C OMPARISON OF D ISTRIBUTED S IMILARITY S EARCH
7.6 Scalability with Respect to the Size of Datasets Let us concern the systems’ scalability with respect to the growing volume of data stored in the structures. We have observed the performance of Range(q, r) queries on systems storing from 50,000 to 1,000,000 objects. We conducted these experiments on all datasets for the following radii: 500, 1,000 and 1,500 for the VEC dataset and radii 5, 10 and 15 for the TTL and DNA datasets. We include only one graph for each type of measurement if the other graphs exhibit the same trend, because presenting all the collected results would occupy too much space with only a limited contribution. The title of each graph in this section specifies the used dataset and the search radius r. The number of retrieved objects – see, e.g., the radius 10 for the TTL dataset in Figure 7.9 – grows precisely linearly because the data were inserted to the structures in random order. all structures
0
100 200 300 400 500 600 700 800 900
dataset size (*1000)
VEC for r = 1000 visited nodes (%)
retrieved objects
TTL for r = 10 400 350 300 250 200 150 100 50 0
90 80 70 60 50 40 30 20 10 0
GHT* VPT* MCAN M−Chord
0
200
400
600
800
1000
dataset size (*1000)
Figure 7.9: Number of retrieved Figure 7.10: Percentage of visited objects nodes Figure 7.10 depicts the percentage of nodes affected by the range query processing. For all the structures but the GHT∗ this value decreases because the dataspace becomes denser and, thus, the nodes cover smaller regions of the space. Therefore, the space covered by the involved nodes comes closer to the exact space portion covered by the query itself. As mentioned in Section 7.5, the GHT∗ partitioning is not balanced, therefore, the query processing is spread over larger number of participating nodes. Figure 7.11 presents the computational costs in terms of both total and parallel number of distance computations. As expected, the total costs (a) increase linearly with the stored data volume. This 122
7. S CALABILITY C OMPARISON OF D ISTRIBUTED S IMILARITY S EARCH
total distance comp.
VEC for r = 1000 50000 45000 40000 35000 30000 25000 20000 15000 10000 5000 0
GHT* VPT* MCAN M−Chord
0
200
400
600
800
1000
parallel distance comp.
well-known trend, which corresponds to the costs of centralized solutions, is the main motivation for designing distributed structures. The graph exhibits practically the same trend for the M-Chord and MCAN structures since they both use a filtering mechanism based on a fixed sets of pivots, as explained in Section 7.5. The total costs for the GHT∗ and the VPT∗ are slightly higher due to the dynamic sets of filter pivots. VEC for r = 1000 2500 2000 1500 1000 500 0
0
200
400
600
GHT* VPT* MCAN M−Chord 800 1000
dataset size (*1000)
dataset size (*1000)
(a)
(b)
Figure 7.11: The total (a) and parallel (b) number of distance computations The parallel number of distance computations (Figure 7.11b) grows very slowly. For instance, the parallel costs for the GHT∗ increase by 50% while the dataset grows 10 times and the M-Chord exhibits a 10% increase for doubled dataset size from 500,000 to 1,000,000. The increase is caused by the fact that the involved nodes contain more of the relevant objects while making the data space denser. This corresponds with the observable correlation of this graph and the graph in Figure 7.10 – the less nodes the structure involves, the higher the parallel costs it shows. The transformation techniques, the MCAN and the M-Chord, obviously concentrate the relevant data on fewer nodes and have higher parallel costs then. The noticeable graph fluctuations are caused by rather regular splits of overloaded nodes. Figure 7.12 presents the same results for DNA dataset. The pivotbased filtering performs less effectively for higher radii (the total costs are quite high) and it is more sensitive to the number of pivots. The distance function is discrete with relatively small variety of possible values. As mentioned in Section 7.5, for this dataset, the MChord mapping collisions may result in overloaded nodes that cannot be split. Then, the parallel costs in Figure 7.12b may be over the split 123
7. S CALABILITY C OMPARISON OF D ISTRIBUTED S IMILARITY S EARCH
total distance comp.
DNA for r = 15 450000 400000 350000 300000 250000 200000 150000 100000 50000 0
GHT* VPT* MCAN M−Chord
0
200
400
600
800
parallel distance comp.
limit of 5,000 objects.
1000
DNA for r = 15 10000 9000 8000 7000 6000 5000 4000 3000 2000 1000 0
GHT* VPT* MCAN M−Chord
0
200
400
600
800
1000
dataset size (*1000)
dataset size (*1000)
(a)
(b)
Figure 7.12: The total (a) and parallel (b) number of distance computations
total messages
TTL for r = 10 600 500 400 300 200 100 0
GHT* VPT* MCAN M−Chord
0
100 200 300 400 500 600 700 800 900
dataset size (*1000)
(a)
maximal hop count
Figure 7.13 shows the communication costs in terms of the total number of messages (a) and the maximal hop count (b). The total message costs for the GHT∗ grow faster because it contacts higher percentages of nodes. The M-Chord graphs indicate that the total message costs grow slowly but the major increase of the messages sending is in sequential manner which negatively influences the hop count. TTL for r = 10 14 12 10 8 6 4 2 0
GHT* VPT* MCAN M−Chord
0
100 200 300 400 500 600 700 800 900
dataset size (*1000)
(b)
Figure 7.13: The total messages (a) and the maximal hop count (b)
7.7 Number of Simultaneous Queries In this section, we focus on scalability of the systems with respect to the number of queries executed simultaneously. In other words, we measure the interquery parallelism [59] of the queries processing. 124
7. S CALABILITY C OMPARISON OF D ISTRIBUTED S IMILARITY S EARCH In the conducted experiments, we have simultaneously executed groups of 10–100 queries – each from a different node. We have measured the overall parallel costs of the set of queries as the maximal number of distance computations performed on a single node of the system. Since the inter-node communication time costs are lower than the computational costs, this value can be considered as a characterization of the overall response time. We have run this experiments for all datasets and have used the same query radii as in Section 7.6. In order to establish a baseline, we have measured the sum of the parallel costs of the individual queries. The ratio of this value to the overall parallel costs characterizes the improvement achieved by the interquery parallelism and we refer to this value as the interquery improvement ratio. This value can also be interpreted as the number of queries that can be handled by the systems simultaneously without slowing them down. Looking at Figure 7.14a, we can see the overall parallel costs for all the datasets and selected radii. The trend of the progress is identical for all the structures and, surprisingly, the actual values are very similar. Therefore, the difference of the respective interquery improvement ratios, shown in the (b) graphs, is introduced mainly by difference of the single query parallel costs. The M-Chord and the MCAN handle multiple queries slightly better than the VPT∗ and better than GHT∗ . The actual values of improvement ratio for specific datasets are strongly influenced by the total number of distance computations spread over the nodes (see Figure 7.7a) and, therefore, the improvement is lower for DNA than for VEC.
7.8 Comparison Summary Though all of the considered approaches have demonstrated a strictly sub-linear scalability in all important aspects of similarity search for complex metric functions, the most essential lessons we have learned from the experiments can be summarized in the following table.
125
7. S CALABILITY C OMPARISON OF D ISTRIBUTED S IMILARITY S EARCH
GHT* VPT* MCAN M−Chord
0
20
40
60
80
100
number of simultaneous queries
VEC for r = 1000
interq. improvement ratio
overall parallel d. c.
VEC for r = 1000 45000 40000 35000 30000 25000 20000 15000 10000 5000 0
7 6 5 4 3 2 1 0
0
20
(b)
20
40
60
overall parallel d. c.
GHT* VPT* MCAN M−Chord 80 100
number of simultaneous queries
interq. improvement ratio
0
60
number of simultaneous queries
(a) TTL for r = 10 200000 180000 160000 140000 120000 100000 80000 60000 40000 20000 0
40
TTL for r = 10 2.5 2 1.5 1 0.5 0
0
20
40
overall parallel d. c.
150000 100000 50000 0
0
20
40
60
80
number of simultaneous queries
(a)
100
interq. improvement ratio
(b)
GHT* VPT* MCAN M−Chord
200000
60
GHT* VPT* MCAN M−Chord 80 100
number of simultaneous queries
(a) DNA for r = 15 250000
GHT* VPT* MCAN M−Chord 80 100
DNA for r = 15 2.5 2 1.5 1 0.5 0
0
20
40
60
GHT* VPT* MCAN M−Chord 80 100
number of simultaneous queries
(b)
Figure 7.14: The overall parallel costs (a) and interquery improvement ratio (b)
126
7. S CALABILITY C OMPARISON OF D ISTRIBUTED S IMILARITY S EARCH ∗
GHT VPT∗ MCAN M-Chord
single query excellent good satisfactory satisfactory
multiple queries poor satisfactory good very good
In the table, the single query column expresses the power of a corresponding structure to speed up the execution of one query. This is especially useful when the probability of concurrent query requests is very low (preferably zero), so only one query is executed at a time and the maximum number of computational resources can be exploited. On the other hand, the multiple queries column expresses the ability of our structures to serve several queries simultaneously without degrading the performance by waiting. We can see that there is no clear winner considering both the single and the multiple query performance evaluation. In general, none of the considered structures has a poor performance of single query execution, but the GHT∗ is certainly the most suitable for this purpose. However, it is also the least suitable structure for concurrent query execution – queries solved by the GHT∗ are practically executed one after the other. The M-Chord structure has the opposite behavior. It can serve several queries of different users in parallel with the least performance degradation, but it takes more time to evaluate a single query.
127
Chapter 8
Conclusions Traditionally, search has been applied to structured (attribute-type) data yielding records that exactly match the query. A more modern type of search, similarity search, is used in content-based retrieval for queries involving complex data types such as images, videos, time series, text documents or DNA sequences. Similarity search is based on approximate rather than exact relevance using a distance metric that, together with the database, forms a mathematical metric space. The obvious advantage of similarity search is that the results can be ranked according to their relevance. Many interesting metric space techniques improving the effectiveness of the similarity query evaluation were published in the literature. The problem of similarity search was also deeply discussed in the recent book [74]. However, currently prevalent centralized similarity search mechanisms are time-consuming and not scalable, thus only suitable for relatively small data collections. This dissertation thesis investigated the possibility of combining the similarity indexing techniques with the power of distributed computing infrastructures. The scalable distributed paradigms, such as the GRID or Peer-to-Peer systems, offer practically unlimited computational and storage resources. However, the existing techniques cannot be simply run in such an environment, instead, they must be carefully redesigned and adjusted to cope with the requirements of the efficient distributed processing. This thesis focused on the scalable decentralized peer-to-peer techniques with emphasis on the metric based similarity search.
129
8. C ONCLUSIONS
8.1 Summary In the first stage, we provide the necessities for understanding the metric spaces. We give examples of distance measures to illustrate the wide applicability of structures based on metric spaces and define several similarity queries. In the next chapter, we try to emphasis on the problem of scalability. We first show the techniques used to partition the metric space and we describe two advanced diskmemory based similarity index structures. We also show on a few experimental results that the scalability of the centralized structures is rather limited. Thus, we define our scalability challenge: “Design a metric index structure that has significantly better scalability than just linear.” Promising techniques that are able to scale better then linearly are based on distributed computing, specifically, the peer-topeer data networks. Our next chapter thus survey important existing techniques in this area. The remaining parts present the contributions of this dissertation thesis. In Chapter 5, we propose a novel scalable and distributed similarity search structure based on metric space. It is fully scalable and can distribute the data over practically unlimited number of independent peers, growing or shrinking as necessary. It has no centralized component and thus doubtless hot-spots are avoided. In addition, the parallel search time becomes practically constant for arbitrary data volumes and thus we meet the requirement of our scalability challenge. Chapter 6 presents experimental results for our novel structure on different real-life datasets. We study not only the performance of range and k-nearest neighbors queries, but also the scalability of the whole system. The last chapter shows some improvements made to the original structure and provides an extensive comparative study of our structures and two other recently published distributed similarity search techniques.
8.2 Research Directions We have ideas for many improvements and challenges that we plan to design in the future. 130
8. C ONCLUSIONS • The imbalanced tree is the main problem of the Address Search Tree structure, which is the core of inter-peer navigation. Thus, we would like to design a balanced version of the tree and, possibly, modify it to a multi-way search tree. • During the experiments, we have observed that some peers are accessed more often and evaluate more distance computations than the others. As expected, the load is not divided equally among the participating peers. We would like to try to adopt some load balancing techniques known for peer-to-peer networks to our similarity search structures. • We would also like to extend the number of supported similarity queries. For example, we would like to process a similarity join in a distributed environment. • Another goal is to verify properties of the proposed structure in real and functional applications. We would like to develop a system for image retrieval that would support similarity queries.
131
Bibliography [1] Karl Aberer, Philippe Cudr´e-Mauroux, Anwitaman Datta, Zoran Despotovic, Manfred Hauswirth, Magdalena Punceva, and Roman Schmidt. P-Grid: a self-organizing structured P2P system. SIGMOD, 32(3):29–33, September 2003. [2] Karl Aberer and Manfred Hauswirth. An overview of peer-topeer information systems. In Witold Litwin and G´erard L´evy, editors, Distributed Data & Structures 4, Records of the 4th International Meeting (WDAS 2002), Paris, France, March 20-23, 2002, volume 14 of Proceedings in Informatics, pages 171–188. Carleton Scientific, 2002. [3] Helmut Alt, Bernd Behrends, and Johannes Blomer. ¨ Approximate matching of polygonal shapes (extended abstract). In Proceedings of the seventh annual symposium on Computational geometry, pages 186–193. ACM Press, 1991. [4] Giuseppe Amato, Fausto Rabitti, Pasquale Savino, and Pavel Zezula. Region proximity in metric spaces and its use for approximate similarity search. ACM Trans. Inf. Syst., 21(2):192–227, 2003. [5] Farnoush Banaei-Kashani and Cyrus Shahabi. Swam: a family of access methods for similarity-search in peer-to-peer data networks. In CIKM ’04: Proceedings of the Thirteenth ACM conference on Information and knowledge management, pages 304–313. ACM Press, 2004. [6] Michal Batko, Claudio Gennaro, Pasquale Savino, and Pavel Zezula. Scalable similarity search in metric spaces. In Proceedings of the Sixth Thematic Workshop of the EU Network of Excel-
133
B IBLIOGRAPHY lence DELOS on Digital Library Architectures. to appear in LNCS, Springer, June 2004. [7] Christian Bohm, ¨ Stefan Berchtold, and Daniel A. Keim. Searching in high-dimensional spaces: Index structures for improving the performance of multimedia databases. ACM Computing Surveys, 33(3):322–373, September 2001. [8] Benjamin Bustos, Gonzalo Navarro, and Edgar Chvez. Pivot selection techniques for proximity searching in metric spaces. In Proc. of SCCC01, pages 33–40, 2001. [9] Edgar Ch´avez, Gonzalo Navarro, Ricardo A. Baeza-Yates, and Jos´e Luis Marroqu´ın. Searching in metric spaces. ACM Computing Surveys (CSUR), 33(3):273–321, September 2001. [10] Paolo Ciaccia, Danilo Montesi, Wilma Penzo, and Alberto Trombetta. Imprecision and user preferences in multimedia queries: A generic algebraic approach. In Proceedings of the First International Symposium on Foundations of Information and Knowledge Systems, volume 1762 of Lecture Notes in Computer Science, pages 50–71. Springer-Verlag, 2000. [11] Paolo Ciaccia and Marco Patella. Bulk loading the M-tree. In Proceedings of th 9th Australasian Database Conference (ADC’98), Perth, Australia, pages 15–26, 1998. [12] Paolo Ciaccia and Marco Patella. The M2 -tree: Processing complex multi-feature queries with just one index. In DELOS Workshop: Information Seeking, Searching and Querying in Digital Libraries, 2000. [13] Paolo Ciaccia, Marco Patella, and Pavel Zezula. M-tree: An efficient access method for similarity search in metric spaces. In Matthias Jarke, Michael J. Carey, Klaus R. Dittrich, Frederick H. Lochovsky, Pericles Loucopoulos, and Manfred A. Jeusfeld, editors, VLDB’97, Proceedings of 23rd International Conference on Very Large Data Bases, August 25-29, 1997, Athens, Greece, pages 426– 435. Morgan Kaufmann, 1997.
134
B IBLIOGRAPHY [14] Paolo Ciaccia, Marco Patella, and Pavel Zezula. Processing complex similarity queries with distance-based access methods. In Hans-Jorg ¨ Schek, F`elix Saltor, Isidro Ramos, and Gustavo Alonso, editors, Advances in Database Technology - EDBT’98, 6th International Conference on Extending Database Technology, Valencia, Spain, March 23-27, 1998, Proceedings, volume 1377 of Lecture Notes in Computer Science, pages 9–23. Springer, 1998. [15] Kenneth L. Clarkson. Nearest neighbor queries in metric spaces. In Proceedings of the twenty-ninth annual ACM symposium on Theory of computing, pages 609–617. ACM Press, 1997. [16] Gregory Cobena, Serge Abiteboul, and Am´elie Marian. Detecting changes in XML documents. In IEEE International Conference on Data Engineering, San Jose, California, USA (ICDE’02), pages 41–52. IEEE Computer Society, 2002. [17] Douglas Comer. Ubiquitous B-Tree. ACM Computing Surveys (CSUR), 11(2):121–137, 1979. [18] Adina Crainiceanu, Prakash Linga, Johannes Gehrke, and Jayavel Shanmugasundaram. P-tree: a p2p index for resource discovery applications. In WWW Alt. ’04: Proceedings of the 13th international World Wide Web conference on Alternate track papers & posters, pages 390–391, New York, NY, USA, 2004. ACM Press. [19] Robert Devine. Design and implementation of DDH: A distributed dynamic hashing algorithm. In Proceedings of the 4th International Conference on Foundations of Data Organization and Algorithms (FODO), volume 730, pages 101–114, Chicago, 1993. [20] Vlastislav Dohnal. Indexing Structures fro Searching in Metric Spaces. PhD thesis, Faculty of Informatics, Masaryk University in Brno, Czech Republic, May 2004. [21] Vlastislav Dohnal, Claudio Gennaro, Pasquale Savino, and Pavel Zezula. D-Index: Distance searching index for metric data sets. Multimedia Tools and Applications, 21(1):9–33, 2003.
135
B IBLIOGRAPHY [22] Ronald Fagin. Combining fuzzy information from multiple systems. In Proceedings of the Fifteenth ACM SIGACT-SIGMODSIGART Symposium on Principles of Database Systems, June 3-5, 1996, Montreal, Canada, pages 216–226. ACM Press, 1996. [23] Ronald Fagin. Fuzzy queries in multimedia database systems. In Proceedings of the Seventeenth ACM SIGACT-SIGMOD-SIGART Symposium on Principles of Database Systems, June 1-3, 1998, Seattle, Washington, pages 1–10. ACM Press, 1998. [24] Fabrizio Falchi, Claudio Gennaro, and Pavel Zezula. A contentaddressable network for similarity search in metric spaces. In Proceedings of DBISP2P, pages 126–137, 2005. [25] Christos Faloutsos, Ron Barber, Myron Flickner, Jim Hafner, Wayne Niblack, Dragutin Petkovic, and William Equitz. Efficient and effective querying by image content. Journal of Intelligent Information Systems (JIIS), 3(3/4):231–262, 1994. [26] Volker Gaede and Oliver Gnther. Multidimensional access methods. ACM Computing Surveys, 30(2):170–231, 1998. [27] Prasanna Ganesan, Beverly Yang, and Hector Garcia-Molina. One torus to rule them all: multi-dimensional queries in p2p systems. In WebDB ’04: Proceedings of the 7th International Workshop on the Web and Databases, pages 19–24, New York, NY, USA, 2004. ACM Press. [28] Claudio Gennaro, Pasquale Savino, and Pavel Zezula. Similarity search in metric databases through hashing. In Proceedings of the ACM Multimedia 2001 Workshops, pages 1–5. ACM Press, 2001. [29] Gnutella home page. http://www.gnutella.com/. [30] Sudipto Guha, H. V. Jagadish, Nick Koudas, Divesh Srivastava, and Ting Yu. Approximate XML joins. In Michael J. Franklin, Bongki Moon, and Anastassia Ailamaki, editors, ACM SIGMOD International Conference on Management of Data, Madison, Wisconsin, June 3-6, 2002, pages 287–298. ACM, 2002. 136
B IBLIOGRAPHY [31] Antonin Guttman. R-Trees: A dynamic index structure for spatial searching. In Beatrice Yormark, editor, Proceedings of the 1984 ACM SIGMOD International Conference on Management of Data, Boston, Massachusetts, pages 47–57. ACM Press, 1984. [32] James L. Hafner, Harpreet S. Sawhney, William Equitz, Myron Flickner, and Wayne Niblack. Efficient color histogram indexing for quadratic form distance functions. IEEE Transactions on Pattern Analysis and Machine Intelligence (PAMI), 17(7):729–736, July 1995. [33] G´ısli R. Hjaltason and Hanan Samet. Ranking in spatial databases. In Max J. Egenhofer and John R. Herring, editors, Advances in Spatial Databases, 4th International Symposium, SSD’95, Portland, Maine, USA, August 6-9, 1995, Proceedings, volume 951 of Lecture Notes in Computer Science, pages 83–95. Springer Verlag, 1995. [34] G´ısli R. Hjaltason and Hanan Samet. Incremental similarity search in multimedia databases. Technical Report CS-TR-4199, Computer Science Department, University of Maryland, College Park., November 2000. [35] G´ısli R. Hjaltason and Hanan Samet. Index-driven similarity search in metric spaces. ACM Transactions on Database Systems (TODS’03), 28(4):517–580, 2003. [36] Gisli R. Hjaltason and Hanan Samet. Index-driven similarity search in metric spaces. ACM Trans. Database Syst., 28(4):517– 580, 2003. [37] Daniel P. Huttenlocher, Gregory A. Klanderman, and William J. Rucklidge. Comparing images using the Hausdorff distance. IEEE Transactions on Pattern Analysis and Machine Intelligence (TPAMI’93), 15(9):850–863, 1993. [38] H. V. Jagadish. Linear clustering of objects with multiple attributes. In SIGMOD ’90: Proceedings of the 1990 ACM SIGMOD international conference on Management of data, pages 332–342, New York, NY, USA, 1990. ACM Press. 137
B IBLIOGRAPHY [39] H. V. Jagadish, Beng Chin Ooi, Kian-Lee Tan, Cui Yu, and Rui Zhang. iDistance: An adaptive b+-tree based indexing method for nearest neighbor search. ACM Trans. Database Syst., 30(2):364–397, 2005. [40] Theodore Johnson and Padmashree Krishna. Lazy updates for distributed search structure. In Proceedings of the ACM International Conference on Management of Data (SIGMOD’93), volume 22(2), pages 337–346, 1993. [41] Michael B. Jones, Marvin Theimer, Helen Wang, and Alec Wolman. Unexpected complexity: Experiences tuning and extending can. Technical Report MSR-TR-2002-118, Microsoft Research, December 2002. [42] John L. Kelly. General Topology. D. Van Nostrand, New York, 1955. [43] Teuvo Kohonen. Self-Organization and Associative Memory. Springer-Verlag, 1984. [44] George Kollios, Dimitrios Gunopulos, and Vassilis J. Tsotras. Nearest neighbor queries in a mobile environment. In Proceedings of Internation Workshop on Spatio-Temporal Database Management, Edinburgh, Scotland, September 10-11, 1999 (STDBM’99), volume 1678 of Lecture Notes in Computer Science, pages 119–134. Springer, 1999. [45] Flip Korn and S. Muthu Muthukrishnan. Influence sets based on reverse nearest neighbor queries. In Proceedings of the 2000 ACM International Conference on Management of Data, May 16-18, 2000, Dallas, Texas, USA (SIGMOD’00), pages 201–212. ACM, 2000. [46] Brigitte Kroll ¨ and Peter Widmayer. Distributing a search tree among a growing number of processors. In Proceedings of the 1994 ACM SIGMOD International Conference on Management of Data / SIGMOD ’94, Minneapolis, Minnesota, pages 265–276, 1994. ˚ [47] Per-Ake Larson. Dynamic hashing. BIT (Nordisk tidskrift for informationsbehandling), 18(2):184–201, 1978. 138
B IBLIOGRAPHY [48] Dongwon Lee. Query Relaxation for XML Model. PhD thesis, University of California, Los Angeles, 2002. One chapter about metrics on XML documents (XML data trees). [49] V. I. Levenshtein. Binary codes capable of correcting spurious insertions and deletions of ones. Problems of Information Transmission, 1:8–17, 1965. [50] Vladimir I. Levenshtein. Binary codes capable of correcting spurious insertions and deletions of ones. Problems of Information Transmission, 1:8–17, 1965. [51] Witold Litwin. Linear hashing: A new tool for file and table addressing. In Sixth International Conference on Very Large Data Bases, October 1-3, 1980, Montreal, Quebec, Canada, Proceedings, pages 212–223. IEEE Computer Society, 1980. [52] Witold Litwin, Marie-Anne Neimat, and Donovan A. Schneider. Rp*: A family of order preserving scalable distributed data structures. In Jorge B. Bocca, Matthias Jarke, and Carlo Zaniolo, editors, VLDB’94, Proceedings of 20th International Conference on Very Large Data Bases, September 12-15, 1994, Santiago de Chile, Chile, pages 342–353, 1994. [53] Witold Litwin, Marie-Anne Neimat, and Donovan A. Schneider. LH* - a scalable, distributed data structure. ACM Transactions on Database Systems (TODS’96), 21(4):480–525, 1996. [54] Napster home page. http://www.napster.com/. [55] Gonzalo Navarro. A guided tour to approximate string matching. ACM Computing Surveys (CSUR), 33(1):31–88, 2001. [56] S. B. Needleman and C. D. Wunsch. A general method applicable to the search for similarities in the amino acid sequence of two proteins. Journal Of Molecular Biology, 48:443–453, 1970. [57] David Novak and Pavel Zezula. M-Chord: A scalable distributed similarity search structure. In Proceedings of First International Conference on Scalable Information Systems (INFOSCALE 2006), Hong Kong, May 30 - June 1. IEEE Computer Society, 2006. 139
B IBLIOGRAPHY [58] J. A. Orenstein and T. H. Merrett. A class of data structures for associative searching. In PODS ’84: Proceedings of the 3rd ACM SIGACT-SIGMOD symposium on Principles of database systems, pages 181–190, New York, NY, USA, 1984. ACM Press. ¨ [59] M. Tamer Ozsu and Patrick Valduriez. Distributed and parallel database systems. ACM Comput. Surv., 28(1):125–128, 1996. [60] Michal Parnas and Dana Ron. Testing metric properties. In Proceedings of the thirty-third annual ACM symposium on Theory of computing (STOC’01), pages 276–285. ACM Press, 2001. [61] R. Rammal, G. Toulouse, and M. A. Virasoro. Ultrametricity for physicists. Reviews of Modern Physics, 58(3):765–788, 1986. [62] Sylvia Ratnasamy, Paul Francis, Mark Handley, Richard Karp, and Scott Shenker. A scalable content addressable network. In Proc. of ACM SIGCOMM 2001, pages 161–172, 2001. [63] Sylvia Ratnasamy, Mark Handley, Richard Karp, and Scott Shenker. Application-level multicast using content-addressable networks. Lecture Notes in Computer Science, 2001. [64] Thomas Seidl and Hans-Peter Kriegel. Efficient user-adaptable similarity search in large multimedia databases. In The VLDB Journal, pages 506–515. Morgan Kaufmann, 1997. [65] Thomas Seidl and Hans-Peter Kriegel. Efficient user-adaptable similarity search in large multimedia databases. In The VLDB Journal, pages 506–515, 1997. [66] Ioana Stanoi, Divyakant Agrawal, and Amr El Abbadi. Reverse nearest neighbor queries for dynamic databases. In ACM SIGMOD Workshop on Research Issues in Data Mining and Knowledge Discovery, pages 44–53, 2000. [67] Ioana Stanoi, Mirek Riedewald, Divyakant Agrawal, and Amr El Abbadi. Discovery of influence sets in frequently updated databases. In The VLDB Journal, pages 99–108. Morgan Kaufmann, 2001. 140
B IBLIOGRAPHY [68] Ion Stoica, Robert Morris, David Karger, M. Frans Kaashoek, and Hari Balakrishnan. Chord: A scalable peer-to-peer lookup service for internet applications. In Proceedings of ACM SIGCOMM, pages 149–160. ACM Press, 2001. [69] C. Tang, Z. Xu, and S. Dwarkadas. Peer-to-peer information retrieval using self-organizing semantic overlay networks, 2002. [70] Jeffrey K. Uhlmann. Satisfying general proximity/similarity queries with metric trees. Information Processing Letters, 40(4):175–179, 1991. [71] Beverly Yang and Hector Garcia-Molina. Comparing hybrid peer-to-peer systems. In Proceedings of the Twenty-seventh International Conference on Very Large Databases, pages 561–570, 2001. [72] Congjun Yang and King-Ip Lin. An index structure for efficient reverse nearest neighbor queries. In Proceedings of the 17th International Conference on Data Engineering, April 2-6, 2001, Heidelberg, Germany (ICDE’01), pages 485–492. IEEE Computer Society, 2001. [73] Peter N. Yianilos. Excluded middle vantage point forests for nearest neighbor search. In 6th DIMACS Implementation Challenge, ALENEX’99, Baltimore, MD, 1999. [74] Pavel Zezula, Giuseppe Amato, Vlastislav Dohnal, and Michal Batko. Similarity Search: The Metric Space Approach, volume 32 of Advances in Database Systems. Springer-Verlag, 2005.
141