The scientific design of the scaled facility called Purdue University Multi-Dimensional. Integral Test Assembly (PUMA) has been carried out under the project " ...
NUREG/CR-6309 PU-NE 94/1
Scientific Design of Purdue University Multi-Dimensional Integral Test Assembly (PUMA) for GE SBWR
Manuscript Completed: February 1996 Date Published: April 1996 Prepared by M. Ishii, S. T. Ravankar, R. Dowlati, M. L. Bertodano, I. Babelli, W. Wang, H. Pokhama, V. H. Ransom, R. Viskanta, T. Wilmarth, PU J. X Han, NRC
School of Nuclear Engineering Purdue University West Lafayette, IN 47907-1290
Prepared for Division of Systems Technology Office of Nuclear Regulatory Research U.S. Nuclear Regulatory Commission Washington, DC 20555-0001 NRC Job Code L2202
CISTRiPTON OP THIS
t Si—LfO*
'irrn
£
The dynamic response depends on the form of the transfer function, 1/Q(s), whereas the linear stability of the system depends on the root of the characteristic equation given by Q(s) = 0 .
(5.77)
The characteristic function, Q(s) can be nondimensionalized by introducing proper scales for various variables [5.7-5.9]. Thus QV) = QV, N N, • - •N ) lf
2
m
(5.78)
where N^..., N are the same dimensionless groups listed in Section 5.3. This indicates that the dynamics of the system can be simulated if the scaling parameters, Nj,..., N , are identical between the two systems. m
m
Since our general scaling is based on these dimensionless groups, as discussed in Section 5.3, it is assured that the dynamic behavior and instability characteristics can be well-simulated in the reactor pressure vessel of the integral test facility if the flow can be considered close to one-dimensional. The SBWR reactor pressure vessel has a relatively large lid, which causes it to be dominated by the axial flow. Furthermore, the present reduced height system has the aspect ratio reasonably close to the prototype at (/M)R = 2.5. This number, which is a good scale of the three dimensionality of the facility, is better matched than most of the full-height integral test facilities for similar purposes. 5.4.2 Break and ADS Flow Scaling The RPV is depressurized by the discharge of steam or water from a break and by the SRV and DPVflowswhen these systems are activated. In the early phase of
5-25
the depressurization, the upstream pressure is sufficient to cause sonic velocity at the minimum-area section of the steam line venturi, or at the throat of the SRV or DPV, and at die break location. A bottom drain line break (BDLB) also results in choked flow when cavitation occurs at the throat or minimum area in die break line. As the system depressurizes, a transition to unchoked flow will occur. For all these cases, me velocity at die break or the diroat will be me same in me model as in the prototype since the pressures and thermodynamic conditions are the same. The prototype-to-model ratio of velocity multiplied by die diroat area should equal 200 in order to satisfy die conditions for similarity of die mass and energy inventories, as previously discussed. For choked flow, no additional restrictions on me geometry or loss mechanisms are necessary, but additional restrictions are needed to preserve the pressure or pressure ratio at which me transition from choked flow to unchokedflowwill occur. Two quite different nozzle geometries are found in the SBWR system. First, die steam line contains a converging-diverging de Laval-type nozzle mat is designed to limit die steam discharge rate in the case of a main steam line break, yet result in litde pressure loss under normal operation. The low pressure loss under normal operation is achieved by die use of a low-angle conical diffuser downstream of die nozzle throat so mat flow separation is avoided and good pressure recovery is achieved. This type of nozzle will become choked whenever a modest drop in me discharge pressure occurs as a result of a break or otiier decrease in the downstream flow resistance (decrease in discharge pressure). The flow will remain choked until die upstream pressure drops to near me downstream value. The flow in short nozzles and valve contraction sections can be considered to be nearly frictionless and adiabatic so tiiat an isentropic model of die flow process is a good approximation. This idealized process is illustrated in Figures 5.1 and 5.2 for flow through a converging-diverging nozzle. Figure 5.1 is a surface plot of die static pressure ratio (ratio of static pressure to isentropic stagnation pressure)tiiroughoutthe nozzle for a range of me exit pressure ratios. Notice tiiat die diroat pressure ratio drops as die downstream pressure is lowered until sonic flow is reached at die tiiroat. From mat point on, die upstream pressure distribution is constant and independent of die downstream pressure (choked). The pressures in me downstream, or diverging section of die nozzle, have a rather complex behavior due to me possibility of a normal shock (me discontinuous rise in pressure shown in Figure 5.1). Theflowvelocity changes from supersonic to subsonic across die normal shock and subsonic diffusion downstream of me normal shock results in an increase in die static pressure as die flow velocity decreases. At a sufficiendy low discharge pressure, the normal shock will occur downstream of me nozzle exit Thus, we see mat it is possible for such a nozzle to be choked under a
5-26
wide range of pressure ratios. This is more clearly illustrated in Figure 5.2, where the nondimensional mass flow parameter is plotted as a function of the ratio of the nozzle exit pressure to the upstream stagnation pressure. Note that the mass flow rate is constant up to a pressure-ratio of approximately 0.96. The SRV and DPV systems have a different nozzle geometry that consists of a smooth contraction down to the throat followed by an abrupt increase in the flow area. This type of nozzle has quite a different flow characteristic. The abrupt increase in flow area downstream of the throat results in large pressure losses due to the irreversibility associated with turbulence downstream of the abrupt increase in area. The static pressure ratio distribution through such a nozzle is illustrated in Figure 5.3 as a function of the downstream pressure ratio. The behavior of this type of nozzle for low downstream pressure (choked) is even more complex than for the converging-diverging nozzle and consists of separated flow regions, possible oblique shocks combined with a normal shock, and reattachment of the flow to the cylindrical downstream passage. Figure 5.3 is an approximaterepresentationof the pressure distribution throughout this type of nozzle for two flow conditions: (1) the initial unchoked portion which is reasonably modeled by the Bourda-Carnot model up to the point of choked flow, and (2) the chokedflowwith supersonic expansion to the cylindrical pipe area followed by a normal shock. This latter condition is characterized by constant conditions both upstream and downstream of the throat, as shown in Figure (5.3). The actual flow characteristic of such a nozzle is dependent upon the geometry, throat based area ratios, and to a lesser extent on Reynolds number. The pressure distribution downstream of the throat under choked conditions will change more continuously with the lowering of the downstream pressure than illustrated in Figure (5.3). Compare Figure 5.3 with 5.1 or Figure 5.4 with 5.2 and note the considerable drop in the discharge pressure that occurs prior to reaching the choked condition, indicated by the constancy of the upstream pressures. In this case, the downstream pressure losses have been modeled using the Bourda-Carnot loss model for an abrupt area change. The dramatic difference in the flow characteristics between this nozzle and the converging-diverging nozzle previously discussed can be seen by comparing the dimensionless massflowas a function of pressure ratio (compare Figure 5.4 with Figure 5.2). In this case, choked flow is maintained only up to a pressure ratio of 0.68, which is characteristic of an orifice or any discharge point having an abrupt area change followed by a cylindrical diffuser. Note that a modest pressure recovery occurs even in the cylindrical diffuser, (Figure 5.3).
5-27
In order to maintain similarity in the scaled mass and energy inventories it is necessary to scale the throat area between the model and the prototype by the ratio 1/200 for choked flows. However, in order to assure correct transition to subsonic or unchoked flow, it will also be necessary to preserve the diffusion characteristics of the downstream section of the nozzle. This requires that geometric similarity be maintained, and to a lesser degree that Reynolds similarity be maintained. Thus, the nozzle contour and especially the diverging section cone angle must be geometrically similar in the model and the prototype. For nozzles having abrupt area change, it is simply necessary for the cylindrical section area ratio to be similar to the prototype. For a break flow area, at, with break flow velocity, u , the boundary flow scaling requirement is given by t
(a u ) = ( a ^ u t
t
R
line
) = (a ) O W R = 1/200 . R
line
(5.79)
R
For critical flow, the ratio of velocity at the throat is given by (u ) = 1. From boundary flow scaling, (a u ) = 1/200. Since the model has prototypic pressure, the density ratio is p = 1. Thus, the area ratio is t
t
t
R
R
R
(a ) = 1/200 . t
R
(5.80)
This shows that the throat area where chocking occurs should be scaled differently from loop sections in which (aii e)R = 1/100 is used. n
One additional case needs to be considered, and that is the case of a cavitating venturi such as would occur at a bottom drain line break (BDLB). This case is more complex than the ideal gas case just discussed. However, the considerations are very similar and die resulting conditions for similarity are the same. The reason for this is that even though die choking phenomena is due to the onset of vaporization caused by the lowering of the static pressure to less than the saturation pressure, the pressure behavior is primarily governed by the same inviscid flow mechanism. The pressure recovery/loss mechanism that occurs downstream of an abrupt area change is more complex man the single phase flow case, but it is also mainly governed by the geometry and is thus, approximately simulated by preserving geometric similarity. As the pressure downstream of a nozzle or break approaches the upstream pressure, a transition to unchokedflowwill occur. This has been illustrated on Figures (5.1) and (5.3) for the two different nozzle geometries, die steam line venturi and
5-28
the sudden expansion nozzle respectively. Each of these nozzles has quite different unchoked flow characteristics that need to be considered relative to the flow area scaling that is used to preserve volumetric similarity of loop components. First consider the steam line venturi which is a converging-diverging nozzle and is designed to have negligible head loss under normal unchoked operating conditions. The pressure drop for this component is negligibly small, and so is the associated minor loss coefficient Thus, the resultant intercomponent flow will be dominated by other losses in the interconnecting components, such as line friction and minor flow losses. For this case no additional scaling considerations are needed for unchoked flow and the nozzle throat can be scaled by 1/200 as needed to maintain chokedflowsimilarity. The second case of the sudden expansion nozzles or breaks requires some additional consideration since, in this case, relatively large flow losses occur downstream of the throat and these losses will have a significant effect on the unchoked rate of flow. For unchoked flow between components, the size of the required connection line is determined by the requirement to maintain similarity of the total pressure difference between the components connected by the line. This requirement, in terms of the total loss coefficient of the line, is expressed by
Ap = K m
P(Uline) x m
7
(5-81)
- ^ l
(5.82)
and
Ap = K P
p
The inter-component pressure difference is prototypic, from pressure scaling APR = 1, thus, Km
(Uline)t (Uline)im
=4 .
(5.83)
(Uline)R
Thus the scaling criterion for the unchoked break flow witii the prototypic Ap can
5-29
be given in terms of Euler number defined as
Eu
_
Ap
(5.84)
PuLe
or (EU)R
1
=
(5.85)
(Uline)R
This implies that the correct scaling ratio is given by ( u ^ ) ! which should be preserved between the model and the prototype. This criterion is different from the case for a flow governed by the gravitational head which is given by Eqs. (5.71) and (5.72) For an interconnecting line having a nozzle of throat area, a , the total loss coefficient, K, is given by t
a
K — K i ^ + Kt
line
a
(5.86)
t
Therefore,
Kline + K
aiine t
a
K,• m K,p J
t
Jm a
Kline + K
t
(5.87)
line
a
t
In general, for the prototype (Kiin ) < 1 and (K ) = 2 while for the PUMA facility (Kiine)m is not much larger than 1 and (K ) = 2. It is required that this ratio be e p
t
t
p
m
close to what is specified by Eq. (5.83). This will be the case if
r
aiine/at
12
>>1
which insures that the second term of Eq. (5.86) dominate the overall K factor. Since (a ) = 1/200, the above requirement can be satisfied for (aj^R = 1/100, t
R
5-30
which is in agreement with the geometrical scaling. In conclusion, for the break flow or for theflowin the ADS lines, the pipe size area can be scaled according to (aiine)R = 1/100 and the nozzle, where choking can occur, should be scaled with throat area ratio (a>R = 1/200 for unchoked flow as well. t
5.4.3 Scaling for Flows Driven by Elevational Change In the preceding scaling analysis only maintenance of prototypic pressures between components as a result of flow through horizontal components in which there is no change in hydrostatic head was considered. Similar considerations can be applied to components involving gravitational head change, such as the GDCS lines, by simply partitioning the pressure change into hydrostatic pressure change associated with elevation change and the pressure change occurring in components having no elevational change. Similarity is maintained if the pressure change in the vertical sections is scaled by 1/4 while the pressure changes for the horizontal part are maintained prototypical. One final situation occurs wherein the intercomponent pressure difference is not prototypic, which for PUMA this occurs between the drywell and the injection points into the wetwell. In this case, the pressure change is primarily due to the hydrostatic head change. Pressure differences produced in this way are insufficient, resulting in a chokedflowand thus the resistance between components should be scaled using low velocity natural circulation flow considerations. The flow in the GDCS injection lines is essentially single phase liquid. A simple momentum integral equation for these lines is given by du. , pu2
f-
+ (Pv~Pc) = pgH
(5.88)
where /, H and d are the line length, driving head and hydraulic diameter, respectively. Eq. (5.88) shows that the liquid hydrostatic head controls the GDCS flow against the liquid inertia, friction and pressure difference between the vessel and containment. For the fully depressurized case under the quasi-steady state condition, the flow is determined by the balance between friction and gravity. Thus, the velocity scale ratio is given by
5-31
H u = f//d + K
11/2
(5.89)
R
Furthermore, the mass inventory scaling requires that a
g
u
(5.90)
=1
3o Uo
where a is the line flow area. By combining these two requirements, the line size can be obtained: g
1/2 SoR^oR a
gR =
(5.91)
VT
H f7/d + K JR
which clearly indicates that the GDCS line flow area scale ratio, agR, should be increased to compensate for the increased friction number. This increase in the flow area beyond the geometrical scale, aoR, guarantees that the mass flow rate is scaled to preserve the mass inventory. Similar scaling calculations can be made for PCCS draining and venting. For venting, consider the hydrostatic driving head generated by the level difference between the PCCS vent exit and the water level in the vertical vent line. If this height, H, is scaled according to the basic geometrical scale, then HR = J R. Thus, the single phase gasflowscaling requires that 0
a
vR — &oR !
«
(5.92)
This relation shows that the venting line flow area should be increased to compensate for the increased friction for a scaled model. The drywell/wetwell venting depends on the pressure difference between the suppression pool and containment, as well as the water height above the vents, H. Hence,
5-32 PDW - PSUP >
H
(5.93)
P g
For a reduced height system there are several approaches for setting this pressure difference. However, the best way to scale this Ap is according to the height scale as discussed in Section 5.3.3, thus (PDW
_
PSUP)R = *oR =
I/
(5-94)
4
because for most components such as the vessel, suppression pool and GDCS, the pressure distribution is close to hydrostatic. By scaling the pressure difference using / R , all the component pressure balances in the containment can be easily preserved. It follows that HR = Z R. The size of the opening can be determined by a scaling criterion similar to that of the PCCS venting. 0
0
Since the flow from the GDCS to the RPV is gravity driven, a comparison should be made between the driving head and resistance as in Eq. (5.89). A dimensionless number called the GDCS number, N Q , is defined as D
N
G D
=
gH fl/d + K
a Uo 0
1/2
(5.95)
5.4.4 Relative Velocity and Flow Regime The present scaling method, based on the integral response function, implies that the parameters given by the following expressions are correctly scaled: Apx/p = N - N g
Z u
s u b
+ N
(5.96)
flash
and Apx/p„ JR
(5.97)
=1
Since Eq. (5.38) was derived from an energy balance over the heated (core) section, an additional term was necessary for the energy balance over the entire RPV internals. Thus Eq. (5.96) has an additional term which accounts for vapor generation in the chimney section. This term is the flashing number, N , which takes into account the effect of the adiabatic vapor generation due to flashing. This flashing number is explained in detail in a following section and is defined by Eq. (5.112). For the full pressure scaling, this leads to the similarity of vapor quality given by flash
00R
=1
(5.98)
5-33
The two phase flow regimes depend on geometry, vapor quality and relative velocity. The effect of the relative velocity is scaled by the drift flux number given by N„ =
u
(5.99) 0
In the drift flux formulation, the drift velocity is given in the form [5.6], •
V
Co-1
si =
j +
(5.100)
where the total volumetric flux is J=u
0
1 + Apx/p„
(5.101)
Hence, the drift flux number becomes N = ( C - l ) ( l + A p x / p ) + d
0
(5.102)
g
The right-hand-side terms represent the slip due to void and velocity profile and the local slip between phases, respectively. Since the distribution parameter, C , is a weak function of the density ratio [5.6], the first term is completely scaled. The local drift velocity depends on the two phaseflowregimes and the hydraulic diameter [5.10]. The major effect of the local slip is mostly limited to the chimney section of the RPV. For a relatively large-diameter channel, the local drift velocity [5.10] is approximately given by 0
< > = 0.54Vgd" &g i
for
d < 30 A l-^— \ gAp
(5.103)
and ggAp = 3 Pf 2
1/4
for
d > 30
g^P
The former applies to slug flow and the latter to cap bubbly flow. This shows that for a channel having d smaller than 30 \(c / gAp), the bubbly flow becomes slug flow at a higher gas flux, whereas for a larger channel the bubblyflowbecomes cap
5-34
bubbly flow. Therefore, for a chimney section of an integral facility, it is necessary to have
(d)
> 30-\/-^-
chim
(5.104)
in order to simulate the two phase flow regimes. A hydraulic diameter smaller than above leads to a formation of slug flow accompanied by a cyclic flow behavior which is a characteristic of small channels. However, the simulation of the two phase flow regime in the chimney section leads to some distortion of the drift flux number. This is due to the fact that the reference inlet velocity is scaled by UQR = ZoR»but the local relative velocity itself remains prototypic. This will lead to some distortion in the void fraction since it can be expressed as
a = TT-.
ij
-r-
(5-105)
7
C J + < > 0
where j = Uo(Apx/p ). However, it can be seen that the effect of «Vgj> > is small if j is large. A comparison of Eqs. (5.102) and (5.105) indicates that the impact of the distortion in «Vgj> > / u is much smaller for the void fraction than for the drift flux number. g
g
0
5.4.5 Critical Heat Flux Scaling (CHF) The CHF condition at low flow has been reviewed by Leung [5.11], Katto [5.12], and Mishima and Ishii [5.13] among others. The modified Zuber correlation [5.10] for low flow is given by
q " = 0.14(l^oc)p * c
g
qgAp fg
(5.106)
pi
Based on the limited data on blowdown experiments, the above correlation is recommended for the mass velocity range of -24 (downflow)to 10 g/cm -s [5.13]. It is evident that this correlation is based on a pool boiling CHF mechanism and has been developed for LOCA studies. 2
5-35
Katto's correlation [5.12] for lowflowis given by
op G /
f
= T *G
10.043
'sub
2
(5.107)
0
2
0043
which implies that the critical quality is x n
h. A fi k Ja p f
(5.129)
s
Experimentally, however, it was found that for a noncondensable gas content of greater than one percent with different injection diameters, no noticeable chugging was observed. It should also be emphasized that the transition criteria given above are the only ones available in the literature, and the validity of the transition criterion Eq. (5.129) under various test conditions has yet to be established.
5-42
5.4.8 Vent Phenomena in Suppression Pool In the initial blowdown stage, the total gasflowthrough the vertical flow channels and horizontal vents into the suppression pool is expected to be very large. Under this condition, the ventflowforms a horizontal jet at the exit of the horizontal vents. The axial extent of this jet depends on the condensation rate, concentration of noncondensable gas and jet instability. For the scaling of the condensation phenomena for this horizontal jet, the first criterion to be satisfied is the one given by Eq. (5.115), which scales the global interfacial area for condensation. By denoting the width and height of the horizontal vents by W^ and Z^, respectively, the total exitflowarea is given by ain = n^CWin/jn) .
(5.130)
From the boundaryflowscaling, the gas volumetricflowrate should satisfy
QgR = (afoUink = aoR^ll6R
Hence, for PUMA one has Q
gR
•
(5.131)
= 1/200.
For the prototype system having circular vents of a diameter Dj, the interfacial area is ajp = (n7cDj/j) .
(5.132)
p
For the model system, interfacial area is given by a^ = {2n(W + / ) / , } in
i n
.
m
However, scaling the inlet velocity by (UJI,)R =
"V/ R
a
wo •
R
° • -T3T D
0»T »P
=
0
(5.133) »
w e
n a v
e
( 5 J 3 4 )
5-43
Thus, it is required that
2 QgR
(W + 1 ^ D,op
fJR
to
n
~ R 71
= 1
(5.135)
The height scaling of the vents implies
= JoR =
D,op
(5.136)
4
The axial extent of the horizontal jet / j is scaled by the pool size. Thus,
* JR =
^OR"
(5.137)
= -T77 10
Using Eqs. (5.122), (5.130) and (5.131), the condensation scaling criterion reduces to 20 7C
1 (Win — + D,op
) m
1 .
(5.138)
This can be approximated by
nR
PHead* and the PCCS vents into the suppression pool. After this, the cycle continues. For each cycle, the minimum pressure difference Apmu, decreases as the SP pressure increases due to the noncondensable gas vented into it. Eventually, suppression pool pressure exceeds the drywell pressure after a number of vent cycles. When the suppression pool pressure is higher than that of the drywell by 3.45 kPa (0.5 psia), gas passes through the vacuum breakers. When the vacuum breakers are opened, the drywell and suppression pool pressure equalize. The time period required for each venting is Ati + At2- The time period Ati is almost constant and independent of PDW- However, At is dependent on Ap,^. If the Ap,^ = 0, that is PDW = Psp. then At becomes longest For the scaling of the venting phenomena, the time periods Ati and At need to be evaluated. 2
2
2
2
First, we derive the time period Ati. At the end of this period the PCCS condenser is filled with noncondensables and condensation is totally stopped. If Vp^ is the volume of the condenser tubes, then Vpcc is the maximum volume of air required to fill the condenser tubes so mat condensation is totally stopped. In the PCCS condenser, the flow near the tube inlet is similar to forced convection and near the tube end the flow is stagnant The air accumulates at the bottom of the condenser tube. For simplicity and conservatism, it is assumed that the air begins to accumulate from the bottom of the condenser tube, and the condensation stops when the air has occupied the whole tube length. For each fraction of the air filled, the condensation area is decreased by that amount S
For thefirstfillingof the condenser with steam containing c fraction of air, the volume occupied by the air is Vp^Ce. This leaves v ( l - c ) of the volume for the next filling. After the second filling the remaining volume in the PCCS condenser is VpccsO-Co) . Similarly, after the third filling, the volume left is VpccsCl-Co) . Thus, after nfillings,the volume left is Vp^l-Co)". 0
pccs
2
3
Thus, the accumulated air after nfillingsis given by
0
5-55
n
Vpccs[l-(l-Co) ] .
(5.177)
Let tci be the time for singlefillingof the condenser, then for nfillingsthe required time is approximately given by ten = t d d - C o r
1
.
(5.178)
Thus the total time required tofillthe condenser by noncondensable is oo
o©
f1
At = 2 W = td £ (l-Co)"- = ~ • d-179) n=l n=l o The characteristic time for a single filling of PCCS condenser volume by steam/air mixture is given by c
t
c
l
=
t
=
W . m
.
(5.180)
Here, p is the density of the vapor mixture entering the PCCS condenser. The rate of steam produced in the drywell, m, is given by
3
m = T - .
(5.181)
Where q is the decay heat rate of the RPV core. From Eqs. (5.180) and (5.181) the time constant for the prototype is tp = 0.31 seconds, and for the model tm = 0.16 seconds. Thus, the time constant for the model is half that of the prototype. This is consistent with the scaling of time for the model chosen. In Figure 5.6, the time period, At,required to fill the PCCS condenser with noncondensables as the function of noncondensable concentration is shown. For 10% of air concentration in steam, the time period At, for the prototype is tpX 10 = 3.16 seconds. For 1% of air concentration, this time period is 31.6 seconds. For the PUMA, At^ = 1.58 seconds for c = 0.1 and at c = 0.01 (1%), At = 15.8 s. 0
Jm
0
5-56
After the condensation has totally stopped, the pressure in the drywell increases due to the addition of steam. Now we evaluate At2, the time period at which the drywell pressure exceeds the suppression pool pressure by an amount greater than the water head, Pnead' exists between SP and drywell. If SP and DW are at the same pressure, then from the ideal gas law we have mat
At?
R?
PHead
l
'DW
(5.182)
fg
Thus, V
PHead DW
At, =
(5.183)
TR (q/i ) 2
f g
where T is the absolute temperature of steam, R is the gas constant for steam and VDW is the drywell volume. 2
Now we take the prototype-to-model time period ratio: PHead VDW
(At ) = 2
R
TR (q// 2
(5.184)
fg)
When the fluids used and the pressure condition are same for the prototype and model, then (TR ) = 1. For 1/4 height, 1/400 volume and 1/200 mean flow rate scaled model, one obtains 2
R
(At ) = 2
R
(5.185)
This indicates that the time period for the model is shorter than for the prototype. Typical time period for the prototype at 206 kPa (30 psia) drywell pressure can be calculated from Eq. (5.183). At a decay power level of 40 MW, it can be shown that At = 12.63 seconds. The corresponding time period for the model is At2,n = 1.6 seconds. 2p
5-57
The above time period was estimated assuming both the DW and SP were initially at the same pressure level. However, as shown in Figure 5.5, the pressure difference between the DW and SP could be anywhere from Apnead 0. The At2 given in Eq. (5.183) gives the maximum time required for the vent to open when the PCCS condenser stops condensation due to accumulated noncondensables. t 0
P
It can be assumed that the time period required to vent the noncondensable gas from the PCCS is negligible. Hence, for each venting cycle, the time period is Ati + At2- The time period (AtO is higher (- 30 seconds) for PCCS performance when the air concentration in the drywell is reduced. For most cases, At is smaller than 12.63 seconds for the reason mentioned above. Hence, the vent cycle period is largely determined by the (Ati) time period, which is well-scaled in the model. However, during the initial phase of the decay heat cooling, when the air concentration in the drywell is higher, the time period (Ati + At ) for the model will be shorter than in the prototype, so frequent venting is expected in the model. However, as the drywell air concentration is reduced, the time period required for PCCS venting in the model will be close to the correct by scaled time period of the prototype. It is expected that for the long time transients, the model PCCS venting will perform as required applying the current scaling methodology. 2
2
In the above analysis it was assumed that the time period required to vent the noncondensable gas from the PCCS is negligible. This venting period can be estimated by considering the pressurization rate of drywell due to steam input from RPV and the venting rate of noncondensable gas from PCCS to SP. The height of the submergence in the scaled facility is l/4th of the prototype. Hence, it is important to check whether during the PCCS venting period the steam is co-venting through the horizontal vent into suppression pool or not. For the co-venting to occur the containment pressurization should exceed the head difference between the horizontal vent and the PCCS vent line. Calculations were carried out on the venting of PCCS gas into the SP. It was assumed that during the PCCS venting period no condensation occurs. When the volume of the gas vented equals the PCCS condenser volume, the PCCS will re-start the condensation process. These assumptions give a conservative estimation of the vent period. For SBWR, the horizontal vent is located 800 mm below the PCCS vent level. The results of the calculations show that PCCS venting requires 3.2 seconds. At the end of this time period the water level in the vertical vent pipe was depressed by 164.3 mm. For 1/4 height scaled facility, the horizontal vent is located 200 mm below the PCCS vent level. The results of the calculations show that PCCS venting requires 1.1 seconds. At the end of this time period, the water level in the vertical vent pipe was depressed by 92.3 mm. This indicates that there would be no escape of steam
5-58
from the drywell through the horizontal vent to the SP. Also, the time period for venting is small compared to the total PCCS cyclic time period. This insures that co-venting from the horizontal vent line will not occur during the PCCS venting in the prototype SBWR and in the 1/4 height scaled facility. 5.4.13 Condensation in PCCS Condensers The PCCS condensers provide decay heat removal by condensing steam from the drywell and supplying condensate water to the RPV through the GDCS tanks. The scaling of the heat transfer rate through the condenser is given by = Ntubes N ^ l/Ai(Tg - T )
Vpccs
(5.186)
p
where Ntubes is the number of PCCS condenser tubes, N its is the number of PCCS units, U is the overall heat transfer coefficient, Aj is the inner surface area of a condenser tube, and T and T are the steam and PCCS pool temperatures, respectively. The overall heat transfer coefficient is given by un
g
p
he
2k
hD
w
p
(5.187) 0
In the RHS of Eq. (5.187), the first term corresponds to the tube side condensation heat transfer coefficient, the second term corresponds to the tube wall conduction heat transfer coefficient, and the third term corresponds to the outside tube pool heat transfer coefficient. The condensation heat transfer coefficient is for the condensation of steam and air or nitrogen mixture in a vertical tube. Siddique et al. [5.20] have studied the condensation heat transfer coefficient for steam-air mixture in the tube. The condensation heat transfer Nusselt number given by them is 1.44 N U c
= i^5L
=
6
.213 R e
0223
"'a.w
"a*b
w
a,b ;
where
Ja
-1.253
(
5
1
8
g
)
5-59
c (T -T ) - _£J_£ !^L (Jakob number) 'ft p
J a
R e
=
b
w
P m U m
* (Reynolds number)
(5.189)
(5.190)
Mm
W
a
a
Noncondensable mass fraction
=
ih + m a
(5.191)
v
The pool side heat transfer coefficient, h , depends on whether pool side transfer is due to boiling or natural convection. For natural convection, the heat transfer Nusselt number is given by p
0 4
Nu = _ E = ^ 1 = 0.021(GrPr) p
k
(5.192)
p
where ) L Ltube e Gr = ^g B ( T - T P^ w
0
( G r a s h o f n u m b e r )
Pr = — (Prandtl number) . a
( 5 1 9 3 )
(5.194)
For the correct scaling of heat removal by the PCCS condensers we should have
[Qpccs/mifg] m
= 1
(5.195)
Qpccs/m ifg J p
where m is the inlet steam mass flow rate to the PCCS condenser. From Eqs. (5.186) and (5.191), the scaling requirement for PCCS condenser heat removal rate is given as
5-60
Ntubes Numts U Ai(T -T )/mif b
p
(5.196)
= 1
g
If the prototype and model have the same operating pressure condition and use the same operating fluid (water), then the temperature difference can be preserved. From Eqs. (5.195) and (5.196) we obtain, Qpccs/m i
fg
m
Q p c c s / *fg
N„
w
tubes
Jp
N N
p
First, we evaluate
•*
v
w
A
m
m
units
Um l/r
or
m
A
l pJ i
(Tb-TU p/m (Tb-T )p
•
*
m
0'fg)p p
(5.197)
(*fg)m
p
m
m
M
R
Based on the integral scaling criteria, and using the prototypic condenser tube diameter, the PUMA condenser surface area is scaled by 1/200. For 1/4 height scaled PUMA, the number of condenser tubes is scaled by 1/50. The vapor volume flow rate in PUMA is scaled by the power scaling. Therefore, the vapor volume flow rate in PUMA is scaled by 1/200. In the present scaling, we have a heat transfer area scaling of 1/200 and boundary mass flow rate scaling of 1/200. Hence, N N
m
A Ap m
1 PJ tube 1 P J units N
200
(5.198)
and
rh
n
200
Since the temperature differences are preserved
(5.199)
the model, we have from Eq.
5-61
(5.197) through (5.199),
QpccsMl *f
g
-r
; yQpccs/m/fg
= (U) .
(5.200)
R
As the steam-nitrogen mixture flows into the condenser, the mixture Reynolds number decreases along a tube due to the condensation of the steam. The scaling ratio of the Reynolds number, RemR, is 1/4. The condensation heat transfer correlation of Siddique et al. [5.20] gives the ratio of h•
t
= ^ 6-3 m »
*'*'*
frfrfr
ICS VENT
T^*
ICS CONDENSATE
UPPER DW
HORIZONTAL VENT
'TE
•
-
*
•
•
•
:
,
ICS CONDENSATE PCCS 4c ICS VENTS
a
1 o o
VACUUM BREAKER
0_ SRV
z o en ui 01
o_ -> GOCS V EQUAL'Z *" 1.16 m
LOWER DW
/ /
/ /
/ /
/ /
/ /
/
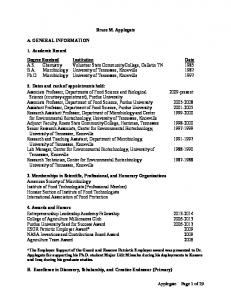
Figure 9.2 Plan view of main vessels in PUMA
/
/
/
I
9-28
References 9.1 SBWR Standard Safety Analysis Report (SSAR), GE Nuclear Energy, 25A5113 Rev. A, August 1992. 9.2 SBWR Tier 1 Design Certification Document, GE Nuclear Energy, 25A5354 Rev. A, February 1993. 9.3 Communication between S. Revankar of Purdue University and Y. Parlatan of Brookhaven National Laboratory (BNL), January 1994 (available from the U.S. NRC Public Document Room). 9.4 U.S. Nuclear Regulatory Commission Request for Proposal No. RS-RES-93-049, November 25,1992. 9.5 This reference number is not used in the report. 9.6 Han, J. T., Bessett, D. E., Shotkin, L. M., "NRC Confirmatory Testing Program for SBWR," Proceedings of the Twenty-first Water Reactor Safety Information Meeting, October 25-27, Bethesda, Maryland (1993). 9.7 Liang, K-S, "Experimental and Analytical Study of Direct Contact Condensation of Steam in Water," Ph.D. Thesis, MIT (1994).
10-1
10. SUMMARY AND CONCLUSIONS The U.S. NRC requires independent confirmatory data for the General Electric (GE) Nuclear Energy Simplified Boiling Water Reactor (SBWR) which can be used to assess the uncertainties associated with the use of the RELAP5 code for the simulation of SBWR safety system performance under accident and operational transient modes. In order to satisfy this requirement, the NRC has awarded a contract to the Purdue University School of Nuclear Engineering to obtain this data through the design, construction, and operation of a scaled integral test facility named the Purdue University Multidimensional Integral Test Assembly (PUMA). The major objectives of the confirmatory research program are to: • provide integral data to the NRC for the assessment of the RELAP5/CONTAIN code for SBWR application • assess the integral performance of the GDCS and PCCS • assess SBWR phenomena important to LOCAs and other transients These objectives are being accomplished by the following sequence of tasks: • develop a well balanced and justifiable scaling approach for use in design of the PUMA facility, • identify important SBWR phenomena associated with LOCAs and applicable operational transients and, based on the identified phenomena, establish a test matrix • design the scaled integral test facility, including necessary and sufficient instrumentation • construct the scaled integral facility • develop boundary and initial conditions and procedures for conducting the integral tests based on the scaling methods and by using computer code calculations (RELAP5) • perform the required integral system tests under strict quality control procedures and provide associated documentation The scaling methods that have been developed for the purposes of the PUMA facility design and the results of the scientific design analyses are documented in this report. The necessary scaling relationships for design of a full pressure, but less than full height scaled facility have been developed. The criteria that have been used for scaling are to maintain similarity of; integral system response (loops), interaction between
10-2
components, and preservation of local phenomena. The results of this development show that all of the objectives of the program can be achieved by use of a full pressure but reduced-height scaled facility. Parametric preliminary design studies show that a 1/4 height scaled facility could best meet all the program objectives without compromising either geometric similarity or preservation of the important two-phase phenomena. The 1/4 height scaled facility is easily constructed and satisfies the geometrical requirements in order to preserve important thermal-hydraulic phenomena. The details of the PUMA scientific design, and the supporting analysis are documented herein. The basic design features 1/4 height and 1/400 volume scales which result in a 1/2 time scale. The facility has a reactor pressure vessel height of 6 m and 0.6 m diameter. The system contains all the important safety and non-safety systems of the SBWR. The facility is designed to simulate the phenomena at and below 1.03 MPa (150 psia) following SBWR scram. The pressure is scaled 1:1 and the power is scaled by 1/200 of prototype. The facility is designed with 340 instrumentation devices to measure pressure, temperature, flow rate, local void fraction, two-phase flow void fraction and noncondensable gas concentration. The site for the facility has been identified and the preliminary layout of the facility is completed. Purdue has contracted the mechanical design and construction of the PUMA facility to an engineering firm (Phoenix Solutions Company, Lie, Minneapolis, MN). In conclusion, all program objectives can be achieved using a 1/4 height scaled facility. The resulting design fits nicely within the range of scaled national and international SBWR experimental facilities that either exist or are in the construction phase. This will provide the ability to cross check the system behavior for important thermal-hydraulic phenomena. These characteristics will help increase the accuracy of uncertainty assessments that will be based on data from this facility.
NRC FORM 335
U.S. NUCLEAR REGULATORY COMMISSION
12-89) NRCM1102,
saot.szoz
1. REPORT NUMBER (Attigned by NRC. Add Vol., Supp., Rev., and Addendum Numbers, if any.)
BIBLIOGRAPHIC DATA SHEET
NUREG/CR-6309
(See instructions on the reverse) 2. TITLE AND SUBTITLE
S c i e n t i f i c Design of Purdue University Multi-Dimensional Integral Test Assembly (PUMA) f o r 6E SBWR
3.
DATE REPORT PUBLISHED MONTH
1
April
'
YEAR
1996
4. FIN OR GRANT NUMBER
L2202 5. AUTHOR (S)
6. TYPE OF REPORT
M. I s h i i , S.T. Revankar, R. Dowlati, M.L. Bertodano, I . B a b e l l i , W. Wang, H. Pokharna, V.H. Ransom, R. Viskanta, T. Wilmarth, PU D.T. Han, NRC
7. PERIOD COVERED (Inclusive Dates/
7/26/93 - 12/15/94 8 . P E R F O R M I N G O R G A N I Z A T I O N — N A M E A N D A D D R E S S (!f NRC, provide Division, Office or Region, U.S. Nuclear Regulatory Commission, and mailing address; ifcontractor, name and mailing address.)
provide
School of Nuclear Engineering Purdue University West Lafayette, IN 47907-1290
9. SPONSORING ORGANIZATION - NAME AND ADDRESS itf NRC, type "Same as above"; if contractor, provide NRC Division, Office or Region, U.S. Nuclear Regulatory Commiss and mailing address.)
D i v i s i o n of Systems Technology O f f i c e of Nuclear Regulatory Research U.S. Nuclear Regulatory Commission Washington, DC 20555-0001 10. SUPPLEMENTARY NOTES
0. T. Han, NRC Project Manager 1 1 . A B S T R A C T (200 vmrds or less)
The s c i e n t i f i c design of the scaled f a c i l i t y (PUMA) has been carried out under the project "Confirmatory Integral System Testing for GE SBWR Design". The design was based on the three level scaling method developed for t h i s task. The f i r s t l e v e l of scaling i s based on the integral response function. The second l e v e l scaling i s for the boundary flow of mass and energy between components. The t h i r d l e v e l of scaling i s focused on the key l o c a l phenomena and c o n s t i t u t i v e r e l a t i o n s . T h e . f a c i l i t y has 1/4 height and 1/100 area r a t i o , scaling. This corresponds to a volume scale of 1/400 and power scaling of 1/200. The time w i l l run twice as fast i n the model as predicted by the present scaling method. The PUMA i s scaled for full.pressure and i s intended to operate at and below 150 psia following scram. The f a c i l i t y models a l l the major components of SBWR.
12
K E Y W O R D S / D E S C R I P T O R S (List words or phrases that will assisj researchers in locating the report. I
advanced l i g h t water reactor, s i m p l i f i e d b o i l i n g water reactor(SBWR) loss-of-coolant-accident(LOCA), thermalhudraulic s i m u l a t i o n , scaling c r i t e r i a , integral system t e s t i n g , i n t e g r a l system experiment design, i n t e g r a l system s c a l i n g , local phenomena scaling
13. AVAILABILITY STATEMENT
unlimited 14. SECURITY CLASSIFICATION (This Page)
. . .
,
unclassified (This
Report)
unclasssified 15. NUMBER OF PAGES 16. PRICE
NRC FORM 335 (2-891