Memory & Cognition 2008, 36 (3), 567-577 doi: 10.3758/MC.36.3.567
Primacy or recency effects in forming inductive categories Sean Duffy
Rutgers University, Camden, New Jersey and
L. Elizabeth Crawford
University of Richmond, Richmond, Virginia Five experiments provide evidence for a primacy effect in the formation of inductive categories. Participants completed a category induction task in which they observed and reproduced a set of lines that varied in length but were serially ordered so that they increased or decreased in length. Subsequent estimates of the average of the distribution were systematically biased in the direction of stimuli encountered at the beginning of the induction task, suggesting that initially encountered stimuli exert greater weight in a category representation than do subsequent stimuli. We offer possible explanations for why this primacy effect might arise.
Since Ebbinghaus’s (1885/1913) classic study on memory, psychologists have systematically explored serial position effects across a variety of domains in memory and cognition. The majority of these studies have been concerned with the relative salience or retention of information encountered early (primacy effect) versus later (recency effect) in a sequence. Although there is a large body of literature on serial position effects in memory recall (e.g., Gershberg & Shimamura, 1994; Howard & Kahana, 1999), relatively little research has explored primacy or recency effects in inductive categories that are formed through experience with a distribution of category instances. Since such categories are generally established by encountering stimuli over the course of time, it is possible that the temporal or sequential order in which people experience a distribution of stimuli influences the underlying representation. This article addresses the question of whether stimuli encountered when one initially forms an inductive category are allocated greater weight in the representation than are subsequent stimuli by exploring retrospective judgments about the distribution of stimuli consisting of lines that varied in length but are not randomly drawn from a distribution. Inductive Categories Inductive categories are established through experience with an observed distribution of stimuli (Duffy, Huttenlocher, & Crawford, 2006; Huttenlocher, Hedges, & Vevea, 2000). Typically, such categories exhibit a graded structure, with category instances varying in magnitude or value along some relevant stimulus dimension. For example, one could travel to a city such as Philadelphia and, on the basis of experience with the particular individu-
als encountered during the trip, form a category of Philadelphians that includes distributional information, such as their typical height or intelligence, as well as extreme values of the category, such as the most helpful or least helpful Philadelphian, and so on. Such categories can be described statistically as a bounded range along a stimulus dimension having a central prototypic value that can be instantiated as the average value of all the experienced instances (Duffy, Huttenlocher, Hedges, & Crawford, 2007).1 Later, one might be asked to report the prototypic value of the category or even its boundaries. A variety of experimental studies have addressed how people form inductive categories from experience with stimuli that vary along one or more feature dimensions (Duffy & Kitayama, 2007; Flannagan, Fried, & Holyoak, 1986; Fried & Holyoak, 1984; Huttenlocher et al., 2000; Posner & Keele, 1968). In many of the tasks employed in these studies, participants have learned a new category by observing and making judgments about a series of category instances consisting of stimuli that varied along some dimension, such as square grid patterns presented as works of abstract art (Fried & Holyoak, 1984), dot patterns of geometric figures that varied in degree of distortion (Posner & Keele, 1968), blood cells that varied in size (Duffy & Kitayama, 2007), or lines that varied in length (Huttenlocher et al., 2000). After category induction, the participants have been tested on whether they learned the category by having them classify novel instances as to their category membership. In these prior studies on category induction, a common assumption has been that each stimulus that is encountered in the induction phase is allocated equal weight in
S. Duffy,
[email protected]
567
Copyright 2008 Psychonomic Society, Inc.
568 Duffy and Crawford the category representation that is formed. However, it is possible that a category representation may be based on a subset of instances or that certain stimuli may be allocated greater or lesser weight in the category representation that is formed. For example, rather than establishing a category based on the several hundred Philadelphians one encounters during a trip, it may be possible to form a category that includes only 12 individuals or that allocates greater weight to 12 specific individuals and little or no weight to the several hundred others. At first glance, it may seem irrational for people to base a category representation on a subset of instances, because such a strategy will not take advantage of all possible information that might increase the accuracy of the category representation. However, an alternative possibility is that basing a category on a smaller subset of stimuli may actually result in a representation that reflects the actual distribution of stimuli with a relatively high degree of accuracy, while limiting the cognitive complexity of forming the category. Consider why. When stimuli are randomly drawn from a distribution, the error surrounding the sample average of experienced instances is the standard error of the mean, which is the standard deviation (SD) of the sample divided by the square root of the number of instances encountered (Huttenlocher et al., 2000). Because the inverse square root function decreases rapidly as it approaches an asymptote of zero, the error surrounding the sample average quickly diminishes after only a relatively small number of stimuli have been encountered. If a category formed from only 8 instances provides an estimate of the category average that is about as accurate as a representation formed from 32 or 64 instances, it seems reasonable that people will use a smaller set. The critical assumption that underlies this possibility is that stimuli are randomly drawn from the entire range of the category, a possibility we will return to in the General Discussion section. The hypothesis that inductive categories may be formed from information about a subset of all experienced instances is based on recent work on information sampling and adaptive cognition, which has shown that people often rely on simplified strategies for making decisions that sample information from the environment in ways that reduce the amount of information processing yet result in relatively accurate judgments (Fiedler & Juslin, 2006; Gigerenzer, 2000; Todd & Gigerenzer, 2000, 2007). For instance, in the domain of correlation detection, Kareev (2000) has suggested that relying on fewer instances leads to enhanced detection of correlation between feature dimensions (see also Juslin, Fiedler, & Chater, 2006, and Kareev, Lieberman, & Lev, 1997, for criticisms of this account). In their work on information sampling, Stewart, Chater, and Brown (2006) have recently proposed a model of decision by sampling, in which people make judgments about an attribute relative to a small sample of attributes drawn from memory, rather than relying upon the attribute’s location on an abstract internal psychological scale. Such sampling provides a parsimonious account for several classic problems in the decision-making literature. Similarly, when forming inductive categories, people may sample only a subset of experienced instances because,
in most ecological situations in which people form new categories (i.e., traveling to Philadelphia for the first time), category instances are experienced in a relatively random order with respect to the category’s distribution. For instance, when one travels to Philadelphia, it is rarely the case that the first few hundred people encountered are less than 5 ft in height, whereas the latter few hundred are all more than 6 ft. Rather, one experiences a random sample of individuals of various heights over the course of the trip. It is possible that the processes underlying category induction take advantage of the principle that people experience the stimuli that form the basis for inductive categories in a random order and sample only a subset of the stimuli or allocate greater weight to a subset of category instances. If inductive categories are formed on the basis of a subset of stimuli, rather than on the basis of all experienced category instances, a key question is which stimuli are likely candidates to be included in the representation. Given the fact that people establish inductive categories by experiencing stimuli over time, there appear to be two alternatives as to which stimuli may play a larger role in establishing an inductive category. The first possibility is that stimuli experienced initially when one forms a new category are allocated greater weight than are subsequent stimuli, resulting in a primacy effect in which initial stimuli exert greater influence upon the representation. A second possibility is that the most recent stimuli one encounters are allocated greater weight in the category representation, resulting in a recency effect in which more recent stimuli exert greater influence on the resulting representation. Primacy Effect or Recency Effect? There are several reasons to suspect that people may base a category representation on instances they encountered initially, as opposed to those encountered more recently, which we will briefly describe below. Primacy effect. It may be the case that using a subset of initial stimuli and attending less to recent stimuli reduces demands on later processing. Having acquired a “good enough” approximation of the distribution early on, one can devote cognitive resources to other potentially important tasks, rather than continually updating a category representation with new stimuli, which, when the order of the stimuli is random, does not appreciably increase the accuracy of the representation. Thus, in forming a new category representation, one might allocate attention to stimuli to a greater extent upon the first few instances, encoding these new exemplars of the category or updating an abstract prototypic representation with information about new stimuli. After a certain number of stimuli, attention may be allocated to other aspects of the environment, and later stimuli may become less likely to be encoded as exemplars or used to update an already established representation. Researchers on memory and judgment have found a number of psychological tasks that exhibit primacy effects related to the serial position of a stimulus or piece of information in a sequence. In the impression formation literature, information acquired initially about a target individual is allocated greater weight than is information acquired later on (Asch, 1946; Anderson & Jacobson, 1965).
Inductive Categories 569 Tversky and Kahneman (1974) described the cognitive bias of anchoring, in which people rely too heavily on the first piece of information that they receive about an object at the expense of later information that may, in fact, be more informative for making rational judgments. Dennis and Ahn (2001) provided evidence for a primacy effect in a causal-learning task in which participants learned how a medical drug affected a patient. Similarly, in a study on covariation detection, Yates and Curley (1986) found that the correlation between initially presented items (flowers that varied in color and the region they came from) influenced the perceived strength of the association to a greater extent than did stimuli encountered later in the series. Although none of these studies involved category induction per se, the processes they revealed may lead representations of inductive categories to give greater weight to initially experienced instances than to instances encountered later in a sequence. Recency effect. Alternatively, category representations may allocate greater weight to recent stimuli because these stimuli represent the most up-to-date information about the distribution of instances within the category. For example, when one tries to estimate the average height of one’s grandchildren, using experiences from the most recent family visit would be more rational than using experiences that occurred years before. In addition, recent stimuli are likely to be encoded more accurately than stimuli experienced in the distant past. For instance, one’s memory for the sweetness of an apple consumed this morning is likely to be more accurate than memory for the initial apples consumed when one was a child. Thus, a category based on the most recent stimuli one has experienced may be more accurate than one based on category instances experienced initially, when one first formed the category. Empirical support for the possible influence of recent stimuli in categories has come from several psychophysical studies in which sequence effects in magnitude judgment have been explored. On any given trial, judgments are often biased by the immediately preceding trial in tasks requiring judgments of weight (Parducci, 1964), area (DeCarlo & Cross, 1990; Petzold & Haubensak, 2001, 2004), and sweetness (Schifferstein & Kuiper, 1997). Some studies have suggested that the immediately preceding stimulus serves as a frame of reference for the current stimulus (e.g., Holland & Lockhead, 1968). Other models have been proposed in which the immediately preceding stimulus and information about the entire set together influences judgments (e.g., DeCarlo & Cross, 1990). Although these psychophysical tasks differ in a number of ways from those involved in inductive category formation, they suggest ways in which recently encountered stimuli may receive greater weight in a category representation than do initially experienced instances. The Present Experiments As was mentioned earlier, as long as stimuli are presented in a random order, as has been the case in prior studies of inductive category formation, the influence of initial and recent stimuli is impossible to differentiate,
because both subsets contain stimuli that, on average, exhibit the same central tendency. However, the effects of stimulus order are possible to differentiate if the order of stimuli is not random but, rather, maximizes the difference between initially experienced and recently experienced category instances. If people allocate greater weight to initial stimuli, subsequent estimates of the category’s average value should be biased toward initially presented stimulus values. Alternatively, if people’s inductive categories weight more recent instances more heavily, their retrospective judgments of the category average should be biased toward the stimulus values of recent stimuli. In the present study, five experiments were performed to explore whether primacy or recency effects would be observed in inductive categories of simple perceptual stimuli (lines that varied in length). In all the experiments, the category induction task consisted of a simple line-drawing task. Participants observed and reproduced a series of lines that were serially ordered so that small lines were presented initially and long lines subsequently or vice versa. By serially ordering the stimuli, we maximized the difference in magnitude between those stimuli experienced initially and those experienced at the end of category induction. After learning the distribution of the lines, the participants were asked to reproduce (Experiment 1) or produce (Experiments 2–5) the average value of the lines that they had seen, as a measure of the distribution’s prototypic value. We explored the extent to which people’s estimates of the average of the distribution were biased (e.g., over- or underestimated) in the direction of lines observed at the beginning or the end of the category induction task. Although our main interest was in people’s estimates of the average of the set, we also asked the participants to draw the smallest and largest lines of the initial set. We included these trials in order to demonstrate that a category representation was actually formed from the set of presented instances. If it was, estimates of the smallest and largest stimuli should be adjusted toward the central region of the distribution (i.e., estimates of the shortest line should be overestimated and estimates of the longest line should be underestimated). This effect, known as the central tendency bias, arises when stimuli near the edges of a category are estimated (see, e.g., Huttenlocher et al., 2000). However, because memory for stimuli near category boundaries is more exact than memory for stimuli near the category prototype, the effect of the order of the initial stimuli in the induction task should be weaker for estimates of the smallest and largest stimuli than for estimates of the average of the distribution. Experiment 1 In Experiment 1, we used a brief serial estimation task in which participants observed and reproduced a set of 13 lines that varied in length. In one condition, the first 10 lines were serially presented in such a way that they increased in length, whereas in the other, the lines decreased in length. The question was how the serial ordering of these initial 10 stimuli would influence estimates of
570 Duffy and Crawford
Method
Participants. One hundred fifty-two college students completed the experiment in partial fulfillment of a course requirement. The sample consisted of 59 males and 93 females. Materials and Design. The stimuli in the experiment were 10 lines that varied in length from 19 to 134 mm in approximately 13‑mm increments. The resulting lengths were 19, 32, 45, 57, 70, 83, 95, 108, 121, and 134 mm. The lines were black and 1 mm in width. The lines were presented in a paper packet approximately 51 mm wide and 279 mm long. The lines were presented at the center with respect to the width but at a random location along the length of the page for each trial, with no line ending closer than 1 in. to the edges of the sheet. Between each stimulus page, there was a blank sheet of paper for the participants to draw their response lines. The participants were randomly assigned to one of two experimental conditions. In the small-to-large (SL) condition, the first 10 lines were presented in the packet in order of size in such a way that the smallest line was presented first, the next smallest line second, continuing to the largest stimulus, which was presented last. In the large-to-small (LS) condition, these lines were presented in the reverse order. After the participants had estimated these serially ordered lines, they received, without a break or warning, 3 additional lines to estimate. The 3 lines were the smallest (19 mm), largest (134 mm), and average (76.4 mm) of the lines in the set. These were presented in one of four possible orders: small large average, large small average, average small large, and average large small. Procedure. The participants were tested in a large classroom. Their task was to sequentially turn the pages of the packet and reproduce the length of each stimulus line on the blank page following it. The participants were told to look at each stimulus line for a few seconds and then to turn the page and draw a line that was “exactly the same length.” It was explained that they could proceed through the packet at a pace that was comfortable for them but that they could not go back and observe the target stimulus once they had turned the page.
Results Coders blind to the experimental hypothesis measured the length of the response lines on the final three trials. Interrater reliabilities, assessed on 10% of the data, were high, with no two coders differing by more than a half millimeter on any trial and disputes occurring only on 5% of this subset of stimuli. Disputes were resolved by having a third experimenter measure the responses and choosing the answer that agreed with the third coder. We calculated bias for each stimulus as the difference between the participant’s response and the true size of the stimulus. Thus, positive bias indicates that the response line was overestimated, and negative bias indicates that the response line was underestimated. Any trials on which bias was greater than three SDs from the average bias for a stimulus of
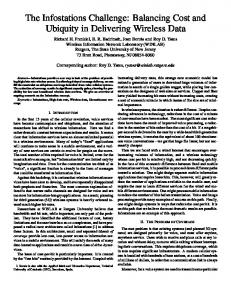
that size were culled. This removed 4 data points from the analysis, which was fewer than 0.2% of the data. We examined whether the sequence in which the participants viewed and estimated the first 10 lines affected how they subsequently reproduced the smallest, largest, and average length lines that were presented on the final three trials. The average estimation biases for these 3 lines are presented in Figure 1. Bias scores were submitted to a mixed model ANOVA with stimulus size (smallest, average, or largest) as the within-participants factor and condition (LS or SL) as the between-participants factor. This analysis yielded a significant main effect of condition [F(1,149) 5 6.16, p , .001, η2p 5 .11], since the participants in the LS condition produced larger bias on the three test trials than did the participants in the SL condition [LS bias, M 5 2.03 mm (SE 5 0.82); SL bias, M 5 20.64 (0.70)].2 In addition, there was a significant main effect of stimulus size [F(1,149)3 5 22.61, p , .001, η2p 5 .09], since the participants overestimated short lines and underestimated long lines, consistent with earlier work on the central tendency bias [mean bias: smallest, M 5 4.44 (0.42); average, M 5 0.48 (0.72); longest, M 5 22.82 (1.16)]. There was not a significant interaction between condition and stimulus size (F , 1). Discussion In Experiment 1, we explored whether the order of 10 stimulus lines would influence subsequent estimates of 3 lines equal to the average, smallest, and largest of the set. Overall, the participants underestimated the length of a line equal to the longest of the set and overestimated the length of a line equal to the shortest of the set, which the category adjustment model predicts will occur because people combine their inexact memories for these particular stimuli with category-level information about the set as a whole. However, the effect of the order of the initial 10 lines was strongest on the estimate of the line equal to the average length of the set. In the SL condition, the length of the average line in the set was underestimated, whereas in the LS condition, the length of the average was overestimated. From the perspective of the category adjustment model, the participants combined their inexact memories of the average line length with category-level informa15 10
Bias (millimeters)
three subsequent test stimuli that were equal to the average, smallest, and largest lines in the set. This work was motivated by an influential model of category effects on stimulus estimation (Huttenlocher et al., 2000) that posits that people combine category level and fine-grained information about a stimulus when estimating its value along a dimension. This combination of information from both levels results in the stimulus’s being adjusted toward the category prototype. If early or later stimuli are allocated greater weight in the category representations, estimates of the average line should be biased toward those stimulus values.
5 0 –5 –10
Smallest
Average
Largest
–15 Small–Large
Large–Small
Figure 1. Bias in the postsequence estimation trials for the smallest, average, and largest stimuli in Experiment 1.
Inductive Categories 571 tion about the preceding set of lines. The category-level information appears to have been systematically biased as a function of the order of the initial 10 lines, so that the category prototype appeared to be smaller than the true average value for the participants in the SL condition and larger than the true average value for the participants in the LS condition, suggesting that the order of stimuli affected people’s inductive categories. Specifically, this finding suggests that stimuli encountered early in the process of induction (small stimuli in the SL condition and large stimuli in the LS condition) influenced the category representation to a greater extent than did recently experienced stimuli. In Experiment 1, the participants’ category representations were assessed indirectly by examining how that information influenced an estimation task. A more direct approach would be to present the distribution and then ask the participants to generate (rather than reproduce) the average line length. If such judgments were also biased toward the initially presented stimuli, this would support the explanation of the bias that was found in Experiment 1—namely, that it stems from how people represent the distribution of category instances, rather than from how they estimate individual instances that equal these values from the distribution. Alternatively, it is possible that the estimation paradigm utilized in Experiment 1 tapped into some process other than that used in reconstructing aspects of the distribution itself. Experiment 2 tested this possibility by asking participants to produce, rather than reproduce, the smallest, largest, and average length lines in the series. Experiment 2 Experiment 2 used a paradigm similar to that in Experiment 1; however, the final three estimation trials were replaced with retrospective judgments about the distribution of the stimuli. The participants were simply asked to draw a line equal to the average, smallest, and largest line lengths of the initial 10 line stimuli. Method
Participants. One hundred twenty college students participated in partial fulfillment of a course requirement. The sample consisted of 52 males and 68 females. Materials and Design. The first 10 trials were the same as those in Experiment 1. The participants were randomly assigned to one of two experimental conditions in which they estimated the 10 initial lines in sequential order from smallest to largest (SL) or largest to smallest (LS). Procedure. The initial instructions on the packet informed the participants that they should continue with the line estimation task until they encountered the second part of the packet, which would contain a new set of instructions. After reproducing the 10 sequentially ordered stimulus lines, the participants encountered a page indicating that they had moved to Part 2 of the experiment. On the following page, the participants received instructions asking them to turn the page and draw a line on the following page that was equal to the smallest (or largest, or average length) line that they remembered viewing in the initial part of the experiment. Each participant completed each of these three estimates on sequential pages, the possible orders of which were identical to those in Experiment 1. The participants were randomly assigned to the experimental conditions.
Results The data were measured, coded, and culled using the same procedure as that in Experiment 1. For the retrospective judgments in which the participants estimated the smallest, largest, and average-sized stimuli, bias was calculated by subtracting the true values for these stimuli from each estimate. Culling removed three of the trials, which was fewer than 0.02% of the data. We examined the retrospective judgments to determine whether the initial stimulus order influenced the participants’ representation of the set. We submitted these data to a 2 (condition) 3 3 (stimulus size: smallest, largest, or average) mixed model ANOVA. The analysis yielded a significant main effect for condition [F(1,113) 5 11.28, p , .001, ηp2 5 .09], indicating that retrospective judgments were smaller when the stimuli had been ordered from SL than when they had been ordered from large to small [mean bias: LS, M 5 6.45 (1.14); SL, M 5 21.56 (1.45)]. There was also a significant main effect for stimulus size [F(1,113) 5 15.19, p , .001, η2p 5 .12], revealing that the smallest lines were overestimated and the largest stimuli were underestimated [mean bias: smallest, M 5 9.5 (0.67); average, M 5 3.83 (1.82); largest, M 5 23.02 (1.93)]. Note that in the LS condition, estimates of the largest stimulus were not negative but were close to zero. This finding may be due to the fact that the largest stimulus was observed first in the series and that fine-grained memory for the first instance of the series degraded over time, combined with the fact that stimuli with greater magnitude are encoded less precisely than stimuli with smaller magnitudes, due to Weber’s law. In addition, the positive bias for the average line length in the LS condition was greater than the negative bias for the average line length in the SL condition. This may have been due to the method of producing, rather than reproducing, the stimuli used in this experiment and in Experiments 3 and 4, because drawing a line always means increasing the length of a response line. To anticipate, in Experiment 5, computers were used that allowed the participants to adjust animated lines from a long or short starting length, and this positive bias disappeared. Because this finding is probably an artifact of the drawing method we used in Experiments 2–4, we will not interpret it further. The critical effect is not the relative size of the effect between the LS and SL conditions but, rather, the direction of the bias as positive or negative. In addition, there was a significant interaction between condition and stimulus size [F(1,113) 5 4.08, p , .05, η2p 5 .04]. The means are presented in Figure 2. Contrasts on the stimulus size by condition were performed with independent sample t tests, using Fisher’s LSD procedure. This analysis showed that in the SL condition, as compared with the LS condition, the participants produced significantly smaller estimates of the average [t(118) 5 4.01, p , .001, d 5 0.73] and the smallest [t(116) 5 2.27, p , .05, d 5 0.43] stimuli. The effect for the large stimulus was in the same direction but was only marginally significant [t(115) 5 1.76, p , .09, d 5 0.32]. Overall, the participants who viewed stimuli in the SL order produced an estimate of the average that was smaller than the actual
572 Duffy and Crawford
Bias (millimeters)
15 10 5 0 –5 –10 Smallest
Average
Largest
–15 Small–Large
Large–Small
are ordered from small to large should also occur when stimuli are ordered from small to large and then back to small. Similarly, the effect of overestimating when stimuli are ordered from large to small should replicate when stimuli are ordered from large to small and then to large. However, if the opposite is true, and people adjust their estimates of the average away from the most recent members, we should observe the opposite effect: overestimating in the SLS condition and underestimating in the LSL condition. Thus, the direction of the effect for the average stimulus would be the opposite of those observed in Experiments 1 and 2.
Figure 2. Bias in the retrospective judgments for the smallest, average, and largest stimuli in Experiment 2.
average of the distribution, and vice versa for those who viewed stimuli in the LS order. These findings suggest that the representation of the prior distribution itself was influenced by the sequential order of the stimuli presented in the initial phase of the experiment. Discussion Experiment 2 extended the findings of Experiment 1 by showing that the sequence of stimuli influenced reproductions of the average stimulus from the distribution. These retrospective judgments provide a direct measure of how people represent the distribution of category instances. The finding that responses on this measure were biased in the same way as the estimates were in Experiment 1 lends support to the argument that the bias toward initially experienced values is due to how people represent the category, rather than being an artifact of a particular methodology. If one assumes that people assimilate estimates toward some representation of prior information about a set of stimuli, the results of Experiments 1 and 2 provide evidence that initially presented stimuli carry greater weight in this representation. However, there is an alternative explanation that these experiments have not addressed. It is possible that the adjustment process that gives rise to these patterns of findings is one of contrast, rather than assimilation, and that, in fact, it is recent stimuli that carry more weight in representation. In other words, estimates of the average of the distribution may be biased away from recent stimuli, rather than biased toward initial stimuli. Although this seems unlikely in light of the literature on assimilation effects in categorization, some studies have shown contrast effects (e.g., Wedell, 1995), and thus, it is important to consider this possibility. One way to determine whether contrast explains the observed effect is to test participants with a series of stimuli that have comparable magnitudes at the beginning and end of the sequence. In Experiment 3, series of stimuli were used that increased and then decreased in magnitude (small to large to small, or SLS) or decreased and then increased in magnitude (large to small to large, or LSL), and we examined how these orders would affect stimulus estimates and judgments about the distribution. If it is the case that people bias toward initially experienced stimuli, the previous effect of underestimating the average when stimuli
Experiment 3 The purpose of Experiment 3 was to examine the possibility that people adjust their estimates away from the most recent stimuli. In Experiment 3, we addressed this possibility by using a series of stimuli that were sequentially ordered yet had the same initial and recent information. This was accomplished by presenting stimuli that sequentially increased then decreased in magnitude or vice versa. Method
Participants. One hundred twenty college students (44 males, 76 females) participated in Experiment 3 in partial fulfillment of a course requirement. Materials and Design. The materials were similar to those used in Experiments 1 and 2. However, the order of the stimuli differed in that the lines either increased and then decreased in size (SLS) or decreased and then increased in size (LSL). In the SLS condition, the order of the stimuli (in millimeters) was 19, 45, 70, 95, 121, 134, 108, 83, 57, 32. In the LSL condition, the order was 134, 108, 83, 57, 32, 19, 45, 70, 95, 121. The participants were randomly assigned to the experimental condition and order. Procedure. As in Experiment 2, following the estimation task, the packet contained instructions asking the participants to draw the average length of the lines that they had previously reproduced, as well as the smallest and largest lines they had reproduced. The order of these three tasks was identical to the order in Experiments 1 and 2.
Results Data were measured and bias calculated as in the previous two experiments. One data point was removed for bias that was greater than three SDs from the average bias for the particular stimulus size by condition. The biases of the three estimates were submitted to a mixed model ANOVA with condition (LSL or SLS) as the between-participants factor and stimulus size (smallest, average, or largest) as the within-participants factor. This yielded a significant main effect for condition [F(1,118) 5 13.18, p , .001, η2p 5 .10], so that estimates were smaller in the SLS condition than in the LSL condition [mean bias: SLS, M 5 0.12 (1.44); LSL, M 5 7.67 (1.49)]. There was also a significant main effect for the within-participants factor of stimulus size [F(1,118) 5 8.45, p , .005, η2p 5 .07], showing a central tendency bias similar to that observed in Experiments 1 and 2 [mean bias: smallest, M 5 8.06 (0.74); average, M 5 4.03 (1.62); largest, M 5 20.42 (2.07)].There was also a significant interaction between
Inductive Categories 573 condition and stimulus size [F(1,118) 5 10.28, p , .005, η2p 5 .08]. These means are presented in Figure 3. We then compared the contrasts of condition on the estimates for the largest, smallest, and average stimuli, using Fisher’s LSD. For both the smallest and the largest stimuli, the difference in mean bias between the two conditions failed to reach significance [for the smallest stimulus, t(118) 5 0.73, p 5 .44; for the largest stimulus, t(118) 5 0.75, p 5 .45]. However, there was a significant contrast for the retrospective estimate for the average length of the lines [t(118) 5 5.57, p , .001, d 5 1.02]. Importantly, the direction of the bias was the same as that found in Experiments 1 and 2, suggesting that the possibility of contrast away from recent instances is not supported by the data.
Bias (millimeters)
Discussion The purpose of Experiment 3 was to determine whether the effects observed in Experiments 1 and 2 were due to bias toward the initial stimuli or away from the most recent stimuli. This distinction is important because, if people bias away from recent stimuli, this would lead to different conclusions about whether initial or recent stimuli carry more weight in the representation of the distribution. We explored this by using a set of stimuli in which the initial and the most recent stimuli were similar in magnitude. If people adjusted responses away from recent stimuli, then, in contrast to the results in Experiments 1 and 2, bias should be more positive in the SLS condition than in the LSL condition, and vice versa. However, we found that bias for the retrospective judgments was in the same direction as in Experiments 1 and 2: Estimates of comparable lines were overestimates in the LSL condition, relative to the SLS condition. The effect was most pronounced for the judgment of the average of the set, which was also found in Experiments 1 and 2. These results suggest that people do adjust estimates toward a set of prior instances for which initial stimuli are weighted more heavily than more recent information. Although the results of Experiments 1–3 suggest that people’s inductive categories weight early instances to a greater extent than more recent instances, one of the limitations of the design utilized thus far is that the number of lines used to establish the category has remained constant at 10 instances. An additional limitation is that the average line length has not appeared as a member of the ini20 15 10 5 0 –5 –10 –15 –20
Smallest
Small–Large–Small
Average
Largest
Large–Small–Large
Figure 3. Bias in the retrospective judgments for the smallest, average, and largest stimuli in Experiment 3.
tial set of lines. To determine whether the primacy effect observed in the first three experiments would generalize to shorter or longer series of stimuli and whether the absence of the average line length in the initial series has an effect upon the results, Experiment 4 tested whether the primacy effect would persist when the inductive category was established with only five lines with the average line length included. Experiment 4 The purpose of Experiment 4 was to determine whether the effects observed in Experiments 1–3 would persist when the number of stimuli in the induction task was reduced. One possible explanation for why people rely more on initial instances is that having more than approximately seven stimuli overloads working memory. With fewer instances, it is possible that people may weigh all the stimuli equally and, thus, the primacy effect observed in the first three experiments will disappear. Method
Participants. Eighty-six college students participated in the study in partial fulfillment of a course requirement. Materials and Design. The materials were similar to the line packets used in Experiments 1–3. However, rather than 10 lines varying in length, there were only 5 lines. The lines used were 19, 45, 70, 95, 121 mm in length. Note that 70 mm was the average of the set and was included as one of the initially viewed lines. Procedure. The procedure was identical to that in Experiments 2 and 3, except that only five target lines were shown before the test trials.
Results The stimuli were measured and entered as in the previous experiments. We calculated bias for each of the three retrospective judgment tasks (smallest, largest, and average line) for each participant. These data were submitted to a mixed model ANOVA with condition (LS or SL) as the between-participants factor and stimulus size (smallest, average, or largest) as the within-participants factor. This analysis yielded a significant main effect of condition [F(1,78) 5 6.125, p , .05, η2p 5 .073], a significant interaction between order of the three test trials and condition [F(3,78) 5 4.08, p , .05, η2p 5 .13], and a significant interaction between the within-participants factors of size and condition [F(1,78) 5 17.03, p , .001, ηp2 5 .18]. The interaction between test order and condition may have arisen due to the small number of preliminary trials in the category induction task, or it may have been an artifact due to the smaller number of participants in this experiment. Because it appeared in no other experiment and is not the focus of the article, we will not interpret this interaction further. We compared the contrasts for condition for each of the three tasks. Although there were no significant differences between conditions for the smallest and largest stimuli, there was a significant contrast for the estimate of the average of the set [t(84) 5 5.9, p , .001]. As in the previous experiments, estimates of the average were smaller in the SL condition [mean bias 5 24.07 (2.11)] than in the LS
574 Duffy and Crawford condition [mean bias 5 14.61 (2.33)]. These data are presented in Figure 4. Discussion In Experiment 4, we addressed two questions: first, whether the effects observed in Experiments 1–3 would persist when the number of preliminary trials was less than 10; second, whether the effects observed in Experiments 1–3 would replicate when the average of the distribution was actually one of the stimuli presented in the initial set of lines that formed the basis for the inductive category. The results of Experiment 4 indicate that even when there were only five trials and the average stimulus value (70 mm) was included in the initial set, people still biased estimates of the average toward initially presented stimuli. Experiments 1–4 were modeled on previous studies in which stimulus reproduction tasks were used to establish inductive categories (Crawford, Huttenlocher, & Engebretson, 2000; Huttenlocher et al., 2000; Sailor & Antoine, 2005). However, it was not clear whether the primacy effect is a general phenomenon that would also apply to those studies, for several reasons. One concern was that the participants may have relied on a unique processing strategy for the serially ordered stimuli used in Experiments 1–4, one that they would not use for the random orders presented in previous work. Thus, it was useful to test participants with an order of stimuli that was not serial but pseudorandomized in such a way that the limitation that initial and recent stimuli be sampled from opposite ends of the stimulus continuum would be maintained. Another concern was that, in contrast to previous studies, Experiments 1–4 used a relatively small number of initial stimuli to establish a category, in contrast with prior studies that have used several hundred. It was possible that reliance on stimuli encountered early in the process of induction would disappear when the number of experienced instances was large. Finally, most prior research with this method of category induction has used computerized stimulus presentations. The paper-and-pencil methodology used in our first four experiments may have led to uncontrolled timing across induction trials. Hence, in Experiment 5, we addressed these three issues by using a computerized version of the task with a randomized sequence of 190 trials. The experiment was divided in half 20
Bias (millimeters)
15 10 5 0 –5 –10 –15
Smallest
Average
Largest
–20 Small–Large
Large–Small
Figure 4. Bias in the retrospective judgments for the smallest, average, and largest stimuli in Experiment 4.
so that the distribution of lines observed at the beginning of the induction phase differed from the distribution at the end of the induction phase. Experiment 5 In Experiment 5, the participants viewed a target line on a computer screen and, after a delay, reproduced its length by adjusting a second line to be equal in length to the target. There were a total of 190 lines that varied in length from 80 to 368 pixels, with the midpoint at 224 pixels (30 pixels 5 1 cm). The induction task was divided into two halves, although the participants were not told of the divide, and there was no break in the experimental routine. In the first half, the participants in the SL condition estimated lines randomly chosen from the smaller half of the distribution and, at Trial 96, began estimating lines randomly chosen from the larger half of the distribution, and vice versa for the participants in the LS condition. After estimating all 190 lines, the participants were asked to adjust a reproduction line to equal the average of the set, as well as the smallest and largest lines that they recalled having estimated. Method
Participants. Forty-nine college students participated in the experiment in partial fulfillment of a course requirement. Materials and Design. The experiment was conducted on a desktop computer with a 17‑in. (diagonal) monitor. A total of 190 lines were presented, varying in 16-pixel increments from 80 to 360 pixels, resulting in 10 stimuli from each of the 19 stimulus values. All the lines were 5 pixels thick. The participants were randomly assigned to one of two conditions. In the SL condition, Trials 1–95 were randomly selected from the small end of the distribution (80‑ to 224‑mm lines), and Trials 96–190 were randomly selected from the large end of the distribution (224‑ to 368‑mm lines). In the LS condition, Trials 1–95 were randomly selected from the large end of the distribution, and Trials 96–190 were randomly selected from the small end of the distribution. For both conditions, Stimulus 224 (the average of the distribution) was divided so that five trials of this stimulus value were presented in the first half and five trials were presented in the second half of the induction task. This made certain that instances of the average line length were viewed throughout the experiment. Procedure. The participants were tested individually in a quiet room. The participants first estimated the 190 initial lines. On each trial, a target line was presented horizontally for 1 sec in the top half of the computer monitor. Its location along the x-axis of the screen was randomly chosen, with the constraint that no line could be presented closer than 2 cm to the edge of the screen. After a 1-sec delay, an adjustable reproduction line appeared in the bottom half of the screen. Its initial starting length was randomly chosen from the distribution, with the constraint that the starting length of the reproduction line could not be the length of the target line. The location of the target line along the x-axis of the screen was randomly chosen, with the same constraints as those for the target line. The participants adjusted the length of this target line by pressing the mouse keys. Pressing the left mouse key made the line increase in length symmetrically, and pressing the right mouse key made it decrease. When a button was pressed, the rate of change was about 1 cm/sec. After a participant had completed the category induction task, a screen appeared asking him or her to press return to move to the second part of the experiment. In the second half, a screen appeared with the instructions, “Think back upon all the lines that you estimated. Once you press return, you will see a reproduction line. Please adjust the line to equal the average of all the lines you remem-
Inductive Categories 575 ber having estimated.” Once the participant had completed this task, a second and third retrospective judgment task was given requesting that the participant “adjust the line to equal the smallest line you remember estimating” or “adjust the line to equal the largest line you remember estimating.” Unlike in Experiments 1–4, we did not vary the order of the tasks.
Results For each of the three retrospective judgment tasks, bias was computed as the difference between the true value for the average, smallest, and largest stimuli and the participant’s response. We submitted these values for bias to a 2 3 3 mixed model ANOVA with condition as the between-participants variable and bias for the average, smallest, and largest stimuli as the within-participants variable. This analysis yielded a significant main effect for condition [F(1,47) 5 4.98, p , .05, ηp2 5 .09], with no other effects or interactions. As in the previous experiments, those who saw shorter lines followed by longer lines produced shorter estimates [mean bias 5 213.08 (8.56)] than did those saw who longer lines followed by shorter ones [mean bias 5 16.08 (10.21)]. Average bias for each retrospective judgment by condition is presented in Figure 5. Because it appears from the figure that the effect was driven mainly by the average condition, we compared the contrasts of condition on the estimates for the largest, smallest, and average stimuli, using Fisher’s LSD. As was expected, only the bias for the average line length showed a significant effect [t(47) 5 2.17, p , .05], whereas estimates for the smallest and longest lines did not differ significantly [ts(47) 5 0.57 and 0.66, respectively; n.s.]. Discussion The results of Experiment 5 are consistent with the results of Experiments 1–4. Estimates of the average of the distribution were biased toward stimuli encountered in the initial phase of the experiment even when the number of trials was much larger than 10, when the stimuli appeared in a nonserial order, when the task was conducted with more experimental control on a computer, rather than with paper and pencil, and when the line with average length was part of the series of lines that were used in the induction phase of the experiment. This suggests that the pri35
Bias (millimeters)
25 15 5 –5 –15 –25 –35
Smallest
Small–Large
Average
Largest
Large–Small
Figure 5. Bias in the retrospective judgments for the smallest, average, and largest stimuli in Experiment 5.
macy effects observed in the first four experiments were not merely artifacts of the testing conditions or due to the small number of induction trials, nor did they arise from the serial order of the initial 10 stimulus lines. General Discussion In five experiments, we examined the influence of initially observed or recently observed stimuli on retrospective estimates of the average of a distribution of stimuli to determine whether inductive categories exhibit primacy or recency effects. Across all five experiments, estimates of the average of the distribution revealed a primacy effect, in that estimates of the distribution’s average were biased toward category values experienced earlier in the process of category induction. This was the case when people were asked to reproduce the average line length of the set (Experiment 1), as well as when people were asked to produce the average length on the basis of their memory of the stimulus set (Experiments 2–5). The results of Experiment 3 suggest that the primacy effect cannot be explained by an alternative process in which people adjust responses away from the most recently encountered category instances. Experiments 4 and 5 demonstrated that the primacy effect emerged even when the number of induction trials was small (5 in Experiment 4) and large (190 in Experiment 5), when the average line length was actually a member of the distribution, when the study was conducted on a computer, rather than with paper and pencil, and when the stimuli were not serially ordered. These experiments were motivated by the possibility that inductive categories do not contain complete and exhaustive information about the entire distribution of experienced category instances but, rather, allocate greater weight to a subset of stimuli experienced at the time that the category was initially established or those experienced most recently. Many prior studies on inductive category formation have presumed that all experienced instances are allocated equal weight in the representation that is formed from experiencing the distribution; however, the computational demands of such processing might outweigh the increased accuracy achieved by processing or storing information about new exemplars in memory or, alternatively, updating one’s abstract representation of the category’s prototype. This finding is consistent with the extensive literature on expectation biases in cognitive processing. Prior expectations bias people to detect correlations and learn categories that are consistent with those expectations (e.g., Crawford, Huttenlocher, & Hedges, 2006; Flannagan et al., 1986; Trolier & Hamilton, 1986). For instance, such a primacy effect may facilitate the maintenance of stereotypes even in the face of disconfirming evidence (Johnston, 1996). In the present study, expectations may have been formed from initial stimuli within the stimulus set and may, in turn, have biased retrieval of information about the category as a whole. Although other mechanisms and institutions are involved with social categories, it is possible that underlying both perceptual and social categorization is a common process that emphasizes attending to stimuli experienced when
576 Duffy and Crawford initially forming the category and allocating attention to other tasks once enough instances are processed to form a “good enough” approximation of the actual distribution of stimuli in the world. Note that in the present study, the effects of initial stimuli were relatively small, relative to recent stimuli. Overall, people were quite accurate at being able to compute and report the average of the distribution they had seen, regardless of the order of the stimuli. However, recall that people completed the retrospective task immediately following category induction. It is possible that longer delays between initial learning and retrospectively estimating the average of the distribution might either strengthen or attenuate the effect that we observed. A direction for future research may be to vary the delay in order to determine how this manipulation might influence the relative weighting of initial versus recent information. The results may seem surprising given that, at least when a distribution of instances changes over time, allocating greater weight to initial stimuli represents a seemingly suboptimal strategy. Rather than being purely random, experience with category exemplars may be governed by natural processes and human activities that result in a nonrandom sequence of stimuli. For example, more diligent students may come to visit a professor’s office hours early in the semester, whereas less diligent ones may come in toward the end. Leaves shift in color from green to brown over the course of autumn. Lawns become larger as one drives from a city to its suburbs. To the extent that distributions change over time, representations that emphasize recent, up-todate information would seem to better capture present reality than do those that emphasize information learned earlier, perhaps even many years before. Alternatively, it may be more adaptive to be conservative in forming a category representation and to rely more heavily on initial experience of a distribution of stimuli. One possible explanation is that in any random order of stimuli, there are likely to be occasional sequences in which a distribution may subjectively appear to change but this shift may merely represent a temporary statistical perturbation in the selection of stimuli. Given that people are poor in their understanding of sampling or statistical inference (Fiedler, 2000; Sedlmeier & Gigerenzer, 1997), which can sometimes lead to fatal consequences for judgments (Gigerenzer, 2004; Gigerenzer, Hoffrage, & Ebert, 1998), relying on initial stimuli to establish a representation may, in some cases, improve the accuracy of a category judgment by preventing the adjustment of a representation due to a natural perturbation in the random order of stimuli. More important, the costs of disregarding initial information or allocating attention to recently experienced instances may be high, relative to the advantage provided by continually updating category representations. The relative costs and benefits of shifting a category representation to reflect new stimuli necessarily depend on several factors, including the cognitive demands of processing and the stability of the environment. In stable environments in which the order in which one experiences instances of a class is nearly random, and when the category has a rela-
tively low dispersion of instances, the costs of attending to new information may be high, relative to the increase in accuracy achieved by updating the representation. For instance, in walking through a forest, it may be more adaptive to allocate attention to the hiding locations of possible predators, rather than updating one’s category representation of the heights of trees. The first few instances provide a good enough approximation for everyone, short of the most devoted horticulturist. There are several directions for future research. One direction, mentioned above, may be to explore whether the observed effect varies as a function of the delay between category induction and reconstructive judgment. A second direction would be to determine whether the primacy effect observed with line stimuli will generalize to other stimulus conditions and categories, such as spatial or social categories. The present study relied on simple perceptual stimuli that are easily reproducible; however, the primacy effect might vary if the category dimension were not continuous but, rather, discrete (e.g., the proportion of males vs. females encountered during a trip) or an abstract trait (e.g., personality characteristics of individuals). Studies in these directions may shed light on how the mind uses processes that reduce the cognitive complexity of forming categories without decreasing the accuracy of the underlying representation. Author Note We thank Samantha Bellitz, Amanda Furman, Jennifer Habina, George Hall, Joshua Lewandowski, Roseann Mancini, Danielle Renzulli, Miriam Rodas, and Michelle Perrone for assistance with data collection and Erin Jones for reading an earlier version of the manuscript. Please address correspondence to S. Duffy, Department of Psychology, Rutgers University, Camden Campus, Armitage Hall, Room 343, 311 North Fifth Street, Camden, NJ 08102 (e‑mail:
[email protected]). References Anderson, N. H., & Jacobson, A. (1965). Effect of stimulus inconsistency and discounting instructions in personality impression formation. Journal of Personality & Social Psychology, 2, 531-539. Asch, S. (1946). Forming impressions of personality. Journal of Abnormal & Social Psychology, 41, 258-290. Crawford, L. E., Huttenlocher, J., & Engebretson, P. H. (2000). Category effects on estimates of stimuli: Perception or reconstruction? Psychological Science, 11, 280-284. Crawford, L. E., Huttenlocher, J., & Hedges, L. V. (2006). Withincategory feature correlations and Bayesian adjustment strategies. Psychonomic Bulletin & Review, 13, 245-250. DeCarlo, L. T., & Cross, D. V. (1990). Sequential effects in magnitude scaling: Models and theory. Journal of Experimental Psychology: General, 119, 375-396. Dennis, M. J., & Ahn, W.-K. (2001). Primacy in causal strength judgments: The effect of initial evidence for generative versus inhibitory relationships. Memory & Cognition, 29, 152-164. Duffy, S., Huttenlocher, J., & Crawford, L. E. (2006). Children use categories to maximize accuracy in estimation. Developmental Science, 9, 598-604. Duffy, S., Huttenlocher, J., Hedges, L., & Crawford, L. E. (2007). Category effects on stimulus estimation for skewed and shifting frequency distributions. Unpublished manuscript, Rutgers University. Duffy, S., & Kitayama, S. (2007). Mnemonic context effect in two cultures: Attention to memory representations? Cognitive Science, 31, 1-12. Ebbinghaus, H. (1913). Memory: A contribution to experimental psychology. New York: Columbia University Press. (Original work published 1885)
Inductive Categories 577 Fiedler, K. (2000). Beware of samples! A cognitive–ecological sampling approach to judgment biases. Psychological Review, 107, 659-676. Fiedler, K., & Juslin, P. (Eds.) (2006). Information sampling and adaptive cognition. New York: Cambridge University Press. Flannagan, M. J., Fried, L. S., & Holyoak, K. J. (1986). Distributional expectations and the induction of category structure. Journal of Experimental Psychology: Learning, Memory, & Cognition, 12, 241-256. Fried, L. S., & Holyoak, K. J. (1984). Induction of category distributions: A framework for classification learning. Journal of Experimental Psychology: Learning, Memory, & Cognition, 10, 234-257. Gershberg, F. B., & Shimamura, A. P. (1994). Serial position effects in implicit and explicit tests of memory. Journal of Experimental Psychology: Learning, Memory, & Cognition, 20, 1370-1378. Gigerenzer, G. (2000). Adaptive thinking: Rationality in the real world. New York: Oxford University Press. Gigerenzer, G. (2004). Dread risk, September 11, and fatal traffic accidents. Psychological Science, 15, 286-287. Gigerenzer, G., Hoffrage, U., & Ebert, A. (1998). AIDS counselling for low-risk clients. AIDS Care, 10, 197-211. Holland, H. K., & Lockhead, G. R. (1968). Sequential effects in absolute judgments of loudness. Perception & Psychophysics, 3, 409-414. Howard, M. W., & Kahana, M. J. (1999). Contextual variability and serial position effects in free recall. Journal of Experimental Psychology: Learning, Memory, & Cognition, 25, 923-941. Huttenlocher, J., Hedges, L. V., & Vevea, J. L. (2000). Why do categories affect stimulus judgment? Journal of Experimental Psychology: General, 129, 220-241. Johnston, L. (1996). Resisting change: Information seeking and stereotype change. European Journal of Social Psychology, 26, 799-825. Juslin, P., Fiedler, K., & Chater, N. (2006). Less is more in covariation detection: Or is it? In K. Fiedler & P. Juslin (Eds.), Information sampling and adaptive cognition (pp. 92-126). Cambridge: Cambridge University Press. Kareev, Y. (2000). Seven (indeed, plus or minus two) and the detection of correlations. Psychological Review, 107, 397-403. Kareev, Y., Lieberman, I., & Lev, M. (1997). Through a narrow window: Sample size and the perception of correlation. Journal of Experimental Psychology: General, 126, 278-287. Parducci, A. (1964). Sequential effects in judgment. Psychological Bulletin, 61, 163-167. Petzold, P., & Haubensak, G. (2001). Higher order sequential effects in psychophysical judgments. Perception & Psychophysics, 63, 969-978. Petzold, P., & Haubensak, G. (2004). The influence of category membership of stimuli on sequential effects in magnitude judgment. Perception & Psychophysics, 66, 655-678.
Posner, M. I., & Keele, S. W. (1968). On the genesis of abstract ideas. Journal of Experimental Psychology, 77, 353-363. Sailor, K. M., & Antoine, M. (2005). Is memory for stimulus magnitude Bayesian? Memory & Cognition, 33, 840-851. Schifferstein, H. N. J., & Kuiper, W. E. (1997). Sequence effects in hedonic judgments of taste stimuli. Perception & Psychophysics, 59, 900-912. Sedlmeier, P., & Gigerenzer, G. (1997). Intuitions about sample size: The empirical law of large numbers. Journal of Behavioral Decision Making, 10, 33-51. Stewart, N., Chater, N., & Brown, G. D. A. (2006). Decision by sampling. Cognitive Psychology, 53, 1-26. Todd, P. M., & Gigerenzer, G. (2000). Précis of Simple heuristics that make us smart. Behavioral & Brain Sciences, 23, 727-741. Todd, P. M., & Gigerenzer, G. (2007). Environments that make us smart: Ecological rationality. Current Directions in Psychological Science, 16, 167-171. Trolier, T. K., & Hamilton, D. L. (1986). Variables influencing judgments of correlational relations. Journal of Personality & Social Psychology, 50, 879-888. Tversky, A., & Kahneman, D. (1974). Judgment under uncertainty: Heuristics and biases. Science, 185, 1124-1130. Wedell, D. H. (1995). Contrast effects in paired comparisons: Evidence for both stimulus-based and response-based processes. Journal of Experimental Psychology: Human Perception & Performance, 21, 1158-1173. Yates, J. F., & Curley, S. P. (1986). Contingency judgment: Primacy effects and attention decrement. Acta Psychologica, 62, 293-302. notes 1. There are alternative statistical measures of the central value of a distribution of stimuli, such as the median or mode. However, for symmetrical distributions, the various measures of centrality fall at the same location along the dimension. 2. For this and the additional experiments reported here, we conducted preliminary analyses on the data, including gender and order of the three final test trials. These factors failed to yield significant effects or interactions for any of the experiments, so we dropped them from the final analysis and will report results on condition only. 3. In this and the experiments that follow, the degrees of freedom for the repeated measures factor with three levels are corrected for sphericity, using the lower bound method. (Manuscript received January 14, 2007; revision accepted for publication October 25, 2007.)