Korean Journal of Remote Sensing, Vol.28, No.3, 2012, pp.267~276
Seasonal and Inter-annual Variations of Lake Surface Area of Orog Lake in Gobi, Mongolia During 2000-2010 Heejae Yang, Eunhye Lee, Nayoung Do, Dongwook Ko and Sinkyu Kang† Department of Environmental Science, Kangwon National University
Abstract : Terminal lakes are widely distributed in the arid and semi-arid Gobi of Mongolia, and serves as important water resource for local people and livestock. However, such lakes are subject to great fluctuations in its size depending on climatic conditions and human water utilization. The Orog Lake is one such example that has shown remarkable fluctuation in recent years. In this study, we investigated the temporal changes of Orog Lake surface area by using 16-day MODIS 250 m NDVI products from 2000 to 2010. The results were compared with climate variability represented by monthly precipitation and temperature. Our results show that the Orog Lake gradually shrank for the period from 2000 to 2010, but with a significant range of seasonal and inter-annual variability. The lake area showed considerable seasonal variations, as it expanded in spring and fall, primarily due to snow melt and summer precipitation, respectively. Extreme drought period from 2000 to 2002 triggered the substantial reduction in lake area, leading to dry-up in year 2005, 2006, 2007, and 2009. After dry-up once occurred in 2005, the lake repeated reappearance and disappearance depending on seasonal and annual precipitation. Our findings implicate that the ground water fluctuated around the lake bottom level since 2005. This suggests the highly vulnerable nature of Orog lake, which greatly depends on future precipitation change. Key Words : lake area change, MODIS NDVI, precipitation
suggest that it might be related to changes in regional
1. Introduction
climate (Natsagdorj et al., 2003; Kim, 2008; Lee and Mongolia is a land-locked country, mainly
Sohn, 2011) and socio-economic situation (Dietz et
comprised of arid and semi-arid environment with
al., 2005; Johnson et al., 2006). Batima et al. (2005)
limited water resource. Arid and semi-arid regions of
reported Mongolia experienced an increase in annual
Mongolia are experiencing land degradation
mean temperature by 1.6 ˚C and a decrease in winter
according to UNCCD guideline for desertification
and spring precipitation since the 1960s. Such
(UNEP RRC.AP, 2002). In particular, Mongolia’s
changes can exert regional water balance of grassland
grasslands showed various symptoms of land
ecosystems leading to reduced water resource in
degradation in the last 60 years, and various studies
Mongolia.
Received December 22, 2011; Revised March 5, 2012, Revised April 14, 2012; Accepted April 15, 2012. Corresponding Author: Sinkyu Kang (
[email protected])
†
– 267–
Korean Journal of Remote Sensing, Vol.28, No.3, 2012
In 2004, Mongolian government published a
increased human demography in this area. Chuluun et
comprehensive report revealing that 683 streams and
al. (2010) reported that the surface area of Orog lake
rivers, 1484 wells and springs, and 760 lakes have
has been widely fluctuating since the early 2000s,
disappeared between late 1990s and early 2000s
including a complete dry-up, albeit temporary, in
(Davaa, 2007). This is an alarming phenomenon
2009, which brought strong negative effects on local
considering the limited water resource of Mongolia,
economy in the lower basin area.
which is extremely important to preserve the
Since late 1990s, two major zud events (i.e.
sustainability of ecosystem functions and livelihood
massive kills of livestock due to harsh winter
of local inhabitants. It is hence imperative to monitor
condition) occurred in the dry regions in Mongolia. In
the dynamics of water resources and to understand
particular, the 3-year zud event from late 1999 to
the primary driving forces on the water resource
early 2002 was recorded as one of most severe zud
variability, which can provide scientific grounds on
disasters in the last several decades: this event alone
developing effective strategies for water resources
resulted in 30% reduction in livestock population in
management in the Mongolian dryland ecosystem. In
Mongolia (Saizen et al., 2010). Zud events are
particular, lake are of great interest as it is undoubtly
directly associated with harsh winter condition, such
the largest water resource (500 km3 yr-1) in Mongolia,
as severely cold weather, heavy snow, or formation
3
-1
3
-1
followed by 34.6 km yr by rivers, 62.9 km yr by 3
-1
of surface ice cover preventing livestock from
glaciers, and 12 km yr by groundwater (Davaa,
grazing. However, zud conditions can be exacerbated
2007).
by severe drought condition in the previous growing
Remote sensing is an effective approach for
season, as it will reduce grass biomass available for
monitoring changes in land surface water resources
livestock grazing resulting in weakened livestock
over large areas such as Mongolia. Several studies
vitality, and reduced winter forage (Robinson and
have been conducted to investigate a variety of
Milner-Gulland, 2003; Saizen et al., 2010). In
aspects of changes in lake properties in the dryland
addition, such drought condition can also shrink lake
regions of Asia. Nakayama et al. (2007) utilized
surface area by drawing down ground water level,
multiple satellite data including Landsat, ASTER,
which resulted in dry-up of wells that primarily
MODIS, NOAA AVHRR, and JERS-1, to evaluate
provided drinking water for livestock in dry and
long-term change of lake area in the Central Asia.
semi-dry regions in Mongolia. Increase in dry wells
They reported rapid shrinkage of closed lakes in
often result in localized over-grazing activities around
Dzungar Basin of the Central Asia in the past 50
remaining wells, leading to increased risk of
years, which again rapidly expanded since 2002.
grassland ecosystem degradation (Chuluun et al.,
They interpreted that the changes were more closely
2010).
associated with human activity such as irrigated
Hence, detection of lake area decrease can provide
agriculture rather than natural fluctuation based on
important information on seasonal or inter-annual
the climate change. Komatsu et al. (2001) conducted
imbalance of water budget resulting in reduced
research on Orog Lake located in southern Mongolia
productivity and degradation of grassland, and the
using RADARSAT SAR imageries. They reported
potential hazard from zud event in the following
that Orog Lake has greatly expanded during the
winter season. For this purpose, the satellite data
periods of Pleistocene and Holocene, resulting in
utilized for the lake surface detection should have the
–268–
Seasonal and Inter-annual Variations of Lake Surface Area of Orog Lake in Gobi, Mongolia During 2000-2010
capability to capture seasonal dynamics of even small-sized lakes that are widely distributed in dry regions. On the ground, MODIS (Moderate Resolution Image Spectroradiometer) 250 m NDVI (Normalized Differenced Vegetation Index) product is one of the preferred dataset because it has 16-day temporal period to assure detection of seasonal variation of lake size with relatively high spatial resolution, compared to NOAA AVHRR and MODIS 1 km products. In previous studies, the MODIS 250 m NDVI product was successfully applied to detect flood (Brakenridge and Anderson, 2005) and to estimate lake area (Peng et al., 2005). Therefore, this dataset may have the potential for rapid detection of lake area change for the purpose of early warning on potential hazards, such as zud event and desertification, which needs to be evaluated. In this study, we applied the MODIS 250 m NDVI
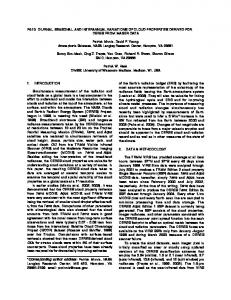
Fig. 1. Locations of Orog Lake basin and weather stations (dots). The base map is June-September NDVI accumulation averaged from 2000 to 2010.
product to examine seasonal and inter-annual variation of the Orog lake in Mongolian Gobi region.
located within the Bogd sum of Arhanggai aimag
Using the results, we interpreted the lake area
with an elevation of 1,210-1,220 m (Komatsu et al.,
dynamics in relation with seasonal and inter-annual
2001; Krylov et al., 2011). Tuin river is the primary
variations of temperature and precipitation in the
water source to the lake. It was reported that the river
basin scale. Finally, we discussed limitations of this
discharge has decreased with considerable
study and future research directions, how to improve
fluctuations since early 2000s (Chuluun et al., 2010).
the reliability of lake area detection and ways to apply
From north to south, precipitation decreases but
this method to understand regional water budget and
temperature increases in Tuin river basin.
also to diagnose socio-ecological vulnerability in the
Accordingly, biome types vary from forest steppe,
lake basin.
steppe, and desert steppe. Mean annual precipitation during 2000s was 186 mm y-1 and 77 mm y-1 in Erdenetsogt and Jinst, respectively (Fig. 1). Pastoral
2. Materials and methods
animal husbandry is a major economic activity in the basin. It is known there is no mining activity in the
1) Study area
basin (Chuluun et al., 2010). Bayanhongor city
The Orog lake (45˚01’N 100o22’E) is a terminal
located in the northern part of the basin (Fig. 1) is the
lake located in the southern end of Tuin river basin
biggest residential and commercial area with
(Fig. 1). Tuin river originates from the Khanggai
population of 25,000.
Mountain Range in central Mongolia. The lake is
– 269–
Korean Journal of Remote Sensing, Vol.28, No.3, 2012
Bogd sums (Fig. 1). We collected monthly
2) Data collection and manipulation
precipitation and monthly mean temperature from (1) MODIS data
1990 to 2010. To consider the effect of snowfall on
MODIS NDVI is one of level-3 MODIS Land
the lake area, we assumed that precipitation in
Product dataset that are generated from MOD09 Land
months with mean temperature lower than -5 ˚C as
Surface Reflectance data (Huete et al., 2002). The
snow, and examined the relationship of snowfall in
NDVI is produced at 4 different resolutions (i.e. 250
the previous winter season with the lake area in the
m, 500 m, 1 km, and 0.05 degree) and in 2
following spring. We also calculated annual
projections (Sinusoidal and Geographic). Except for
cumulative precipitation to consider the annual
0.05 degree NDVI, another NDVI datasets are
precipitation effect on inter-annual lake area
produced in Sinusoidal (SIN) production. In order to
variations.
maintain reasonable accessible file sizes, the SIN projection is divided up into a tiled grid that is
3) Lake area detection and change analysis
composed of adjacent non-overlapping tiles with their
While NDVI value ranges between -1 to +1, the
predefined geo-locations. The tiled grid has number
index is also characterized by sensitive response to
of tiles of 36 horizontal (i.e. longitudinal) and 18
water bodies, generally represented by negative or
vertical (i.e. latitudinal) segmentations. Each 250 m
very low positive value, which indicates the presence
NDVI tile has 4800 × 4800 pixels with approximate
of surface, snow, or highly saturated soil conditions.
area of 10 degrees square at the equator.
While negative NDVI is generally considered to
In this study, Terra MOD13Q1 250 m 16-day
represent water bodies, high level of water sediment
NDVI data were collected from National Aeronautics
or salt concentration can increase near-infrared
and Space Administration (NASA) WIST download
reflectance, leading to positive NDVI values (Jensen,
service system. The Tuin river basin is located within
2005). Considering the potentially high sediment
a 25th horizontal and 4th vertical MODIS NDVI tile
concentration of the shallow Orog lake (Chuluun et
in the tiled grid. We acquired total 253 number of
al., 2010), we decided to use threshold NDVI value
NDVI tile data from 2000 to 2010. We used IDL/
of 0.03 for lake area classification. The threshold
ENVI software (RSI Inc.) to convert the projection of
value of 0.03 was empirically identified by visual
the images from SIN to UTM zone 48 North and
interpretation in ArcGIS software at a value showing
subsequently extracted subset images of the Tuin
the largest distinct lake shape for the data period
river basin (Fig. 1). The basin boundary was extracted
(2000-2010). Any pixel with NDVI value lower than
from a Mongolia watershed boundary map provided
the threshold was classified as lake water. One source
by World Wildlife Foundation.
of uncertainty is the presence of snow and ice during winter and early spring, which generally shows
(2) Meteorological data
negative NDVI value. To avoid this problem, we
Meteorological data was acquired from national
only used the NDVI images from late spring to early
meteorological monitoring sites of Mongolia located
autumn (i.e. days of year, DOY, from 145 to 273) for
within the Tuin river basin, which include
the lake area detection.
meteorological stations at 4 sums in the Arhanggai
We analyzed the annual trend of variability in the
aimag: Erden-Tsogtsum, Bayanhongor, Jinst, and
lake area by calculating annual mean, maximum and
–270–
Seasonal and Inter-annual Variations of Lake Surface Area of Orog Lake in Gobi, Mongolia During 2000-2010
minimum lake areas from 2000 to 2010, and
water was detected year-round but to a limited extent.
compared them with annual cumulative precipitation
The third is from 2005 to 2010 in which the lake
and annual mean temperature. We also compared
disappeared and reappeared repeatedly.
wintertime snowfall with springtime lake area to
Time series of the lake area showed distinct
examine whether water input from snow melt
decreasing pattern since 2000 (Fig. 3). In spite of
provides enough recharging water or not.
considerable seasonal fluctuations, the lake area consistently decreased from 2000 to 2010. Seasonal variations were generally characterized by lake area
3. Results and discussions
decreasing in spring and then increasing after summer rainy season (Fig. 3a). However, such seasonal
Seasonal and inter-annual variations of lake area
patterns were not found in years 2001, 2002, and
from DOY 145 to 273 for the years of 2000-2010 are
2009. Springtime lake area was well correlated with
illustrated in Fig. 2. The Orog lake showed
the wintertime snowfall (r=0.68, p