int. j. remote sensing, 1999 , vol. 20 , no. 7, 1419± 1433
Seasonal and interannual pigment concentration in the Canary Islands region from CZCS data and comparison with observations from the ESTOC
 NDEZ-GUERRA³ , R. DAVENPORT² ¶, S. NEUER² , A. HERNA M. J. RUEDA§, O. LLINAS§, G. FISCHER² and G. WEFER² ² Fachbereich Geowissenschaften, UniversitaÈt Bremen, Klagenfurterstr., 28359 Bremen, Germany ³ Facultad de Ciencias del Mar, Universidad de Las Palmas de Gran Canaria, Apartado 550, 35080 Las Palmas, Spain §Instituto Canario de Ciencias Marinas, Direccion General de Universidades e Investigacion Consejeria de Educacion, Cultura y Deportes, Apartado 56, 35200 Telde, Canary Islands, Spain We have compared historical data from the Nimbus-7 Coastal Zone Color Scanner (CZCS) with recent in situ measurements at the European Station for Time-Series in the Ocean, Canary Islands (ESTOC). CZCS data show an annual winter phytoplankton maximum in January but with a large interannual variation. In sediment traps moored at ESTOC we observed winter sedimentation peaks at 1000 m and 3000 m depth occurring about 1 month later. We also observed sedimentation peaks in other seasons which probably result from material advecting into the region. CZCS data suggest that one possible source is the Cape Ghir upwelling ® lament o the north-west African coast. Abstract.
1.
Introduction
The European Station for Time-Series in the Ocean, Canary Islands (ESTOC) is situated approximately 100 km north of the island of Gran Canaria in the Canary Islands region (coordinates 29ß 07¾ N, 15ß 27¾ E) (Llinas et al . 1994, Neuer and Rueda 1997b). A major purpose of the station is to investigate biogeochemical cycles in this region with the aim of providing insight into the processes controlling the ¯ ux of carbon and associated elements in the ocean on seasonal and interannual time scales. As part of these investigations sediment traps have been moored at ESTOC since December 1991 at 1000 m and 3000 m depths (Neuer et al . 1997a). Although ESTOC is almost 400 km from Cape Yubi, the nearest point on the north-west African coast, it was recognized from the outset that the station would probably be in¯ uenced by coastal upwelling e ects (Wooster et al . 1976, Speth and Detlefsen 1982). Several studies of the north-west African upwelling region using remote sensing data have been performed (Nykjaer 1988, Llinas et al . 1989, Van Camp et al . 1991, Nykjaer and Van Camp 1994). These investigations have concentrated on identifying the major characteristics of the entire upwelling region and in particular the relationship between shelf sea surface temperature (SST) and large-scale winds using the ¶ e-mail:
[email protected] International Journal of Remote Sensing
ISSN 0143-1161 print/ ISSN 1366-5901 online Ñ 1999 Taylor & Francis Ltd http:// www.tandf.co.uk/ JNLS/ res.htm http:// www.taylorandfrancis.com/ JNLS/ res.htm
1420
R. Davenport et al.
Nimbus-7 Coastal Zone Color Scanner (CZCS), the Advanced Very High Resolution Radiometer (AVHRR) sensors of the National Oceanic and Atmospheric Administration (NOAA) satellite series and wind data from the European Centre for Medium-Range Weather Forecasts (ECMWF). These studies here also con® rmed the existence of several coastal upwelling ® laments and investigated the factors in¯ uencing such ® lament growth. For the Canary Island region, CZCS data and AVHRR SST measurements have been used to identify characteristic pigment patterns and their relationship with in situ chlorophyll/ temperature data. Herna ndez-Guerra et al . (1993) and Arõ stegui et al . (1994) identi® ed two di erent phytoplankton pigment patterns in the ocean surrounding the islands: large upwelling ® laments (up to 300 km long) extending from the African coast and lee ® laments (up to 100 km) and cyclonic eddies (60± 80 km in diameter) probably caused by the disruptive e ect of the Canary Islands on the Canary current. To gain some understanding of the long-term surface biological activity to be expected at the ESTOC position we ® rst investigated the seasonal and interannual phytoplankton pigment concentration using historical data from the CZCS. Although CZCS observations cover the period 1979± 1985, the pigment patterns are unlikely to be signi® cantly di erent to recent in situ data. We compared the pigment concentration derived from CZCS data with ESTOC sediment trap observations and in situ chlorophyll measurements to determine if the historical data could aid in interpretation of recent in situ measurements. We then investigated the e ects of coastal upwelling at ESTOC using CZCS data and in particular the role of ® laments in transporting material into the Canary Islands region. 2.
Regional setting
The Canary Islands are located in the north-east Atlantic Ocean between 100 km and 600 km o the north-west African coast. They lie on the path of the weak, southwestwards ¯ owing Canary Current, which is an eastern branch of the North Atlantic subtropical gyre (Stramma 1984). The ESTOC station lies about 100 km north of the island of Gran Canaria; the water depth is 3500 m (® gure 1). The north-west African coastal upwelling is a major feature of the region. Upwelling of cold, nutrient-rich North Atlantic Central Water (NACW) originating from depths not exceeding 200± 300 m (Mittelstaedt 1986) is con® ned to a relatively narrow 50± 70 km coastal band. The upwelling intensity is in general correlated with the position of the Azores High which migrates northwards during spring and summer, reaching its most northerly position in July± August. North of 25ß N the upwelling is most intense in summer and autumn (Wooster et al . 1976, Mittelstaedt 1991). A characteristic feature of coastal upwelling is the regular development of ® lament structures at speci® c coastal positions such as Cape Ghir, Cape Yubi and Cape Bojador. These ® laments may extend several hundred kilometres o shore. Nykjaer (1988), for example, reported that the Cape Ghir ® lament has a length scale of 100± 300 km, a width of 10± 50 km and remains stationary over several weeks. Filaments are visible in AVHRR SST images as cold tongues and meanders and in CZCS data as regions with enhanced pigment concentration compared with ambient levels often showing complex mesoscale eddy structures at the o shore end. The main factor promoting ® lament growth appears to be favourable high wind stress (Van Camp et al . 1991). Nevertheless other factors must be considered, as it has
T he OCEAN Project
1421
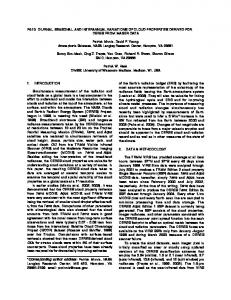
Figure 1. Location of the ESTOC in relation to the Canary Islands and the north-west African coast. The shaded square directly northeast of ESTOC is the source box for material sinking to the 1000 m trap. The shaded rectangle west of Cape Ghir is the area chosen to monitor the pigment concentration of the Cape Ghir ® lament.
been shown for Cape Ghir that there is a 3-month phase lag between the onset of the maximum Trade Winds in summer and the time of the most intense upwelling (Nykjaer and Van Camp 1994); irregularities in bottom topography may modulate coastal upwelling in this case. The Cape Yubi and Cape Bojador ® laments can have an in¯ uence on the Canary Islands (Herna ndez-Guerra et al . 1993). In general though these e ects are observed east and south of the islands as enhanced pigment features. There are no published data regarding possible e ects of the Cape Ghir ® lament on the Canary Island region. 3.
Data and methods
To compare phytoplankton pigment concentration derived from CZCS data at the ESTOC position with recent in situ measurements, we ® rst identi® ed a possible source region for material sinking to the traps. Deuser et al . (1990) argued that it is impossible to know the size and shape of a potential source region for material sinking to a deep-sea trap. Instead it is only possible to match sediment ¯ ux measurements at the trap with average pigment concentrations over a ® xed surface area of crudely estimated size and arbitrary shape. Therefore, for this study, a squareshaped source region was chosen which has the advantage of simplifying the image processing.
1422
R. Davenport et al.
The size and position of the source box for particles sinking to the 1000 m trap was determined using the Canary Current speed and direction, the mean eddy kinetic energy over the sinking depth of the particles and a typical particle sinking rate (Deuser et al . 1990, Siegel et al . 1990). We ignored the 3000 m trap because this approach is not applicable to such depths given the complex vertical current structure and particle life cycle. Since the Canary Current geostrophic ¯ ow is south-westwards (Stramma 1984), it was assumed that the most likely source region was to the northeast of the ESTOC. In the region of the Canary Islands, moored observations show that the mean geostrophic current over one or more years at 200 m water depth can reach speeds up to 4± 5 cm sÕ 1 (Siedler and Onken 1996). At ESTOC current speeds as measured by a continuously recording INFLUX current meter positioned 20 m below the 1000 m trap ranged from 3± 15 cm sÕ 1 but were mostly below 10 cm sÕ 1. Since for this study we used monthly composite CZCS data, a range of 5± 10 cm sÕ 1 was taken as most representative of the current speed. For the eddy kinetic energy 2 1 we took a value of 10 cm sÕ for depths between 100 m and 2000 m (Dickson 1983). The rate at which particles sink is very much dependent on the nature of the particle 1 (Siegel et al . 1990). Ultraplankton for example sink at < 0.1± 2 m dÕ (Bienfang 1 1980), algal aggregates at 40± 150 m dÕ (Smetacek 1985) and mesozooplankton fecal 1 pellets at 20± 900 m dÕ (Fowler and Small 1972). For the ESTOC 1000 m trap during peak ¯ uxes in March 1992 and January and February± March 1993, carbonate contributed between 44 and 55% to the total ¯ ux (Fischer et al . 1996). Microscopic observations showed large numbers of coccolithoporids in the trap samples which dominated the carbonate ¯ ux in the late winter to early spring sedimentation. Because of their small size, coccolithophorids must be transported to the depths via aggregates (Honjo 1982) or in fecal pellets (Honjo 1978). Indeed at ESTOC mesozooplankton fecal pellets have been visually observed to be packed with coccoliths during periods of high particle ¯ ux and may constitute up to 26% of the total ¯ ux (Fischer et al . 1996). Hence for this study we assumed 100 m dÕ 1 as a reasonable value for the sinking rate of trap particles. It then follows that for a particle to sink to the 1000 m trap within 10 days, the maximum distance of the source region cannot exceed 100 km (Siegel et al . 1990). Therefore a source box 100 kmÖ 100 km was chosen north-east of the ESTOC position (® gure 1). CZCS is a multispectral scanner using six channels at 443, 520, 550, 670, 700± 800 nm and 10.5± 12.5 mm of which the ® rst four were selected to measure the upwelled radiance from the ocean surface. Extraction of valid chlorophyll data from the sensor-measured radiance is a complex process as the ocean upwelled radiance is usually less than 10% of the total signal; atmospheric corrections have to be made for both Rayleigh and aerosol scattering (Sturm 1981, Bricaud and Morel 1987, Gordon et al . 1988). For this study we analysed monthly composite images from CZCS data for the period 1979± 1985 from the Ocean Colour European Archive Network (OCEAN) level-3 database for north-west Africa supplied by the Joint Research Centre, Ispra, Italy. Level-3 data provide ® nal pigment concentration values (in mg mÕ 3 ) for each valid image pixel. The pixel size is about 1Ö 1 km2 . The error in the absolute pigment concentration compared with in situ concentration measurements up to 1983 is a factor of two, i.e. for a measured pigment value of 0.5 mg mÕ 3 then the true value may be between 0.25 and 1.0 mg mÕ 3. For post-1983 data, when degradation in the CZCS 443 nm channel was more than 40%, the error in measured pigment concentration may be up to a factor of three (Sturm, personal communication). Non-valid pixels represented clouds or missing data. Monthly composite
1423
T he OCEAN Project
images rather than daily images were chosen as these are better suited to comparison with trap data which had a time resolution of 8± 21 days. For each month the average pigment concentration was calculated using all valid pixels in the source box. The derived average pigment concentration was rejected if the source box contained less than 20% valid pixels. We deployed cone-shaped multisample sediment traps (Kiel Aquatec) at 1000 m and 3000 m depth. These traps are similar in shape and aspect ratio to the Mark V traps described by Honjo and Doherty (1988). For this study we used the total particle ¯ ux observed in the traps measured in mg mÕ 2 dÕ 1. The deployment data are shown in table 1. In situ concentrations of chlorophyll-a were determined by sampling 2± 3 l of sea water, ® ltering onto GF/ C ® lters and freezing for laboratory analysis. The ® lters were later extracted in 90% acetone and chlorophyll-a concentration was measured spectrophotometrically. We also investigated the seasonal activity of the Cape Ghir ® lament by performing a similar analysis of the CZCS data as for the ESTOC region, only this time the 2 source box was 50Ö 200 km with the centre point about 100 km o Cape Ghir (® gure 1). Visual examination of the images derived from CZCS data showed that such a box will `see’ most of the ® lament activity associated with Cape Ghir. This source box is su ciently far from the coast not to include turbid Case 2 waters for which there was no valid atmospheric correction. 4.
Results
4.1. Pigment concentration Figure 2 shows the average monthly phytoplankton pigment concentration for 1979± 1985 for the source box north-east of the ESTOC. Data are missing for nine out of 84 months (all in May/ June/ July or August) due to cloud cover or the CZCS being non-operational. A prominent peak was observed annually in January and this is interpreted as the winter bloom signal. There were large interannual variations in this winter peak with a maximum value of 0.19 mg mÕ 3 observed for December 3 1979± February 1980 compared with a maximum of 0.05 mg mÕ for December 1981± February 1982. For other seasons only one further peak event occurred in 3 August/ September 1980 with a maximum value of 0.06 mg mÕ . The lowest annual 3 pigment concentration, at about 0.03 mg mÕ , was observed each year in summer. This value is the typical minimum pigment concentration observed in CZCS data for open ocean waters o north-west Africa. Figure 3 shows the recent in situ chlorophyll concentration as measured at the ESTOC for 1994. Maximum chlorophyll concentrations between 0 and 25 m depth, re¯ ecting the annual late winter/ early spring bloom, probably occurred in February Table 1. Sediment trap mooring periods at the ESTOC. Mooring no. CI 1 CI 2 CI 3 CI 4
Period 25 November 1991 to 25 September 1992 1 October 1992 to 9 April 1993 12 April 1993 to 7 June 1994 9 June 1994 to 2 September 1994
Total deployment Sampling interval time (days) (days) 305 190 430 86
15 10 21 8
1424
R. Davenport et al.
Figure 2. Average monthly phytoplankton pigment concentration for the ESTOC source box derived from CZCS data for the period 1979± 1985. Note the pronounced but highly variable annual winter bloom peak in January (the ® rst data point for each year) and the lack of peaks in other seasons (except for the low peak in August 1980).
(data interpolation) with a peak value between 0.25 and 0.3 mg mÕ 3. In spring/ summer the chlorophyll maximum was observed to sink to 100 m depth and the near-surface concentration was 0.05 mg mÕ 3. In autumn the surface concentration increased to 0.15 mg mÕ 3. 4.2. Sediment trap total particle ¯ uxes Figure 4 shows the total particle ¯ ux measured in the 1000 m and 3000 m traps for the period December 1991± August 1994. A full dataset is only available for the 3000 m trap. For the 1000 m trap no data were available for the period August 1993 to May 1994. At 3000 m the particle ¯ ux was observed to be highly seasonal with the highest ¯ ux recorded in late February± early March. This late winter peak showed large 2 1 2 1 interannual variations, e.g. a ¯ ux of 118 mg mÕ dÕ in 1994 and 188 mg mÕ dÕ in 1992. During winter 1993 three distinct maxima were observed. Besides the late winter peak additional sedimentation events were observed in other seasons. For example, peaks were observed in July 1992, October 1992, May/ June 1993 and July/ August 1994. None of these events reach the ¯ ux levels seen in the winter peaks (Neuer et al . 1997a). At 1000 m depth the late winter sedimentation event was also observed for 1992 and 1993 and the same three distinct peaks were seen in 1993. The ¯ ux for 1992 was only some 25% of that recorded in the deep trap, while in 1993 it was about 70%. Similar peaks to those observed in the 3000 m trap at other seasons were also observed at 1000 m but again with lower total ¯ ux levels (Neuer et al . 1997a).
T he OCEAN Project
1425
Figure 3. In situ chlorophyll concentration at the ESTOC for 1994. Note that the time axis starts at the beginning of February. The black dots are the measurement points. Full curves are interpolated chlorophyll concentrations.
Figure 4. Total particle ¯ ux for the period December 1991± August 1994 observed in sediment traps moored at the ESTOC. Note the pronounced sedimentation event at 3000 m in February/ March each year and the additional sedimentation events observed in other seasons. Also note that some of these events are also observed in the 1000m trap, but always with lower total ¯ ux levels.
1426 4.3. Cape Ghir ® lamentÐ
R. Davenport et al. seasonal and interannual phytoplankton pigment
concentration
Figure 5 shows the monthly average phytoplankton pigment concentration from CZCS data for Cape Ghir over the period 1979± 1985. As at the ESTOC location, an annual winter bloom was observed with peak values in January, but the peak values were much higher at Cape Ghir than at ESTOC. For example, a phytoplankton pigment concentration of 0.5 mg mÕ 3 was observed in January 1980 at Cape Ghir compared with 0.19 mg mÕ 3 at ESTOC. In other seasons additional peaks were clearly visible in most of the 7 years. One peak event was observed repeatedly in September/ October for all years except 1979 where it appeared to be merged with the broad winter bloom. The other non-winter bloom peaks showed no obvious annual cycle. They were observed in April 1979, June 1979, August/ September 1979, July 1980 and May 1984. 5.
Discussion
5.1. Comparison between phytoplankton pigment concentration derived f rom CZCS data and in situ EST OC chlorophyll measurements In order to compare the CZCS data with the in situ chlorophyll data we restricted the latter to 0± 25 m depth. This is assumed to be the maximum optical depth for an ocean colour sensor in oligotrophic waters. The peak winter bloom occurs in January/ February in the CZCS data and in February in the in situ ESTOC data, but the ESTOC interpolated peak concentration 3 is somewhat higher at 0.25± 0.3 mg mÕ compared with the largest value of 0.19 mg 3 mÕ in January 1980 from CZCS data. In spring/ summer the lowest concentration 3 3 measured at ESTOC is about 0.5 mg mÕ compared with 0.03 mg mÕ for CZCS.
Figure 5. Average monthly phytoplankton pigment concentration in the Cape Ghir region derived from CZCS data for the period 1979± 1985. The annual peak in September/ October correlates with the onset of maximum upwelling for this region (Nykjaer and Van Camp 1994).
T he OCEAN Project
1427
Figure 6. Schematic illustration of relationship between near-surface phytoplankton bloom and particle ¯ uxes measured by a deep-sea sediment trap array. (a ) Traps located directly below the bloom. (b ) Traps located to the side of the bloom (redrawn from Siegel et al . (1990)). 3 The peak event of 0.06 mg mÕ observed in August 1980 in the CZCS data may be the result of phytoplankton development in the mixed layer as seen at the ESTOC station in autumn 1994 when the surface chlorophyll concentration increased to 3 0.15 mg mÕ . Interpretation of CZCS data should be treated with caution though, given the errors in chlorophyll values derived from the OCEAN level-3 data. Nevertheless since the patterns of annual cycles are the same in both sets of data we conclude that the CZCS observed annual cycle is valid.
5.2. Comparison between CZCS data and sediment trap observations: the winter bloom
The peak winter bloom in January/ February as observed in the historical CZCS data (® gure 2) occurs about 1 month earlier than the peak particle ¯ ux observed in the sediment traps (® gure 4). Given the complex biological and physical processes involved in the export of material from the euphotic zone to the deep ocean it is not obvious that a surface bloom will somehow result in a sedimentation event as recorded in the traps. However, we o er the suggestion that both events are strongly coupled. The 1-month time delay between a surface bloom and a peak sedimentation
R. Davenport et al.
(a)
1428
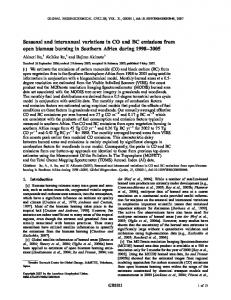
Figure 7. Phytoplankton pigment concentration from the Nimbus-7 CZCS for (a ) 6 November 1981 and (b ) 19 October 1980. Notice in (a ) that the Cape Ghir ® lament has two parts: one ® lament stretches north-westwards nearly 200 km to Lanzarote and the other westwards to Fuerteventura then south-westwards towards Gran Canaria. Both ® laments appear to be blocked by the Canary Islands westwards. Note also in (b ) that the Cape Ghir ® lament stretches at least 300± 400 km o shore and develops complex meanders that suggest the presence of mecoscale eddies (Nykjaer 1988).
(b)
T he OCEAN Project
1429
1430
R. Davenport et al.
event rather than the 10 days assumed earlier for a typical trap particle probably represents the delay between a peak phytoplankton bloom and the onset of zooplankton grazing and subsequent fecal pellet production. Indeed these observations can also be compared with those of Deuser et al . (1990) who observed a 1.5-month phase lag between surface phytoplankton blooms and sedimentation events in a trap at 3200 m depth in the Sargasso Sea. 5.3. Comparison between CZCS data and sediment trap observations: other seasonal peaks
The absence of chlorophyll peaks outside of the winter bloom over 7 years of CZCS data (except for the single peak in August 1980) contrasts sharply with the peaks recorded in the traps over 3 years. Combining this fact with the observation that for concurrent peaks in both traps, the 3000 m ¯ uxes are always higher than those in the 1000 m trap strongly suggests that these trap sedimentation events are not connected with surface blooms in the ESTOC region. We rejected the possibility of bottom sediment resuspension partly because the lower trap was moored 500 m above the ocean ¯ oor but, more convincingly, because the same events are seen in the upper trap which is 2500 m above the bottom. We suggest instead that material is laterally advecting into the ESTOC region. Figure 6 (adapted from Siegel et al . 1990) shows conceptually how a trap not lying directly under a surface bloom but instead to one side may result in the observation of more material in the lower than in the upper traps. Although we believe this is a possible explanation for the trap results, the absence of peaks outside of the winter bloom in the CZCS data indicates that such material must be coming from surface events > 100 km distant. In determining the size of the source square we assumed a constant particle sinking rate and eddy kinetic energy. Siegel et al . (1990) point out though that the physical state of a particle may change considerably with depth through aggregation, break-up, consumption and transformation processes. The residence time in the deep ocean may therefore be signi® cantly increased thus increasing the spatial averaging scale. In particular slowly sinking aggregates 1 (1± 35 m dÕ (Asper 1987)) would have length scales of 100± 500 km for a 1000 m trap (Siegel et al . 1990). Also, since we are considering a region in¯ uenced by the Canary Current, particles will be subject to higher eddy kinetic energy near the surface than the value assumed above and hence the spatial averaging scale will also be increased. It therefore seems plausible to investigate possible source regions for ESTOC trap material that are more than 100 km distant. 5.4. Upwelling e ects on the Canary Island region Three possible sources of upwelling in the Canary Island region can be considered: the Cape Yubi and Cape Ghir ® laments on the African coast (Nykjaer 1988, Van Camp et al . 1991) and ® laments resulting from upwelling o the north-west coast of Fuerteventura in the Canary Islands (Real et al . 1981, Molina and Laatzen 1989). The Cape Bojador ® lament is not considered because it is too far south and appears only to a ect the region south of the Canary Islands (Herna ndez-Guerra et al . 1993). We ® rst consider the Cape Yubi ® lament. Figure 7(a ) is an image derived from CZCS data for 6 November 1981 and shows a well developed Cape Yubi ® lament structure. It consists of two parts: one ® lament stretching almost 200 km northwestwards to the island of Lanzarote and a second stretching westwards to
T he OCEAN Project
1431
Fuerteventura and then turning south-west towards Gran Canaria. Both ® laments appear to be blocked by the Canary Islands westwards. The southerly ® lament also appears to be impacted by the south-westwards ¯ owing Canary Current. This conclusion is supported by other CZCS image analyses (e.g. Herna ndez-Guerra et al . 1993). It is therefore unlikely that this ® lament transports material to the ESTOC position north of the islands. Filaments having higher than ambient pigment levels have been observed using CZCS data o the west coast of Fuerteventura in November 1983 (Herna ndezGuerra et al . 1993). We have also observed higher pigment concentrations o the north-west coast of Fuerteventura for an image derived from CZCS data for 9 July 1980 (not presented here). Although such island ® laments are never as extensive as those of Cape Ghir or Cape Yubi, they occur less than 200 km from the ESTOC. Fuerteventura ® laments may therefore in¯ uence particle sedimentation in the ESTOC traps. Figure 7(b ) is a CZCS image from 19 October 1980 and shows a well developed Cape Ghir ® lament. High pigment concentration associated with this ® lament stretches at least 300± 400 km westwards from Cape Ghir. The complex structure of the ® lament o shore may indicate the presence of mesoscale eddies as suggested by Nykjaer (1988). Although cloud cover makes it di cult to see how the ® lament develops further west there are suggestions in the cloud breaks of transport in a south-west direction towards the Canary Islands. The seasonal and interannual phytoplankton pigment concentrations over 7 years in the region of the Cape Ghir ® lament (® gure 5) show peaks that follow an annual pattern as well as additional random events. Thus, as with the ESTOC data, the annual peak in January is interpreted as the winter bloom. The annual peak observed in September/ October is probably a result of the onset of maximum upwelling in autumn as reported by Nykjaer and Van Camp (1984) for the Cape Ghir region. The random events may be the result of short periods of coastal upwelling. Because of the di erent time periods involved in CZCS data for Cape Ghir and ESTOC trap data we have not attempted to correlate the observed peak events in the two sets of data. Nevertheless we suggest that given the annual pattern of the Cape Ghir ® lament and its geographical location with respect to the ESTOC it should at least be considered a possible source of advected trap material in all seasons. 6.
Conclusion
For a region north of the Canary Islands analysis of monthly composite images derived from CZCS data over the period 1979± 1985 shows a prominent winter pigment concentration each year in January. This is interpreted as the winter bloom signal. In other seasons only one extra peak event in August 1980 was observed over the 7-year period. Comparison of CZCS data with in situ chlorophyll data from the ESTOC in 1994 positioned about 100 km north of Gran Canaria shows the same overall annual cycle. Sediment traps deployed at 1000 m and 3000 m depths from December 1991± August 1994 also showed late winter sedimentation events but with a delay of about 1 month in February/ March. We suggest that the peak ¯ uxes of particulate matter result from the sedimentation of the winter bloom as observed in the historical CZCS data. In other seasons additional sedimentation events were observed although they were not as signi® cant as the winter bloom signal. In addition, particle ¯ ux in the lower trap was higher than that in the shallow trap. By combining the trap
1432
R. Davenport et al.
observations with the lack of non-winter peaks in the CZCS data we conclude that material is advecting into the ESTOC region from distances > 100 km. Analysis of images derived from CZCS data for the north-west African upwelling region has identi® ed two possible sources of trap material: the Cape Ghir ® lament and blooms possibly associated with an upwelling o the west coast of Fuerteventura. Acknowledgm ents
The CZCS data were supplied by the Joint Research Centre, Commission of the European Communities, Ispra, Italy. We would like to thank Vittorio Barale and David Larkin of the Joint Research Centre for providing us with OCEANcode for processing the CZCS data and patiently answering the many e-mails we generated while learning to use the software. We would also like to thank Leo Nykjaer for several helpful discussions regarding the north-west African upwelling region and Alexander Bachem who developed additional software for analysis of the CZCS data. References A ri’stegui, J ., S angra’, P ., H erna’ndez- L eo’ n, S ., C anto’ n, M ., H erna’ ndez- G uerra , A., and K erling , J. L., 1994, Island-induced eddies in the Canary Islands. Deep-Sea Research, 41, 1509± 1525. A sper , V. L., 1987, Measuring the ¯ ux and sinking speeds of marine snow aggregates. DeepSea Research, 34, 1± 17. B ienfang , P. K., 1980, Phytoplankton sinking rates in oligotrophic waters o Hawaii, USA. Marine Biology , 61, 69± 77. B ricaud , A., and M orel, A., 1987, Atmospheric corrections and interpretation of marine radiances in CZCS imagery: use of a re¯ ectance model. Oceanologica Acta, 7, 33± 50. D euser, W . G ., M uller-K arger, F . E ., E vans, R . H ., B rown, O . B ., E saias, W. E., and F eldman , G. C., 1990, Surface-ocean color and deep-ocean carbon ¯ ux: how close a connection? Deep-Sea Research, 37, 1331± 1343. D ickson , R. R., 1983, Global summaries and intercomparisons: ¯ ow statistics from long-term
current meter moorings. In Eddies in Marine Science, edited by A. R. Robinson (New York: Springer-Verlag), pp. 278± 353. F ischer, G ., N euer, S ., W efer , G., and K rause, G., 1996, Short-term sedimentation pulses recorded with a ¯ uorescence sensor and sediment traps at 900 m depth in the Canary Basin. L imnology and Oceanography , 41, 1354± 1359. F owler, S. W., and S mall , L. F., 1972, Sinking rates of euphasiid fecal pellets. L imnology and Oceanography , 17, 293± 296. G ordon, H . R ., B rown, J. W., and E vans , R. H., 1988, Exact Rayleigh scattering calculations for use with the Nimbus-7 Coastal Zone Color Scanner. Applied Optics, 27, 862± 871. H erna’ ndez- G uerra, A ., A ri’stegui, J ., C a’nton, M ., and N ykjaer , L., 1993, Phytoplankton pigment patterns in the Canary Islands area as determined using Coastal Zone Colour Scanner data. International Journal of Remote Sensing, 14, 1431± 1437. H onjo , S., 1978, Sedimentation of materials in the Sargasso Sea at a 5367 m deep station. Journal of Marine Research, 36, 469± 492. H onjo , S., 1982, Seasonality and interaction of biogenic and lithogenic particulate ¯ ux at the Panama basin. Science, 218, 883± 884. H onjo , S., and D oherty, K. W., 1988, Large scale aperture time-series sediment traps; design, objectives, construction and application. Deep-Sea Research, 35, 135± 149. L lina’ s, O ., D e L eon, A . R ., S iedler, G., and W efer , G., 1994, The ESTOC time series station started operation. International WOCE Newsletter, 17, 20. L lina’ s , O., R ueda , M. J., and P e^rez-M artell , E., 1989, Aportacio n de la teledeteccio n a la cuanti® cacio n de algunos feno menos oceanogra® cos de intere s en Canarias. III Reunio n cienti® ca del grupo de trabajo en teledeteccio n, Madrid, 1989 , edited by C. Anto n-Pacheco and J. L. Labrandero, pp. 327± 336. M ittelstaedt , E., 1986, Upwelling regions. In Oceanography, L andolt± BoÈrnstein New Series, Group V, vol. 3c, edited by J. SuÈndermann (New York: Springer-Verlag), pp. 135± 163.
T he OCEAN Project
1433
M ittelstaedt , E., 1991, The ocean boundary along the northwest African coast: circulation and oceanographic properties at the sea surface. Progress in Oceanography , 26,
307± 355.
M olina , R., and L aatzen, F. L., 1989, Hidrografõ a en la regio n Canaria. Campan Ä a Canarias I. Boletõ n del Instituto EspanÄol de Oceanografõ  a, 5, 71± 86. N euer, S ., R atmeyer, V ., D avenport, R ., F ischer , G., and W efer , G., 1997a, Deep water
particle ¯ ux in the Canary Island region: seasonal trends in relation to long-term satellite derived pigment data and lateral sources. Deep-Sea Research, 44 , 1451± 1466. N euer , S., and R ueda , M. J., 1997b, European Time Series Station in Operation North of Canary Islands. US JGOFS News, 8 , No. 2, 9 and 15. N ykjaer , L., 1988, Remote sensing applied to the Northwest African upwelling area. PhD Thesis, University of Copenhagen, Denmark. N ykjaer , L., and V an C amp, L., 1994, Seasonal and interannual variability of coastal upwelling along northwest Africa and Portugal from 1981 to 1991. Journal of Geophysical Research, 99, 14197± 14207. R eal, F ., de A rmas, J. D., and B raun , J. G., 1981, Distribucio n espacial de la cloro® la a y del carbono orga nico particulado en aguas costeras super® ciales de las Islas Canarias. Boletin Instituto EspanÄol de Oceanogra® a, 6, 109± 115. S iedler , G., and O nken , R., 1996, Eastern recirculation. In T he Warm water sphere of the North Atlantic Ocean, edited by W. Krauss (Berlin: BorntraÈger), pp. 339± 364. S iegel, D . A ., G ranata, T . C ., M ichaels , A. F., and D ickey , T. D., 1990, Mesoscale eddy di usion, particle sinking, and the interpretation of sediment trap data. Journal of Geophysical Research, 95, 5305± 5311. S metacek , V. S., 1985, Role of sinking diatom life-history cycles: ecological, evolutionary and geological signi® cance. Marine Biology , 84, 239± 251. S peth , P., and D etlefsen , H., 1982, Meteorological in¯ uences on upwelling o Northwest Africa. In Rapports et ProceÁsÐ Verbaux des Re unions, Conseil International pour l’Exploration de la Mer., Copenhagen, Denmark, 180, 29± 35. S tramma, L., 1984, Geostrophic transport in the warm water sphere of the eastern subtropical North Atlantic. Journal of Marine Research, 42, 537± 558. S turm , B., 1981, The atmospheric correction of remotely sensed data and the quantitative determination of suspended matter in marine water surface layers. In Remote Sensing in Meteorology, Oceanography and Hydrology , edited by A. P. Cracknell (Chichester: Ellis Horwood), pp. 163± 197. V an C amp, L ., N ykjaer, L ., M ittelstaedt, E., and S chlittenhardt , P., 1991, Upwelling and boundary circulation o Northwest Africa as depicted by infrared and visible satellite observations. Progress in Oceanography , 26, 357± 402. W ooster, W ., B akun, A ., and M c L ain , D. R., 1976, The seasonal upwelling cycle along the eastern boundary of the North Atlantic. Journal of Marine Research, 34, 131± 141.