Jun 3, 2003 - Citation: Dong, S., and K. A. Kelly, Seasonal and interannual variations in ..... [Joyce et al., 2000; Taylor and Stephens, 1998; Kelly et al.,. 1996].
JOURNAL OF GEOPHYSICAL RESEARCH, VOL. 108, NO. C6, 3172, doi:10.1029/2002JC001357, 2003
Seasonal and interannual variations in geostrophic velocity in the Middle Atlantic Bight Shenfu Dong and Kathryn A. Kelly Applied Physics Laboratory, University of Washington, Seattle, Washington, USA Received 20 February 2002; revised 10 January 2003; accepted 3 March 2003; published 3 June 2003.
[1] More than 6 years of measurements from the TOPEX/POSEIDON (T/P) altimeter are
used to study the seasonal and interannual variations of the geostrophic velocity anomalies in the Middle Atlantic Bight region. Geostrophic velocities from T/P data are compared with the simultaneous low-pass filtered current meter data. The correlations are all above 95% significance for the three current meter observations at the 1000-m, 2210-m, and 2990-m isobaths. The seasonal mean geostrophic currents from 63�–75�W show coherent variations along isobaths, with seasonal reversals: toward the southwest during the winter and toward the northeast during the summer. The EOF analysis indicates that the seasonal reversals disappeared during 1996. This disruption is part of the intensification of the slope sea gyre and is related to the southward shift of the Gulf Stream, which acts as the boundary between the subpolar and subtropical gyres. The Gulf Stream moved farther south during 1996–1998. The variations in the Gulf Stream position may be caused by the INDEX TERMS: 4512 Oceanography: Physical: Currents; 4528 wind stress/wind stress curl change. Oceanography: Physical: Fronts and jets; 4546 Oceanography: Physical: Nearshore processes; 4572 Oceanography: Physical: Upper ocean processes; 4599 Oceanography: Physical: General or miscellaneous; KEYWORDS: geostrophic velocity, slope current, Middle Atlantic Bight, TOPEX/Poseidon, sea surface height Citation: Dong, S., and K. A. Kelly, Seasonal and interannual variations in geostrophic velocity in the Middle Atlantic Bight, J. Geophys. Res., 108(C6), 3172, doi:10.1029/2002JC001357, 2003.
1. Introduction [2] A closed cyclonic gyre between the Gulf Stream and the continental shelf was first derived by Sverdrup et al. [1942], based on the slope of coastal sea level. This narrow band of ocean between the Gulf Stream and continental shelf was named the ‘‘Slope Sea’’ by Csanady and Hamilton [1988]. Combining results from the Middle Atlantic Slope and Rise (MASAR) experiment with earlier evidence, Csanady and Hamilton [1988] constructed an empirical scheme of slope water circulation. The dominant feature of this scheme is a closed cyclonic gyre in the western Slope Sea and an open cyclonic circulation pattern in the eastern Slope Sea that are separated by the onshore flow near the eastern end of Georges Bank. North of Cape Hatteras slope and shelf water turn and flow eastward along the northern edge of the Gulf Stream. [3] Many studies have been carried out in the Middle Atlantic Bight (MAB) region. These studies show that the mean flow over the continental shelf and slope within the MAB is toward the southwest along the isobaths [Beardsley et al., 1985; Aikman et al., 1988; Rossby and Benway, 2000]. This southwestward flow is stronger during winter and is weak or reverses during summer. Based on oxygen isotope measurements, Chapman et al. [1986] and Chapman and Beardsley [1989] have suggested that the mean Copyright 2003 by the American Geophysical Union. 0148-0227/03/2002JC001357$09.00
flow is continuous between the Scotian shelf and the MAB and that it is continuous as far north as the southern coast of Greenland. However, Loder et al. [1998] found the upstream buoyancy forcing is mainly from the Baffin Island Current. [4] So far, most studies in the MAB have been focused on the shelf region and have been highly localized. Although a few long-term records of currents have been obtained over the upper slope [Beardsley et al., 1985; Csanady et al., 1988; Aikman et al., 1988], the different conditions during the observational periods made it difficult to reach a consistent conclusion on the seasonal variations. The seasonal reversal of the slope current observed in the Nantucket Shoals Flux Experiment (NSFE79) [Beardsley et al., 1985] was not apparent in the Shelf Edge Exchange Processes (SEEP-I) experiment [Aikman et al., 1988]. Different mean currents were also observed off the Scotian shelf [Smith and Petrie, 1982]. The 1-year- or 2-year-long records are too short to study the interannual variations or to compute an accurate annual cycle. Although Csanady and Hamilton [1988] observed the slope flow at two transects off New Jersey and Virginia, the alongshore variations of the upper slope current in the MAB have not been studied. Do the slope currents vary coherently alongshore? What are the seasonal and interannual variations in the currents? These are the questions we are trying to answer in this study. [5] With satellite altimetry measurements, it is possible to study large-scale MAB circulation variations over many years. Han and Tang [1999, 2001] studied seasonal and
3-1
3-2
DONG AND KELLY: GEOSTROPHIC VELOCITY IN THE MIDDLE ATLANTIC BIGHT
interannual variations in the Labrador Sea transport by combining TOPEX/POSEIDON (T/P) altimetry data with hydrographic and wind data. In this study we use altimetric sea surface height (SSH) data to investigate the seasonal and interannual variations in the geostrophic velocity anomalies over the entire MAB slope region (water depth from 500 m to 2000 m). Comparisons of shelf velocities with in situ observations suggest that tidal corrections for the altimeter are not sufficiently accurate to extend the study to the shelf. The ocean tidal corrections in the merged geophysical data records (MGDRs [Benada, 1997]) are generally adequate only for the regions where the water depth is deeper than 2000 m. The residual signal from an inaccurate tidal correction is aliased to longer periods by the T/P sampling. Four different tidal corrections are checked (see detail in Appendix A). None of them can reduce the variance in the SSH derivatives from which the geostrophic velocity is deduced. However, on the basis of in situ measurements, the tidal signal should contribute about half of the variance of the total velocity in shallow water.
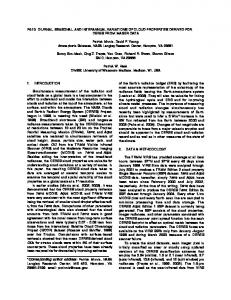
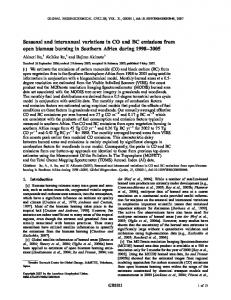
2. Altimetric and In Situ Data [6] The altimeter data used are from the joint United States/France T/P mission for the period from December 1992 to December 1998. The satellite repeats its ground track every 9.9 days with an along track resolution of about 7 km. The altimetric measurements from the descending tracks are used to examine the slope water geostrophic velocity anomalies. Gridded SSH maps are used for the large-scale analysis. The corrections supplied in the MGDRs are all applied to the SSH, and the temporal mean SSH (January 1993 to December 1998) at each location is removed to eliminate the geoid. [7] The geostrophic velocity calculated from T/P SSH (Figure 1) is compared with direct current measurements from the shelfbreak PRIMER experiment [Pickart et al., 1999]. The PRIMER experiment was carried out over the shelf and slope near 70�W. During the PRIMER experiment an array of moorings was deployed for 2 years (December 1995 to December 1997) along a T/P track near 70�W. The near surface currents (90 m, 110 m, 99 m) from three moored VACMs (see Figure 2a), located at roughly the 1000-m, 2210-m, and 2990-m isobaths, are low-pass filtered to remove fluctuations with a period of 48 hours or less. In addition, near surface currents from two ADCP moorings (located on the shelf at the 125-m and 168-m isobaths) are used for comparison (the shallowest bin depths are 25 m and 26 m). The time period for the ADCP moorings is December 1995 to March 1997.
3. Geostrophic Velocity Anomalies [8] The anomalous geostrophic velocity can be estimated from the SSH anomaly h as u = �(g/f@h/@y), where y is in the satellite along track direction, g is the gravitational acceleration, and f the Coriolis parameter. The once per second T/P SSH measurements are used directly without smoothing along the satellite track or in time. A centered scheme is used to compute the geostrophic velocity anomalies. [9] To compare the cross track geostrophic currents with the in situ currents, we projected the in situ currents into the
cross track direction. Correlations between the two current estimates are high (Figure 1) at the locations deeper than 1000-m isobath: 0.78 (2990 m), 0.83 (2210 m), and 0.82 (1000 m), respectively; all are above the 95% significance level, 0.31, 0.37, and 0.39, respectively. However, correlations with ADCP velocities in shallow water (