CLIMATE RESEARCH Clim Res
Vol. 72: 217–237, 2017 https://doi.org/10.3354/cr01467
Published online July 12
OPEN ACCESS
Seasonal patterns and consistency of extreme precipitation trends in Europe, December 1950 to February 2008 Ewa B. Łupikasza* Department of Climatology, Faculty of Earth Sciences, University of Silesia in Katowice, 41-200 Sosnowiec, Poland
ABSTRACT: Seasonal trends in extreme precipitation indices were investigated for 30 yr moving periods between December 1950 and February 2008. To update the 2008 to 2015 data, supplementary calculations were performed for >120 meteorological stations. A linear regression of the least squares method was used to calculate trend magnitudes. Trend significance was tested using the Mann-Kendall method. Changes in short-term trend frequency and temporal coherence were assessed. Extreme precipitation was defined as a daily amount exceeding the 95th percentile, calculated separately for each month and station using daily totals ≥1 mm. The spatial pattern of extreme precipitation trends varied by season. Significant extreme precipitation trends were rare, constituting approximately 25 to 30% of all analysed trends, and were seldom temporally coherent. Most of these significant trends were upward, except in summer, when a nearly equal frequency of positive and negative trends was found. Increases in the frequency and the total were a characteristic feature of extreme precipitation changes, particularly in winter. Seasonal variations in the spatial patterns of extreme precipitation trends may have resulted from seasonal changes in the prominence of the driving factors of precipitation. In spring, upward trends in Central and Western Europe were twice as frequent as the downward trends found primarily in Southern Europe. In summer, the percentages of significant downward trends in Western Europe and upward trends in Eastern Europe were similar. In autumn, a coherent decrease in extreme precipitation was clear in Central Europe. The spatial distribution of trend directions was the most consistent in winter. KEY WORDS: Precipitation trends · Heavy precipitation · Climate change · Trend variability and coherence · Europe
1. INTRODUCTION Extreme precipitation events are known to trigger many hydrological and geomorphological processes (e.g. floods, run-off, landslides, and transport of sediments) and directly influence the living conditions of humans and other species. Due to their large inherent variability, the unequivocal identification of precipitation trends is very difficult. Spatial and seasonal changes in extreme precipitation, particularly on a continental scale, are a manifestation of changes in processes that lead to the formation of precipitation (e.g. convection, processes inside clouds). Locally, pre*Corresponding author:
[email protected]
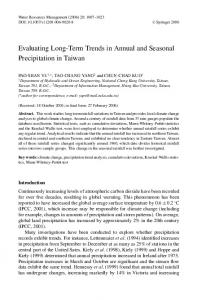
cipitation is modified by the availability of moisture and is affected by circulation systems that are subject to local energetic constraints (Hartmann et al. 2013). Therefore, the sign of extreme precipitation trends can indicate the direction of possible future changes in precipitation formation processes. Extreme precipitation trends in Europe have been analysed on continental and regional scales. Selected results of this research are presented as a schematic map in Fig. 1. Europe has experienced a significant increase in extreme winter precipitation, although the trends were not spatially coherent (Klein-Tank & Können 2003). In summer, when conditions that © The authors 2017. Open Access under Creative Commons by Attribution Licence. Use, distribution and reproduction are unrestricted. Authors and original publication must be credited. Publisher: Inter-Research · www.int-res.com
218
Clim Res 72: 217–237, 2017
Łupikasza: Seasonal trends in extreme precipitation
favour the development of convection are the most common, extreme precipitation trends are spatially variable in direction and magnitude (e.g. Moberg & Jones 2005). Positive trends were found in Eastern Europe, whereas decreases were predominant in Western Europe (Moberg & Jones 2005, Zolina et al. 2005, Moberg at al. 2006, Burt & Horton 2007). Besselaar et al. (2013) reported stronger regularity of the trends in the recurrence period of the highest 1 d and 5 d precipitation totals in the second half of the 20th century and the following decade (1951−2010; Besselaar et al. 2013). Northern Europe exhibited predominantly growing trends in these indices, whereas growing but weaker trends were confirmed in Southern Europe in spring, summer and autumn (Besselaar et al. 2013). The trends in heavy cyclonic precipitation (≥60 mm) were positive in Northern Europe and negative in Southern Europe (1956 to 2000). However, their statistical significance depended on the period and season: Negative trends were significant in the last or last 2 decades of the 20th century, whereas no trends reached statistical significance during the entire period (Karagiannidis et al. 2012). The direction of trends in extreme precipitation also varied depending on the study period in Northern Italy (Pavan et al. 2008). Research at a regional scale has demonstrated broad spatial and seasonal differences in trend directions. Persistent increasing trends in various characteristics of extreme precipitation were detected in the Netherlands in both warm and cool seasons during 1951–2009 (Buishand et al. 2013) and in the Hungarian region of the Carpathian Basin in the last quarter of the 20th century (Bartholy & Pongrácz 2007). Gajić->apka & Cindrić (2011) detected no evidence of major secular changes in the amount and frequency of extreme precipitation since the beginning
219
of the 20th century (1901 to 2008) over most of Croatia. In other parts of Europe, the direction and statistical significance of trends varied depending on the season and research period, as discussed below. In summer, extreme precipitation significantly increased in Eastern Europe (1936 to 1994) (Easterling et al. 2000) and the Czech Republic (Kyselý 2009). In Norway, precipitation in summer displayed no statistically significant change over nearly a century (i.e. 1901 to 1996) (Easterling et al. 2000). Similarly, no trends were found for intense daily precipitation in summer in the Alpine region of Switzerland (Frei & Schär 2001, Schmidli & Frei 2005). In contrast, extreme summer precipitation decreased in the UK (Osborn et al. 2000, Osborn & Hulme 2002, Maraun et al. 2008, Burt & Ferranti 2012, Jones et al. 2013) and western Germany (Hundecha & Bárdossy 2005). In winter, increasing trends in various characteristics of extreme precipitation were predominant in Central and Western Europe including the UK (Osborn et al. 2000, Osborn & Hulme 2002, Maraun et al. 2008, Burt & Ferranti 2012, Jones et al. 2013), Germany (Hundecha & Bárdossy 2005, Łupikasza et al. 2011), western Czech Republic (Kyselý 2009), and Switzerland (the Alpine region) during the 20th century (Frei et al. 2000, Frei & Schär 2001). Opposite trends prevailed in southern Poland (Lupikasza 2010, Łupikasza et al. 2011). In transitional seasons (spring and autumn), extreme precipitation increased in western Germany (Hundecha & Bárdossy 2005), decreased in the Czech Republic (Kyselý 2009) and varied in direction in Poland (Lupikasza 2010) and the UK during the second half of the 20th century (1961 to 2000) (Osborn & Hulme 2002). However, when the UK data series was extended to 2006, an upward trend in extreme precipitation was identified (Maraun et al. 2008, Jones et al. 2013).
Fig. 1. Review of research on extreme precipitation trends in Europe, based on selected literature. Blue triangles: significant upward trends; orange triangles: significant downward trends; black stars: various trend directions in a time frame; crosses: no significant trends; M: method of trend analysis; 1/2/: number corresponding to the method of trend analysis (see below); filled parts of time bars: time frame of trend analysis; numbers to the left of time bars: exact period of trend analysis (see below). Numbering of trend analysis methods: (0) Linear least-squares; (1) t-test; (2) Mann-Kendall test; (3) Wilcoxon test; (4) Hayashi reliability ratio; (5) block bootstrap technique; (6) resistant methods; (7) Kendall-tau test; (8) F-test; (9) Log-linear model; (10) Teil-Sen estimator; (11) Log-likelihood ratio; (12) linear non-stationary model; (13) Spearmann correlation (SC); (14) field significance; (15) logistic regression; (16) differences between averages. Numbering of time bars: (0) 1880−1996, (1) 1900−2002, (2) 1900−2006, (3) 1901−1991, (4) 1901−1994, (5) 1901−1996, (6) 1901−1999, (7) 1901−2000, (8) 1901−2004, (9) 1908−1995, (10) 1910−2009, (11) 1921−1999, (12) 1923−2002, (13) 1930−2006, (14) 1931−1995, (15) 1936−1994, (16) 1951−2000, (17) 1951−2002, (18) 1951−2004, (19) 1951−2006, (20) 1951−2010, (21) 1955−2006, (22) 1958−1997, (23) 1958−2001, (24) 1960−2000, (25) 1960−2006, (26) 1961−1995, (27) 1961−2001, (28) 1961−2005, (29) 1961−2009. Sources: Klein-Tank & Können (2003), Moberg & Jones (2005), Zolina et al. (2005), Moberg et al. (2006), Besselaar et al. (2013), Easterling et al. (2000), Karagiannidis et al. (2012), Easterling et al. (2000), Osborn et al. (2000), Burt & Ferranti (2012), Osborn & Hulme (2002), Maraun et al. (2008), Jones et al. (2013), Hundecha & Bárdossy (2005), Łupikasza et al. (2011), Buishand et al. (2013), Lupikasza (2010), Kyselý (2009), Frei et al. (2000), Frei & Schär (2001), Schmidli & Frei (2005), Bartholy & Pongrácz (2007), Norrant & Douguédroit (2006), Brunetti et al. (2000), Pavan et al. (2008), Gajić->apka & Cindrić (2011), Ramos & Martinez-Casanovas (2006), Rodrigo & Trigo (2007), Beguería et al. (2011), López-Moreno et al. (2010), Rodrigo (2010), García et al. (2007)
220
Clim Res 72: 217–237, 2017
In Southern Europe, significant changes were found in parts of Greece, Italy, and the Gulf of Valencia (Norrant & Douguédroit 2006). In northern Italy, the frequency of intense and extreme precipitation events during 1951 to 2004 decreased significantly in winter and spring and increased in summer in mountainous regions (Piervitali et al. 1998, Brunetti et al. 2000, Pavan et al. 2008). Studies of the entire Iberian Peninsula indicated a great variety of extreme precipitation trend directions, depending on the research period (e.g. Norrant & Douguédroit 2006, Ramos & Martinez-Casanovas 2006, Rodrigo & Trigo 2007, Beguería et al. 2011, López-Moreno et al. 2010). In general, the Iberian Peninsula was characterized by an increased probability of dry conditions, but no increased probability of extreme wet conditions was detected (Rodrigo 2010). However, predominant decreasing extreme precipitation trends in winter in the Iberian Peninsula were reported by García et al. (2007). According to the above literature review, extreme precipitation trends tend to be infrequently statistically significant, strongly dependent on the timeframe studied, and not spatially coherent. These attributes may partly result from the variety of methods, definitions, and periods adapted for extreme precipitation research, but may also reflect the inherent variability in precipitation extremes. Willems (2013) found that rainfall extremes in Europe exhibit oscillatory behaviour on multidecadal time scales. He reported that recent upward trends in precipitation extremes in parts of Europe are partly related to a positive phase of this oscillation. Moreover, questions regarding the variability of trends over time have emerged from the work by Casanueva et al. (2014). The above studies provided us the motivation to perform trend analyses covering various time frames to understand changes in precipitation extremes. In this study, a trend analysis using moving 30 yr periods is proposed that could serve as a supplementary method for long-term trend analysis. This shortterm trend analysis provides information on predominant trend directions and accounts for the variability and oscillatory behaviour of precipitation. Additionally, the method allows for the assessment of the temporal coherency of precipitation trends. The 30 yr interval was selected based on World Meteorological Organization standards. This study aims to evaluate the spatial, seasonal, and long-term variabilities in extreme precipitation trends in Europe, and to assess the temporal consistency in trend direction from December 1950 to February 2008. This study continues and expands on
methodologically similar analyses of Poland and Germany during 1951 to 2006 (Lupikasza 2010, Łupikasza et al. 2011). A continent-wide context for the regional variability of trends in extreme precipitation is, thus, provided. The results presented in this paper cover the long-term period defined by the project on precipitation extremes (NN 306 243939) funded by the National Research Centre of the Ministry of Science and Higher Education of Poland. The results obtained for the project time frame (December 1950 to February 2008) are based on > 350 meteorological stations. To update the data from 2008 to 2015, supplementary calculations were performed for >120 meteorological stations (126 stations for December-January-February [DJF], 127 stations for March-April-May [MAM] and September-October-November [SON], and 128 stations for June-July-August [JJA]) with available and complete series of daily precipitation, selected to be as evenly distributed throughout the continent as possible. The updated results for temporal changes in significant trend frequencies are presented in Fig. S1 in the Supplement (www.int-res.com/articles/suppl/c072 p217_supp.pdf).
2. MATERIALS AND METHODS 2.1. Data Extreme precipitation events during 1951 to 2008 were identified based on chronological daily precipitation records provided by the European Climate Assessment and Database (ECA&D), which was the primary source (Klein Tank et al. 2002, Klok & Klein Tank 2009; data and metadata available at www.ecad.eu), supplemented with data from e-klima (database no longer available; e-klima can be found at www.eklima.no/), CliWare (http://cliware.meteo. ru/meteo) and the website of the German weather service (www.dwd.de/). The Polish data were from the archive of the Institute of Meteorology and Water Management (IMGW) and include meteorological yearbooks and precipitation yearbooks. Data from after 28 September 1999 were taken from the OGIMET online weather database (www.ogimet.com) and used to verify and fill in minor gaps in the daily precipitation series. This database contains information on weather phenomena (current and past) and was useful in verifying doubtful daily precipitation totals. This study used rigorous completeness criteria to assess the data. The missing data did not exceed (1) 2 days per month, (2) 5% of days in the entire research period (December 1950 to February 2008), and (3) 2%
Łupikasza: Seasonal trends in extreme precipitation
of days in the reference period (1961 to 1990). When calculating seasonal series of indices, series that lacked > 2 annual values were omitted. Assessing the homogeneity of daily weather data is difficult because no reliable statistical method is available, particularly for precipitation. In this study, substantial effort was made to apply quality control to the data. Homogeneity of the ECA&D data was controlled for by using 4 homogeneity tests: the standard normal homogeneity test, the Buishand range test, the Pettitt test, and the von Neumann ratio test (Von Neumann 1941, Pettitt 1979, Buishand 1982, Alexandersson 1986, Klein Tank et al. 2002, Klok & Klein Tank 2009). The highest quality series (classified according to the test results as ‘useful’) were selected. Detailed information on the data homogenization procedures is available on the project website (www.ecad.eu). The days with daily precipitation outliers and extremes (Eqs. 1 and 2) were identified, and the precipitation amounts on these days were compared among different databases. The outliers and extremes were calculated according to the following formulas (Hill & Lewicki 2007):
221
where avg is the average daily precipitation total from days with precipitation ≥1 mm, and SE is the standard error. Most of the values were correct. However, the suspected precipitation totals were manually verified using synoptic charts (due to the possibility of a highprecipitation event), daily precipitation maps created using data from OGIMET (for data from 1999 only) or information from various academic books and papers (e.g. Arléry 1970, Escardó 1970, Johannessen 1970, Manley 1970, Furlan 1977, Lydolph 1977, Schüepp & Schirmer 1977, Kundzewicz 2005, Alfnes & Førland 2006). For example, the very high daily precipitation total of 520 mm recorded on 24 February 1964 at the Mont-Aigoual station proved to be true, whereas a 42 mm thunderstorm-related precipitation event recorded on 27 February 2004 at Lerwic station was incorrectly ‘homogenized’ to 5 mm in the ECA&D. In total, 363 stations in autumn and summer, 362 stations in spring, and 346 stations in winter met the completeness and homogeneity criteria (described above). These stations are shown in Fig. 2. The stations are not evenly distributed across the research area. However, due to the large spatial variability outlier > (avg + SE) + 1.5[(avg + SE) – (avg – SE)] (1) in precipitation, particularly extreme precipitation, extreme > (avg + SE) + 3[(avg + SE) – (avg – SE)] (2) every station with high-quality data delivers valuable information about changes in extreme precipitation characteristics. The densest set of stations covers Central Europe. Southern Europe, with its variable topography, is strongly underrepresented. The density of stations in Eastern Europe is also low, but due to this region’s more uniform landscape, the spatial variability of precipitation in this region is less than that in southern localities. Moreover, the stations in Eastern Europe are evenly distributed. The updated daily precipitation series are relatively evenly distributed in Western, Central, and most of Southern Europe (Fig. 2). Here, Western Europe refers to Great Britain, Ireland, the Netherlands, central and northern France, Luxembourg, Belgium, the western region of Germany, and Switzerland. Southern Europe refers to the Iberian Peninsula, southern France, the Italian Peninsula, the islands in the Mediterranean Sea, and the Balkan Peninsula, including Slovenia, Croatia, Bulgaria, Fig. 2. Study region and the network of stations used for trend detection and Romania. Central Europe refers to
Clim Res 72: 217–237, 2017
222
Eastern Germany, Poland, the Czech Republic, Slovakia, Austria, and Hungary. Northern Europe refers to Norway, Sweden, Finland and Iceland, and Eastern Europe was defined to cover the remaining areas beyond the eastern borders of Finland and Poland and the northern and eastern borders of Romania.
2.2. Criteria for identifying extreme precipitation events In the various climatic types of Europe, precipitation is characterized by large differences in the total, frequency, and annual peak timing. The scale of these differences between precipitation regimes influences daily precipitation extremes, and thus, they must be defined on a regional scale. One method to accomplish this is the use of Intergovernmental Panel on Climate Change (IPCC)-recommended percentile-based extreme precipitation indices (IPCC 2001, 2007), which are more useful than absolute values for regional spatial comparisons. This study defined extreme precipitation as a daily amount exceeding the 95th percentile (95p). The threshold value equivalent to 95p was calculated separately for each month and station using an empirical distribution of daily precipitation ≥1 mm for the standard period (1961 to 1990). Precipitation extremes thus defined do not always cause serious material loss, but their frequency is high enough to obtain reliable results from statistical analyses. The percentile-based indices are less suitable for direct assessment of the impacts, but may provide useful indirect information that is relevant to studying the impacts and adaptation. Trends in the days with precipitation exceeding 95p of the daily amount are relevant for assessing changes in the demands on drainage and sewage systems at different locations.
Using the 95p threshold values, 3 precipitation extreme indices were calculated: the days with extreme precipitation (95pNoD), the extreme precipitation total (95pT), and the average daily extreme precipitation amount (95pINT) (Table 1). These indices characterize the frequency, amount and intensity of extreme precipitation events. A seasonal approach was adopted using spring (MAM), summer (JJA), autumn (SON), and winter (DJF). The results obtained by this study based on a single criterion (i.e. the 95p) provide general information about the spatial variability in the trends of moderate and the highest precipitation extremes. Research on Poland and Germany suggests similarity in the spatial distributions of the extreme precipitation index trends based on various percentile thresholds (Łupikasza 2010, Łupikasza et al. 2011). Besselaar et al. (2013) also found that trends in the highest precipitation extremes were consistent with those in more common events identified using the descriptive indices of extremes that occur, on average, several times per year.
2.3. Trend estimation The trend magnitude was calculated using a linear regression of the least squares method and expressed as a percentage change during the 30 yr period relative to the mean value of the index for 1961 to 1990. The statistical significance of the trends was tested using the non-parametric Mann-Kendall method (Mann 1945, Kendall 1970), which is a robust, rank-based test that, unlike the conventional Student’s t-test, does not depend on the statistical distribution of the analysed parameter (Schmidli & Frei 2005). A combination of linear regression and the Mann-Kendall test is commonly used for extreme precipitation trend analysis (Brunetti et al. 2000,
Table 1. Definitions of extreme precipitation indices Symbol
Name
Definition
95pNoD
Count of very wet days
Number of days with RRij ≥ RRwn95, where: RRij is the daily precipitation amount on dayi in period j, RRwn95 is the 95th percentile of precipitation on wet days in the base period n (1961−1990)
95pTOT
Precipitation total due to very wet days
95pTOT = sum (RRwj), where RRwj >RRwn95, where: RRwj is the daily precipitation amount on a wet day w (RR >1 mm) in period j, RRwn95 is the 95th percentile of precipitation on wet days in the base period n (1961−1990)
95pINT
Simple daily intensity index: mean precipitation amount on a wet day
95pINT = sum (RRwj) / W, where: RRwj is the daily precipitation amount on wet day w (RR >1 mm) in period j, W is the number of wet days in period j
Łupikasza: Seasonal trends in extreme precipitation
Hundecha & Bárdossy 2005, Schmidli & Frei 2005, Norrant & Douguédroit 2006, Ramos & MartinezCasanovas 2006, Rodrigo & Trigo 2007, Pavan et al. 2008, Gajić->apka & Cindrić 2011, Karagiannidis et al. 2012, Jones et al. 2013) and was adopted in this manuscript. Using the most commonly applied methods of trend analysis allows for comparison of the results on continental and regional scales. The significance information from the Mann−Kendall test can be used interchangeably with the t-test in practical applications, as both methods generally deliver almost identical results (Önöz & Bayazit 2003, Soro et al. 2016). Weaker criteria of trend significance were applied because of the high variability in precipitation, particularly extreme precipitation (Rapp 2000, Hänsel 2009, Lupikasza 2010, Łupikasza et al. 2011). Three significance levels were considered: α = 0.2 (weakly significant trends), α = 0.1 (moderately significant trends), and α = 0.05 (significant trends). Extreme precipitation trends were calculated for each moving 30 yr period, producing 27 to 28 shortterm trends for each station (or 36 short-term trends for stations with updated series), depending on the season. This approach allowed for the assessment of the temporal consistency of trend directions and the long-term variability in the frequency of significant trends. Moreover, the results of the trend analysis are very sensitive to the beginning and end dates and do not generally reflect long-term climate trends (Hartmann et al. 2013). Therefore, the derived trend information is not strongly dependent on extreme high or low values at the beginning or end of the time series (Łupikasza et al. 2011). Short-term trend analysis provides information on the general direction of change while accounting for its fundamental feature of great variability and is a good complement to long-term analysis. The trends for every 30 yr period for 126 to 128 stations with updated data are included in Fig. S1. The long-term changes in the frequency of extreme precipitation trends were assessed using the stations with statistically significant trends in each of the 30 yr periods. These changes were expressed as percentages of all stations analysed in a season and in the 30 yr period. Additionally, for each 30 yr period, the field significance of extreme precipitation trends was tested using a global test based on the false discovery rate (FDR) method described by Wilks (2006). In this method, a network is declared significant if at least 1 local null hypothesis satisfies the bracket condition in Eq. (1). The parameter p(j) denotes the j th smallest of the p local values, and K is the number of local tests. The values of the local test were rejected when p(j) did not exceed the following:
p FDR = max ⎡⎣ p( j ) : p( j ) ≤ α global ( j / K )⎤⎦ j = 1,...,k
223
(3)
The critical value p for the significant field was calculated using αglobal = 0.2, which was the highest significance level for local precipitation trends adopted in this study. The FDR approach produces good results even when the local tests results are correlated with each other (Wilks 2006). The field significance was tested using all stations and separately for the groups of stations with positive and negative trends. The temporal consistency in the extreme precipitation trend direction was determined using the statistical significance and direction of the trends for all moving 30 yr periods. This parameter is expressed as a percentage of the 30 yr periods (T) during which these trends were statistically significant (α ≤ 0.2). The following criteria were used: (1) inconsistent trends: T < 25% or the frequencies of significant positive and negative trends were the same; (2) weakly consistent significant trends: 25% ≤ T < 50% and > 60% of significant trends had the same direction; (3) consistent significant trends: 50% ≤ T < 75% and > 60% of significant trends had the same direction; and (4) strongly consistent significant trends: T ≥ 75% and > 60% of significant trends had the same direction. Within the categories of weakly consistent, consistent, and strongly consistent trends, the stations with predominantly significant positive trends (i.e. positive trends constituted > 60% of the significant trends) were differentiated from those with a majority of significant negative trends (i.e. negative trends constituted > 60% of the significant trends) and from those with ‘neutral’ trends (the frequencies of both positive and negative trends were 40 to 60%). The inconsistent trends category also included stations with T > 25% and similar frequencies of significant positive and negative trends (i.e. between 40 and 60%).
3. RESULTS 3.1. General overview of extreme precipitation trends The frequencies of statistically significant trends in the seasonal indices of extreme precipitation are shown in Fig. 3. The frequencies were calculated as a ratio of the statistically significant 30 yr trends to the 30 yr trends. The latter were derived by multiplying the stations at which the given season’s data were available (i.e. 363 for MAM, 364 for JJA and SON, and 345 for DJF) by the moving 30 yr periods from December 1950 to February 2008 (i.e. 27 MAM, JJA,
Clim Res 72: 217–237, 2017
224
Fig. 3. Frequency of significant trends in extreme precipitation indices in the period December 1950 to February 2008. 95pNoD: number of days with extreme precipitation, 95pT: extreme precipitation totals, 95pINT: extreme precipitation intensity
SON, and 28 DJF). Depending on the season, there were 9660, 9801 or 9828 trends. These frequencies should be interpreted carefully given the temporal correlation between the overlapping 30 yr periods and the spatial correlation among the stations. Henceforth, UTr and DTr denote upward and downward trends, respectively. Most of the trends for the overlapping 30 yr periods were insignificant at the 0.2 significance level for all of the extreme precipitation indices. Depending on the season, significant trends constituted 20 to 25% of all 30 yr trends. The seasonal variability in their frequency was very low (i.e. ≤3%). In most seasons, except summer, UTr dominated the significant trends. The frequency of significant UTr was the greatest in winter (14 to 17%) and spring (13 to 18%;
Fig. 3). In summer, there were almost as many significant UTr as DTr (11 to 12%; Fig. 3). Compared with other seasons, summer had the fewest UTr and the most DTr among significant trends. For reference, linear trends were also calculated for the entire 1951 to 2008 period. The percentage of significant long-term term trends presented in Table 2 varies from 18% (14% U Tr + 4% DTr for 95pINT in JJA) to approximately 40% (33% U Tr + 8% DTr for 95pNoD and 33% U Tr + 9% DTr for 95pT in DJF), considering a 0.2 significance level. The disproportion between the long-term significant UTr and DTr was larger (e.g. 34% UTr and 4% DTr in the 95pNoD in MAM) than that detected for the short-term trends at every significance level. However, the seasonal patterns of changes were similar (Fig. 3, Table 2).
Table 2. Percent of stations with statistically significant long-term trends (1951−2008) in extreme precipitation indices. 95pT: extreme precipitation totals, 95pNoD: number of days with extreme precipitation; 95pINT: extreme precipitation intensity; MAM: spring; JJA: summer; SON: autumn; DJF: winter; UTr: upward trend; DTr: downward trend Significance level
MAM
95pT JJA SON
DJF
MAM
95pNoD JJA SON
DJF
MAM
95pINT JJA SON
DJF
UTr 0.2 0.1 0.05
31 21 13
14 8 4
26 14 10
33 25 18
34 23 15
13 9 4
25 14 8
33 25 18
19 11 7
14 7 3
20 12 7
19 12 7
DTr 0.05 0.1 0.2
1 2 5
1 3 5
1 2 4
3 5 8
1 2 4
2 4 6
1 1 5
3 5 9
2 4 5
1 2 4
2 4 6
2 4 7
Łupikasza: Seasonal trends in extreme precipitation
225
Fig. 4. Percentage of stations with significant seasonal trends in extreme precipitation indices for moving 30 yr periods within the period December 1951 to January 2007. 95pNoD: number of days with extreme precipitation, 95pT: extreme precipitation totals, 95pINT: extreme precipitation intensity
3.2. Long-term variability in the frequency of significant short-term extreme precipitation trends The percentage of stations with statistically significant seasonal trends in extreme precipitation for the 30 yr moving periods is shown in Fig. 4. Due to the uneven distribution of the stations, these figures reflect more accurately the changes in the trend frequencies in areas with the densest station coverage. For the se-
ries updated to 2015, see Fig. S1 in the Supplement. Pearson correlation coefficients were calculated between the updated series (126 to 128 stations) and the series created based on 346 to 363 stations for 1951 to 2007 (Table 3). All the correlations were statistically significant at α < 0.01, except for upward trends in extreme precipitation intensity in spring (MAM). In every season, the frequency of significant trends changed perceptibly during the study period (Fig. 4).
Clim Res 72: 217–237, 2017
226
Table 3. Correlation coefficients between percentage of stations with positive (UTr) and negative (DTr) trends in extreme precipitation indices calculated on the base of 366- stations and 127 stations. S: statistics, PC: Pearson correlation coefficient, p: statistical significance 95pNoD PC p
95pT PC
95pINT PC p
p
MAM UTr DTr
0.859 0.806
< 0.0001 < 0.0001
0.791 < 0.0001 0.723 < 0.0001
0.351 0.067 0.766 < 0.0001
JJA UTr DTr
0.888 0.774
< 0.0001 0.0001
0.885 < 0.0001 0.798 < 0.0001
0.775 < 0.0001 0.483 0.009
SON UTr DTr
0.612 0.583
0.001 0.001
0.568 0.451
0.671 < 0.0001 0.783 < 0.0001
DJF UTr DTr
0.910 0.851
< 0.0001 < 0.0001
0.002 0.016
0.927 < 0.0001 0.764 < 0.0001
0.770 < 0.0001 0.780 < 0.0001
The changes in the trend frequencies in all indices were similar over the long term, but the patterns varied seasonally. In most of the 30 yr periods and seasons, UTr were more frequently significant. However, significant 30 yr trends of either sign occurred at a maximum of 30% of the stations. A higher prevalence of UTr than DTr in most seasons was also found in the long-term trends, the frequency of which is included in Table 2. In this section, the first year of the reference period (e.g. 1955 to 2000) is the beginning year of the first 30 yr period (e.g. 1955 to 1984), and the last year is the ending year of the last 30 yr period (e.g. 1971 to 2000). In spring, significant UTr in the extreme precipitation indices were typically twice as common as DTr (Fig. 4). From 1951 to 1997, UTr occurred at 12 to 16% of stations on average, depending on the index. The percentage of the UTr peaked during 1973 to 2002 (Fig. 4). From the mid-1970s, the frequency of UTr dropped from > 25% to approximately 10 to 15%
of stations, depending on the index. The frequency of DTr rarely exceeded 10% of stations, with a maximum between 1957 and 1990 and a minimum between 1972 and 2002 (Fig. 4). In summer, the frequency of DTr was greater than in any other season and was similar to or greater than the UTr frequency for much of the study period. However, from 1967 onward, the percentage of stations with DTr gradually decreased. During the study period, the stations with UTr in the 95pNoD and 95pT increased from 5% in the second half of the 1950s to 18% of stations at the end of the research period. The smallest change was found in the frequency of the 95pINT UTr. In autumn, UTr occurred at 13 to 15% of stations on average, depending on the index. These numbers were much higher in the 30 yr periods between 1951 and 1985 and much lower between 1960 and 1994 (Fig. 4). A significant DTr of all indices occurred at 8% of stations on average. Between 1951 and 1984, DTr were particularly rare (approximately 4 to 6% of stations) and subsequently continued to oscillate near that frequency until the end of the period (Fig. 4). The frequency of winter UTr in the 95pNoD and 95pT increased markedly from 10% of stations in the 30 yr periods during 1951 to 1989 to 24 to 25% of stations between 1958 and 1993. No clear changes in the frequency of DTr (8-9% of stations) were found in the 30 yr periods between 1951 and 1990. In subsequent 30 yr periods, quite clear maxima occurred between 1965 and 1995, and minima occurred between 1969 and 2001. The field significance analysis revealed the most important changes in winter extreme precipitation. The percentage of 30 yr periods with at least 1 local null hypothesis satisfying the condition in Eq. (1), indicating significant fields of precipitation trends, is shown in Table 4. In winter, the fields of precipitation trends in the 95pNoD and 95pT were significant during 69 and 79% of the 30 yr periods, respectively, when considering all local tests; these values were even higher in the group of positive trends: 79 and
Table 4. Percentage of 30 yr periods with significant field trends in extreme precipitation calculated using the False Discovery Rate method (FDR). 95pT: extreme precipitation totals, 95pNoD: number of days with extreme precipitation, 95pINT: extreme precipitation intensity, MAM: spring, JJA: summer, SON: autumn, DJF: winter Seasons 95pNoD MAM JJA SON DJF
46 14 14 69
All stations 95pT 95pINT 36 4 21 79
11 14 18 28
Stations with positive trends 95pNoD 95pT 95pINT 57 21 32 79
50 14 54 86
11 7 25 41
Stations with negative trends 95pNoD 95pT 95pINT 11 4 14 14
21 4 4 10
21 14 4 28
Łupikasza: Seasonal trends in extreme precipitation
227
Table 5. Percent of stations with temporally consistent trends in extreme precipitation indices in Europe (December 1950 to February 2008). UTr: upward trends; DTr: downward trends; INCTr: inconsistent trends; T: percent of 30 yr periods with significant trends in extreme precipitation; 95pT: extreme precipitation totals; 95pNoD: number of days with extreme precipitation; 95pINT: extreme precipitation intensity; MAM: spring; JJA: summer; SON: autumn; DJF: winter
T ≥ 75%
UTr 50% ≤ T < 75%
25% ≤ T < 50%
INCTr 0% ≤ T < 25%
95pT MAM JJA SON DJF
0.8 0 0.5 0.9
6.6 4.4 5.0 8.1
22.9 12.7 23.4 19.7
58.9 64.7 59.0 61.4
8.3 13.8 9.1 9.0
2.5 4.1 3.0 0.9
0 0.3 0.3 0
95pNoD MAM JJA SON DJF
1.1 0.3 0.5 1.5
8.6 4.4 4.4 7.8
22.5 12.4 22.6 19.1
60.0 66.1 62.0 61.4
6.6 12.9 8.8 7.6
2.2 3.6 1.4 2.6
0 0.3 0.3 0
95pINT MAM JJA SON DJF
1.1 0 0.3 0.6
1.9 3.3 4.1 3.5
22.1 14.0 17.9 16.8
63.8 65.9 63.9 67.8
8.9 13.2 11.0 9.6
2.2 3.3 2.8 1.7
0.1 0.3 0 0
86% of the 30 yr periods, respectively. In the other seasons, the frequency of significant fields was much lower: 46% (95pNoD) and 36% (95pT) in spring and no more than 15% in other seasons. The significant fields of positive precipitation trends were much more frequent than those of negative trends (Table 4).
3.3. Temporal consistency of the significant trends in extreme precipitation indices The direction of statistically significant short-term trends varied, as demonstrated in Section 4.2. The predominance of short-term trends with the same direction is evidence of their temporal consistency. In contrast, when the amounts of significant short-term trends with opposite directions are similar or when statistically significant trends are rare, the consistency of the trend directions is weak. The temporal consistency of extreme precipitation trend directions is quantified in Table 5 and illustrated in Figs. 5 & 6. In this study, the term ‘coherent trends’ is used when discussing both consistent trends and strongly consistent trends. The term ‘consistent trends’ is used when all categories of trend consistency are discussed. When referring to a particular class of trend consistency, the term ‘category’ is added, or the full name of the class is used (e.g. weakly consistent trends).
DTr 25% ≤ T < 50% 50% ≤ T < 75% T ≥ 75%
The directions of statistically significant short-term trends in extreme precipitation indices were coherent at 5 to 12% of stations, depending on the season and index (Table 5). In most seasons except summer, the consistent UTr in the 95pNoD and 95pT were more than twice as frequent as the DTr. In summer, stations with consistent UTr and DTr had nearly equal frequencies (17 to 18% of stations). In spring, the trend directions were consistent at 36 to 41% of stations when evaluating all categories of trend consistency, whereas they were coherent at 5 to 12% of stations, depending on the index. Most of these trends were positive and occurred primarily in Western and Central Europe, reaching a latitude of approximately 44° N, and in many Northern European stations. UTr in the 95pNoD were also consistent in the southern area of Eastern Europe (Fig. 5). Weakly consistent DTr were found in all extreme precipitation indices in Southern Europe, particularly in the Iberian Peninsula and west of the Black Sea. In Eastern Europe, most trends were inconsistent, although in the case of the 95pNoD, UTr were predominant amongst the consistent trends (Fig. 5). In summer, consistent DTr, many of which were coherent, were primarily found in Central Europe, including Germany, Poland, and stations south of Poland and into the Balkan Peninsula (Table 5). Despite the predominance of DTr in Central Europe, many stations had a weakly consistent UTr. Coherent UTr in the 95pT and 95pNoD occurred on the south-
228
Clim Res 72: 217–237, 2017
Fig. 5. Temporal consistency of short-term trends in extreme precipitation indices for spring (MAM) and summer (JJA) in Europe in the period 1951 to 2007. Criteria for trends consistency/inconsistency are described in the ‘Methods’. 95pNoD: number of days with extreme precipitation, 95pT: extreme precipitation totals, 95pINT: extreme precipitation intensity
Łupikasza: Seasonal trends in extreme precipitation
229
Fig. 6. Temporal consistency of short-term trends in extreme precipitation indices for autumn (SON) and winter (DJF) in Europe in the period 1951 to 2007. See Fig. 5 for more details
230
Clim Res 72: 217–237, 2017
ern Scandinavian Peninsula and in the northwest area of Eastern Europe (Fig. 5). Elsewhere in Eastern Europe, both UTr and DTr occurred, but upward trends predominated in the 95pNoD and 95pT. In autumn, coherent decreases were observed primarily in a small region of Central Europe, and consistent decreases were detected at single stations in France, the Iberian Peninsula, the Balkan Peninsula, and the southern tip of Norway. In other areas of Europe (between France and the Balkan Peninsula, the southwestern tip of Norway and Eastern Europe), weakly coherent UTr, particularly in the 95pNoD and 95pT, prevailed. At certain stations (e.g. Northern Europe), despite weakly coherent increases in the 95pNoD and 95pT, the extreme precipitation intensities declined because of different rates of change in these characteristics at individual stations (Fig. 6). In winter, the spatial distribution of trend directions followed the clearest pattern of all the seasons: areas with consistent increases were clearly distinguished from areas with consistent decreases in extreme precipitation indices. UTr were predominant among the temporally coherent trends (Table 5) and were found in the eastern region of Western Europe between the eastern border of France and Poland, in north-central Europe, and Eastern Europe and the Scandinavian Peninsula. Consistent and weakly consistent DTr categories appeared in Southern Poland and extended south to the Balkan Peninsula, east to Ukraine, and between the Black and Caspian Seas. Over the Iberian Peninsula and in Southern France, the trends were weak and mostly downward. UTr were consistent in most of Eastern Europe, except in the southern region, where coherent DTr were found, particularly in the 95pNoD (Fig. 6).
3.4. Average magnitude of extreme precipitation trends The average trend magnitude was calculated for each station as an arithmetic mean of all 30 yr trends. The trend magnitude was then expressed as a percentage of the index value for the standard period (1961 to 1990). The average trend magnitude, which is a weighted trend magnitude, provides information on prevailing short-term extreme precipitation trends (direction and magnitude) during the research period, whereas the trend calculated during the entire period is more sensitive to the values at the end of the series and may change if the research period is extended or changed. As a result, the longterm trend direction may differ from the direction of
the average trend. The weighted magnitudes of trends for all stations are shown in Figs. 7 & 8. For magnitudes at stations with coherent trends, see Figs. S2 & S3 in the supplement. The directions of statistically insignificant trends that were included in analysis of the average trend magnitude fit the seasonal spatial distributions identified during the trend-coherency analysis (compare Fig. 5 with Fig. 7 and Fig. 6 with Fig. 8). In every season, the scale of change was the greatest in the 95pNoD. In spring, the magnitudes of the relative UTr in the 95pNoD and 95pT exceeded 25% in vast areas of Western, Central and Northern Europe and in the southern region of Eastern Europe (95pNoD). Within this area, strong UTr (> 50% of the average) were observed over the Scandinavian Peninsula, between the Frisian Islands and the Gulf of Finland, and between the Alps and the Great Hungarian Plain (Fig. 7). DTr with magnitudes > 25% were recorded in Southern Europe, in the Sudeten and Ore Mountains, and in western and northern areas of Eastern Europe (Fig. 7). The magnitudes of these DTr exceeded 50% only in the case of the 95pNoD in the Iberian Peninsula and at single stations in southern Poland and the eastern Mediterranean region. In summer, the UTr that occurred throughout the continent were mostly weak. Their relative magnitudes were ≤25% in Western Europe. Stronger trends (> 25%) were recorded primarily in Eastern Europe. The DTr were concentrated in the western part of the continent (to the 26° meridian [Fig. 7]), and their relative magnitudes exceeded 25% in Poland, Germany and Southern Europe. The most rapid decrease in the 95pNoD was observed in Southern Europe (Fig. 7). In autumn, the strongest UTr in the 95pNoD (with relative magnitudes > 50%) were detected south to the 52° parallel, particularly in southwest Eastern Europe (Fig. 8). The UTr in the 95pT followed a similar distribution pattern, but the magnitudes were lower. An increase in the 95pINT was even weaker. The strongest DTr in the 95pNoD of ≤25% were found in Central Europe and in the western region of Southern Europe (Fig. 8). In winter, the magnitudes of UTr were > 50% in Northern Europe, particularly on west-facing mountain slopes in the southwest Scandinavian Peninsula and between the Frisian Islands and the Gulf of Finland (Fig. 8). DTr with a relative magnitude > 50% were rare (5% of stations) and were only found in the 95pNoD. The strongest DTr of the 95pNoD were recorded in southern Poland and continued southward to the Balkan Peninsula (Fig. 8).
Łupikasza: Seasonal trends in extreme precipitation
231
Fig. 7. Average trend magnitudes in extreme precipitation indices for spring (MAM) and summer (JJA), using arithmetical average from 30 yr trend magnitudes within December 1951 to February 2008. Average trend magnitude is expressed as a percentage of average index value in the period 1961 to 1990. 95pNoD: number of days with extreme precipitation; 95pT: extreme precipitation totals; 95pINT: extreme precipitation intensity
232
Clim Res 72: 217–237, 2017
Fig. 8. Average trend magnitudes in extreme precipitation indices for autumn (SON) and winter (DJF). See Fig. 7 for more details
Łupikasza: Seasonal trends in extreme precipitation
4. DISCUSSION Short-term trends in extreme precipitation indices were investigated to establish their spatio-seasonal patterns in Europe based on data from 346–366 meteorological stations. The analysis was updated to 2015 for 126–127 select stations (depending on season) using available and good-quality daily precipitation data. An analysis of precipitation trends should not eliminate statistically insignificant trends. The research on the average magnitudes in this study included insignificant trends, and their directions fit the pattern that was determined using only the significant trends. In Europe, significant trends in extreme precipitation indices were very rare during the research period, and this may continue into the future because their frequencies did not change noticeably in consecutive 30 yr periods. Among rarely occurring significant trends, upward trends were predominant in all seasons except summer, and thus, an increase can be recognized as a noticeable feature in a long-term extreme precipitation course. Similar frequencies of significant UTr and DTr trends in summer are likely due to the enhanced prominence of local factors (more frequent free convection) that overlap with synoptic-scale circulation influences. However, the predominance of summer UTr at the end of the research period appears to be concordant with nearterm projections, which depict increases in both winter and summer precipitation over the mid-latitude regions (Hartmann et al. 2013). The prominent seasonality and strong regional variations detected in the pattern of long-term trend frequencies and their consistency are caused by the complicated impacts of both local (e.g. topography) and macro- and meso-scale (atmospheric circulation) factors that trigger precipitation formation and cause variability. The impact of synoptic circulation changes on precipitation trends varies among regions and months. The exact location of the strongest influence of synoptic circulation changes varies with the time of year (Fleig et al. 2015). Casanueva et al. (2014) link the seasonal behaviour of trends in extreme precipitation with various atmospheric teleconnection patterns: the Scandinavian and East Atlantic patterns and El Niño/Southern Oscillation events in spring and autumn and the Atlantic Multidecadal Oscillation during the entire year. However, one of the most prominent macroscale factors that impacts variability in European precipitation is the North Atlantic Oscillation (NAO) (Qian et al. 2000). Changes in the zonal air
233
flow associated with swings in the NAO index lead to changes in the transport of humidity and the occurrence of precipitation and its amount across Europe, including extreme precipitation. The relations are the strongest in winter (e.g. Zorita et al. 1992, Hurrell & Van Loon 1997, Dickson et al. 2000, Rodríguez-Puebla et al. 2001, Haylock & Goodess 2004, Trigo et al. 2004, Vicente-Serrano et al. 2009, Casanueva et al. 2014, de Lima et al. 2015). The highest order in the spatial distribution of temporally coherent trends and their magnitudes in winter can be linked to the NAO impact, which is strongest in winter. Hoy et al. (2014) and Fleig et al. (2015) also found a strong linkage between European precipitation and synoptic scale circulation described by Grosswetterlagen circulation types, particularly in the winter months. This finding is confirmed by the pattern of precipitation trends, with an increase of all extreme precipitation indices in the northern part of the continent and a decrease in the south. Modelling studies show that the UTr of extreme precipitation in winter are expected to continue in the future (Hartmann et al. 2013). Due to the larger sample of stations from central and western regions of the continent analysed in this study, it was possible to complement the results of Moberg et al. (2006) and conclude that significant trends in summer extreme precipitation were negative at stations in Central and Western Europe. Unlike earlier studies that suggested a change in the direction of long-term extreme precipitation trends in Southern Europe (Rodrigo & Trigo 2007, Beguería et al. 2011, Rodrigo 2010), temporally consistent DTr in spring extreme precipitation were found, primarily on the Iberian Peninsula. According to earlier studies (Piervitali et al. 1998, Brunetti et al. 2000, Pavan et al. 2008), the long-term autumn trends in Northern Italy were negative during 1951 to 2004, whereas this study revealed that most significant short-term trends were positive during this period. Differences were also noted in Croatia, where long-term trends were statistically non-significant (Gajić->apka & Cindrić 2011), whereas in this study UTr (SON) or DTr (JJA) were predominant among the short-term trends. The enormous scale of precipitation variability, which is linked to the modification of circulation factors by complex landforms in this area of Europe, likely explains these disagreements. The strong fluctuations in precipitation result in a lack of significant long-term trends. This effect is particularly strong in autumn and summer, when precipitation is often linked to free convection. The seasonal variability in the extreme precipitation trends is a consequence of the seasonality inher-
234
Clim Res 72: 217–237, 2017
ent in the processes of precipitation formation. Extremes in precipitation are also associated with the coincidence of particular weather patterns (e.g. Lavers et al. 2011). Currently, adequate understanding of what factors control the return time and persistence of such rare events is lacking (Hartmann et al. 2013). Understanding the effects of these mechanisms could be improved by finding patterns in the spatial distributions of trends or areas or groups of stations with consistent changes in extreme precipitation. Despite the spatial variability in the distribution of trends in each season, such areas can be identified. Their existence can reflect the linkage between long-term variability and changes in extreme precipitation and atmospheric circulation, the latter of which is a leading natural factor in climate variability. As mentioned above, the NAO plays an important role in climate variability over Europe and leaves a significant signature in precipitation. According to Qian et al. (2000), however, the NAO does not appear to be the most important signal of atmospheric variability in precipitation during seasons other than winter over the continent. In contrast, some studies suggested that the strength of the relationships between the NAO and the surface climate depends on the shift in sea-level pressure anomalies associated with this teleconnection pattern (Jung & Hilmer 2001, Jung et al. 2003, Beranová & Huth 2007, Vincente-Serrano et al. 2009). The location of the NAO pressure centres has also been reported to undergo secular changes (Ulbrich & Christoph 1999), and thus, the common assumption of a constant NAO spatial structure has several limitations in explaining the role of the NAO in climate variability (Jung et al. 2003, Beranová & Huth 2007). Further investigations should include shifts in the NAO configuration. Regional studies indicate that, in certain parts of Europe, extreme precipitation events are clearly related to local circulation types (Ustrnul & Czekierda 2001). Extreme precipitation intensity on daily and subdaily scales was found to be linked to an increase in the atmospheric water-holding capacity associated with a temperature increase under warmer climates (Betts & Harshvardhan 1987, Trenberth et al. 2003, Held & Soden 2006, Scherrer et al. 2016). The applicability of these relations to climate change is not straightforward but can shed light on the physical mechanisms that are important for extreme rainfall (Drobinski et al. 2016). The rate of increase in extreme daily precipitation associated with atmospheric warming may be 7% °C−1 globally, as determined from Clausius-Clapeyron relations (Allen &
Ingram 2002, Pall et al. 2007, Kharin et al. 2007). However, these relations are seasonal and not straightforward; regional specificities are apparently strong drivers (Berg et al. 2009), the most important of which is the dynamic contribution of orography (Drobinski et al. 2016). Berg et al. (2009) found that extreme daily precipitation intensity increases with the daily surface air temperature in winter, but decreases as the daily surface air temperature increases in summer. In summer, the availability of moisture — not the atmosphere’s capacity to hold this moisture — is the predominant factor at the daily timescale.
5. CONCLUSION This study of extreme precipitation in Europe revealed that significant trends in extreme precipitation constituted approximately 25–30% of all shortterm trends, and that this percentage did not change substantially in subsequent 30 yr periods. Furthermore, in the majority of the 30 yr periods, the frequency of UTr was clearly higher than that of DTr, except in summer. However, in some recent years, upward trends were also predominant in summer. Therefore, increases in the frequency and total were recognized as characteristic features of extreme precipitation changes in Europe, particularly in winter. This finding concerns stations with significant trends, and is supported by local trend analysis and field significance of precipitation extremes. To the best of the author’s knowledge, this study also documented for the first time that significant trend directions were temporally consistent at 6–13% of stations and perceivably consistent at 28–35% of stations, depending on the season and index. Furthermore, the UTr were more temporally coherent than the DTr. Clear seasonality was apparent in the spatial distribution of extreme precipitation trend coherency and magnitude. This seasonality — resulting from changes throughout the year in the strength of the impact of local and mesoscale factors on precipitation occurrence and totals — was characterized as follows: • Winter: The winter season showed the most consistent spatial distribution of trends. The UTr occurred in the northern area of the continent, whereas the DTr occurred in the southern area of the continent. • Summer: A seasonal peak in the frequency of DTr occurred mainly in Central and Western Europe, with the most coherent DTr in the central region of the continent. Less-frequent UTr were found in Eastern Europe, with the most coherent UTr in western
Łupikasza: Seasonal trends in extreme precipitation
and southern Eastern Europe and in most of the Iberian Peninsula except the southern region, where coherent DTr were predominant. • Spring: In most of the 30 yr periods, the frequencies of UTr in Central, Western and Northern Europe were twice as high as those of DTr in western Southern Europe and the central-European Sudeten and Ore mountain ranges. • Autumn: A clear majority of UTr occurred across the continent, despite the prevalence of coherent and strong DTr in Central Europe, Norway, and western Southern Europe. The strongest UTr were found in the northern region of Southern Europe. Climatological research on extreme precipitation trends can be a useful tool to verify the assessments of processes that lead to the formation of precipitation, and for forecasting it in the future. Further research could assess the input of every driving mechanism of precipitation into extreme precipitation variability and trends. Indirect assessment of the influence of human activity on precipitation by scaling precipitation vs. air temperature might also include atmospheric circulation as an explanatory variable (e.g. for various circulation patterns). Acknowledgements. This paper reports on a study carried out under the project ‘Effects of underlying processes and the spatial and temporal variability of extreme precipitation in Europe’ (NN 306 243939) funded by the National Research Centre, Ministry of Science and Higher Education of Poland. I acknowledge the data providers in the ECA&D project. The publication has been partially financed from the funds of the Leading National Research Centre (KNOW) received by the Centre for Polar Studies of the University of Silesia, Poland.
LITERATURE CITED Alexandersson H (1986) A homogeneity test applied to precipitation data. J Clim 6:661−675 Alfnes E, Førland EJ (2006) Trends in extreme precipitation and return values in Norway 1900–2004. Report 2/2006, Norwegian Meteorological Institute Allen MR, Ingram WJ (2002) Constraints on future changes in climate and the hydrological cycle. Nature 419:224−232 Arléry R (1970) The climate of France, Belgium The Netherlands and Luxembourg. In: Wallen CC (ed) Climates of Northern and Western Europe. World survey of climatology, Elsevier, Amsterdam 6:135–193 Bartholy J, Pongrácz R (2007) Regional analysis of extreme temperature and precipitation indices for the Carpathian Basin from 1946 to 2001. Global Planet Change 57:83−95 Beguería S, Angulo-Martínez M, Vicente-Serrano SM, López-Moreno JI, El-Kenawy A (2011) Assessing trends in extreme precipitation events intensity and magnitude using non-stationary peaks-over-threshold analysis: a case study in northeast Spain from 1930 to 2006. Int J Climatol 31:2102−2114
235
Beranová R, Huth R (2007) Time variations of the relationships between the North Atlantic Oscillation and European winter temperature and precipitation. Stud Geophys Geod 51:575−590 Berg P, Haerter JO, Thejll P, Piani C, Hagemann S, Christensen JH (2009) Seasonal characteristics of the relationship between daily precipitation intensity and surface temperature. J Geophys Res 114:D18102 Betts AK, Harshvardhan (1987) Thermodynamic constraint on the cloud liquid water feedback in climate models. J Geophys Res 92:8483−8485 Brunetti M, Buffoni L, Maugeri M, Nanni T (2000) Precipitation intensity trends in Northern Italy. Int J Climatol 20: 1017−1031 Buishand TA (1982) Some methods for testing the homogeneity of rainfall data. J Hydrol 58:11−27 Buishand TA, Martino GD, Spreeuw JN, Brandsma T (2013) Homogeneity of precipitation series in the Netherlands and their trends in the past century. Int J Climatol 33: 815−833 Burt TP, Ferranti EJS (2012) Changing patterns of heavy rainfall in upland areas: a case study from northern England. Int J Climatol 32:518−532 Burt TP, Horton BP (2007) Inter-decadal variability in daily rainfall at Durham (UK) since the 1850s. Int J Climatol 27:945−956 Casanueva A, Rodríguez-Puebla C, Frías MD, GonzálezReviriego N (2014) Variability of extreme precipitation over Europe and its relationships with teleconnection patterns. Hydrol Earth Syst Sci 18:709−725 de Lima MIP, Espírito Santo F, Ramos AM, Trigo RM (2015) Trends and correlations in annual extreme precipitation indices for mainland Portugal, 1941−2007. Theor Appl Climatol 119:55−75 Dickson RR, Osborn TJ, Hurrell JW, Meincke J and others (2000) The Arctic Ocean response to the North Atlantic Oscillation. J Clim 13:2671−2696 Drobinski P, Alonzo B, Bastin S, Da Silva N, Muller C (2016) Scaling of precipitation extremes with temperature in the French Mediterranean region: What explains the hook shape? J Geophys Res D 121:3010−3119 Easterling DR, Evans JL, Groisman PYa, Karl TR, Kunkel KE, Ambenje P (2000) Observed variability and trends in extreme climate events: a brief review. Bull Am Meteorol Soc 81:417−425 Escardó AL (1970) The climate of the Iberian Peninsula. In: Wallen CC (ed) Climates of Northern and Western Europe. World survey of climatology. Elsevier, Amsterdam 6:195–239 Fleig AK, Tallaksen LM, James P, Hisdal H, Stahl K (2015) Attribution of European precipitation and temperature trends to changes in synoptic circulation. Hydrol Earth Syst Sci 19:3093−3107 Frei C, Schär C (2001) Detection probability of trends in rare events: theory and application to heavy precipitation in the alpine region. Int J Climatol 14:1568−1584 Frei C, Davies HC, Gurtz J, Schär C (2000) Climate dynamics and extreme precipitation and flood events in Central Europe. Integrated Assess 1:281−299 Furlan D (1977) The climate of Southeast Europe. In: Wallen CC (ed) Climates of Central and Southern Europe. World survey of climatology. Elsevier, Amsterdam 6:185–235 Gajić->apka M, Cindrić K (2011) Secular trends in indices of precipitation extremes in Croatia, 1901−2008. Geofizika 28:293−312
236
Clim Res 72: 217–237, 2017
García JA, Gallego MC, Serrano A, Vaquero JM (2007) Trends in block-seasonal extreme rainfall over the Iberian Peninsula in the second half of the twentieth century. J Clim 20:113−130 Hänsel S (2009) Changes in Saxon precipitation characteristics. Trends of extreme precipitation and droughts. PhD dissertation, TU Bergakademie Freiberg, Cuvillier Verlag, Göttingen Hartmann DL, Klein Tank AMG, Rusticucci M, Alexander LV and others (2013) Observations: atmosphere and surface. In: Stocker TF, Qin D, Plattner GK, Tignor M and others (eds) Climate change 2013: the physical science basis. Contribution of Working Group I to the Fifth Assessment Report of the Intergovernmental Panel on Climate Change. Cambridge University Press, Cambridge, p 159−254 Haylock MR, Goodess CM (2004) Interannual variability of European extreme winter rainfall and links with mean large-scale circulation. Int J Climatol 24:759−776 Held IM, Soden BJ (2006) Robust responses of the hydrological cycle to global warming. J Clim 19:5686−5699 Hill T, Lewicki P (2007) Statistics: methods and applications. StatSoft, Tulsa, OK Hoy A, Schucknecht A, Sepp M, Matschullat J (2014) Largescale synoptic types and their impact on European precipitation. Theor Appl Climatol 116:19−35 Hundecha Y, Bárdossy A (2005) Trends in daily precipitation and temperature extremes across western Germany in the second half of the 20th century. Int J Climatol 25: 1189−1202 Hurrell JW, Van Loon H (1997) Decadal variations in climate associated with the North Atlantic Oscillation. Clim Change 36:301−326 IPCC (2001) Climate Change 2001: the scientific basis. Contribution of Working Group I to the Third Assessment Report of the Intergovernmental Panel on Climate Change. Cambridge University Press, Cambridge and New York, NY IPCC (2007) Climate Change 2007: the physical science basis. Contribution of Working Group I to the Fourth Assessment Report of the Intergovernmental Panel on Climate Change. Cambridge University Press, Cambridge Johannessen TW (1970) The climate of Scandinavia. In: Wallen CC (ed) Climates of Northern and Western Europe. World survey of climatology. Elsevier, Amsterdam 6:23–79 Jones MR, Fowler HJ, Kilsby CG, Blenkinsop S (2013) An assessment of changes in seasonal and annual extreme rainfall in the UK between 1961 and 2009. Int J Climatol 33:1178−1194 Jung T, Hilmer M (2001) The link between the North Atlantic oscillation and Arctic Sea ice export through Fram Strait. J Clim 14:3932−3943 Jung T, Hilmer M, Ruprecht E, Kleppek S, Gulev SK, Zolina O (2003) Characteristics of the recent eastward shift of interannual NAO variability. J Clim 16:3371−3382 Karagiannidis AF, Karacostas T, Maheras P, Makrogiannis T (2012) Climatological aspects of extreme precipitation in Europe, related to mid-latitude cyclonic systems. Theor Appl Climatol 107:165−174 Kendall MG (1970) Rank correlation methods, 4th edn. Griffin, London Kharin VV, Zwiers FW, Zhang X, Hegerl GC (2007) Changes in temperature and precipitation extremes in the IPCC ensemble of global coupled model simulations. J Clim 20:1419−1444
Klein Tank AMG, Wijngaard JB, Können GP, Böhm R and others (2002) Daily dataset of 20th-century surface air temperature and precipitation series for the European Climate Assessment. Int J Climatol 22:1441−1453 Klein Tank AMG, Können GP (2003) Trends in indices of daily temperature and precipitation extremes in Europe, 1946−99. J Clim 16:3665−3680 Klok EJ, Klein Tank AMG (2009) Updated and extended European dataset of daily climate observations. Int J Climatol 29:1182−1191 Kundzewicz ZW (2005) Intense precipitation and high river flows in Europe — observations and projections. Acta Geophysica Polonica 53(4):385–400 Kyselý J (2009) Trends in heavy precipitation in the Czech Republic over 1961−2005. Int J Climatol 29:1745−1758 Lavers DA, Allan RP, Wood EF, Villarini G, Brayshaw DJ, Wade AJ (2011) Winter floods in Britain are connected to atmospheric rivers. Geophys Res Lett 38:L23803 López-Moreno JI, Vicente-Serrano SM, Angulo-Martínez M, Beguería S (2010) Trends in daily precipitation on the northeastern Iberian Peninsula, 1955−2006. Int J Climatol 30:1026−1041 Lupikasza E (2010) Spatial and temporal variability of extreme precipitation in Poland in the period 1951−2006. Int J Climatol 30:991−1007 Łupikasza EB, Hänsel S, Matschullat J (2011) Regional and seasonal variability of extreme precipitation trends in southern Poland and central-eastern Germany 1951− 2006. Int J Climatol 31:2249−2271 Lydolph PE (1977) Climates of the Soviet Union. World survey of climatology, Vol 7. Elsevier, Amsterdam Manley G (1970) The climate of the British Isles. Wallen CC (ed) Climates of Northern and Western Europe. World survey of climatology, Elsevier, Amsterdam 6:81–133 Mann HB (1945) Nonparametric test against trends. Econometrica 13:245−259 Maraun D, Osborn TJ, Gillett NP (2008) United Kingdom daily precipitation intensity: improved early data, error estimates and an update from 2000 to 2006. Int J Climatol 28:833−842 Moberg A, Jones P (2005) Trends in indices for extremes in daily temperature and precipitation in Central and Western Europe, 1901−99. Int J Climatol 25:1149−1171 Moberg A, Jones PD, Lister D, Walther A and others (2006) Indices for daily temperature and precipitation extremes in Europe analyzed for the period 1901−2000. J Geophys Res 111:D22106 Norrant C, Douguédroit A (2006) Monthly and daily precipitation trends in the Mediterranean (1951–2000). Theor Appl Climatol 83:89−106 Önöz B, Bayazit M (2012) Block bootstrap for Mann–Kendall trend test of serially dependent data. Hydrol Process 26:3552–3560 Osborn TJ, Hulme M (2002) Evidence for trends in heavy rainfall events over the UK. Philos Trans R Soc Lond A 360:1313−1325 Osborn T, Hulme M, Jones PD, Basnett TA (2000) Observed trends in the daily intensity of United Kingdom precipitation. Int J Climatol 20:347−364 Pall P, Allen MR, Stone DA (2007) Testing the ClausiusClapeyron constraint on changes in extreme precipitation under CO2 warming. Clim Dyn 28:351−363 Pavan V, Tomozeiu R, Cacciamani C, Lorenzo MD (2008) Daily precipitation observations over Emilia-Romagna: mean values and extremes. Int J Climatol 28:2065−2079
Łupikasza: Seasonal trends in extreme precipitation
237
Pettitt AN (1979) A non-parametric approach to the changepoint problem. Appl Stat 28:126−135 Piervitali E, Colacino M, Conte M (1998) Rainfall over the central western Mediterranean basin in the period 1951−1995. I. Precipitation trends. Nuovo Cimento Soc Ital Fis, C, Geophys Space Phys 21:331−344 Qian B, Corte-Real J, Xu H (2000) Is the North Atlantic Oscillation the most important atmospheric pattern for precipitation in Europe? J Geophys Res 105:11901−11910 Ramos CM, Martinez-Casanovas JA (2006) Trends in precipitation concentration and extremes in the Mediterranean Penedés-Anoia Region, NE Spain. Clim Change 74: 457−474 Rapp J (2000) Konzeption, Problematik und Ergebnisse klimatologischer Trendanalysen für Europa und Deutschland. Berichte des Deutschen Wetterdienst 212, Offenbach Rodrigo FS (2010) Changes in the probability of extreme daily precipitation observed from 1951 to 2002 in the Iberian Peninsula. Int J Climatol 30:1512−1525 Rodrigo FS, Trigo RM (2007) Trends in daily rainfall in the Iberian Peninsula from 1951 to 2002. Int J Climatol 27: 513−529 Rodríguez-Puebla C, Encinas AH, Sáenz J (2001) Winter precipitation over the Iberian Peninsula and its relationship to circulation indices. Hydrol Earth Syst Sci 5:233−244 Scherrer SC, Fischer EM, Posselt R, Liniger MA, CrociMaspoli M, Knutti R (2016) Emerging trends in heavy precipitation and hot temperature extremes in Switzerland. J Geophys Res Atmos 121:2626–2637 Schmidli J, Frei C (2005) Trends of heavy precipitation and wet spells in Switzerland during the 20th century. Int J Climatol 25:753−771 Schüepp M, Schirmer (1977) Climates of Central Europe. In: Wallen CC (ed) Climates of Central and Southern Europe. World survey of climatology, Elsevier, Amsterdam 6:3–73 Soro GE, Noufé D, Bi TAG, Shorohou B (2016) Trend analysis for extreme rainfall at sub-daily and daily timescales
in Côte d’Ivoire. Climate 4:37 Trenberth KE, Dai A, Rasmussen RM, Parsons DB (2003) The changing character of precipitation. Bull Am Meteorol Soc 84:1205−1217 Trigo RM, Pozo-Vazquez D, Osborn TJ, Castro-Diez Y, Gamiz-Fortis S, Esteban-Parra MJ (2004) North Atlantic Oscillation influence on precipitation, river flow and water resources in the Iberian Peninsula. Int J Climatol 24:925−944 Ulbrich U, Christoph M (1999) A shift of the NAO and increasing storm track activity over Europe due to anthropogenic greenhouse gas forcing. Clim Dyn 15:551−559 Ustrnul Z, Czekierda D (2001) Circulation background of the atmospheric precipitation in Central Europe (based on the Polish example). Meteorol Z (Berlin) 10:103−111 van den Besselaar EJM, Klein Tank AMG, Buishand TA (2013) Trends in European precipitation extremes over 1951–2010. Int J Climatol 33:2682−2689 Vicente-Serrano S, Beguería S, López-Moreno J, El Kenawy A, Angulo M (2009) Daily atmospheric circulation events and extreme precipitation risk in Northeast Spain: the role of the North Atlantic Oscillation, Western Mediterranean Oscillation, and Mediterranean Oscillation. J Geophys Res D114:D08106 Von Neumann J (1941) Distribution of the ratio of the mean square successive difference to the variance. Ann Math Stat 12:367−395 Wilks DS (2006) On ‘field significance’ and false discovery rate. J Appl Meteorol Climatol 45:1181−1189 Willems P (2013) Multidecadal oscillatory behaviour of rainfall extremes in Europe. Clim Change 120: 931–944 Zolina O, Simmer C, Kapala A, Gulev S (2005) On the robustness of the estimates of centennial-scale variability in heavy precipitation from station data over Europe. Geophys Res Lett 32:L14707 Zorita E, Kharin V, von Storch H (1992) The atmospheric circulation and sea surface temperature in the North Atlantic area in winter: their interaction and relevance for Iberian precipitation. J Clim 5:1097−1108
Editorial responsibility: Gouyu Ren, Beijing, China
Submitted: May 2, 2016; Accepted: March 29, 2017 Proofs received from author(s): June 26, 2017