Journal of Marine Science and Technology, Vol. 18, No. 1, pp. 84-92 (2010)
84
SEASONAL SLOT ALLOCATION PLANNING FOR A CONTAINER LINER SHIPPING SERVICE Hua-An Lu*, Ching-Wu Chu*, and Pei-Yu Che** Key words: slot allocation, integer programming model, short sea service.
ABSTRACT This research addresses a slot allocation planning problem of the container shipping company for satisfying the estimated seasonal demands on a liner service. We explore in detail the influenced factors of planning and construct a quantitative model for the optimum allocation of the ship’s slot spaces. An integer programming model is formulated to maximize the potential profits per round trip voyage for a liner company, and a real life example of an eastern Asia short sea service has been studied. Analysis results reveal that containers with the higher contributions like reefers and 40 feet dry containers have priorities to be allocated more than others, but not all because of satisfying necessary operational constraints. Our model is not only providing a higher space utilization rate and more detailed allocation results, but also helpful for the ship size assessment in long-term planning.
I. INTRODUCTION Along with the emergence of the industrial globalization, liner shipping companies have adjusted their managing strategies for confronting the new supply chain reformation of shippers. The extension of service scopes and the flexibility of slot supplies provided liner carriers the opportunity to reshape their competitive positions. However, the essential aim of procuring potentially maximal revenues or profits was never changed. Through the effective slot management, liner shipping companies can avoid wasting the supply of ship’s capacities and increase the efficiency of container deliveries. This issue has been one of the most important practices to a liner carrier. Slot management can be separated into two topics: slot allocation planning for seasonal business targets and space
Paper submitted 01/30/08; accepted 02/25/09. Author for correspondence: Hua-An Lu (e-mail:
[email protected]). *Department of Shipping and Transportation Management, National Taiwan Ocean University,Keelung, Taiwan, R.O.C. **Intra Asia Export Consolidation Section, Sea freight Department, Kuehne + Nagel Ltd. Taiwan, R.O.C.
controlling for dynamic operations in each voyage. The main distinction between the two topics is in the planning horizon. No matter which one, the concrete decisions are to sufficiently allot the allowable capacities of the deployed ships to various kinds of containers with different potential revenues or profits. Furthermore, the perishable characteristics of slots in each voyage as well as the fluctuated market demands increase the necessity of planning in detail. Container is a crucial asset to the liner shipping company, because it generates revenue from loading cargoes and can be reused after emptying. Some studies have focused on the topics of container movement control and of container repositioning in either sea services or land transports. Gao [9] suggested to calculate the number of unbalance containers in export and import in advance, then to use the proposed allocation model for solving the optimal decision on the numbers of leasing, purchasing, storing, and allocating containers. Shen and Khoong [16] designed a decision support system (DSS) based on a network optimization model for planning empty containers distribution from the business aspects. Cheung and Chen [4] formulated the dynamic container allocation problem as a two-stage stochastic network model for assisting liner operators to reduce their leasing cost and inventory level at ports. Choong et al. [5] discussed empty container management for barge operations. Crainic et al. [7] presented dynamic and stochastic models for empty containers allocation in a land distribution and transportation system. Lopez [14] explored the organizational choice of ocean carriers to reposition empty containers in the territory of the USA. Jula et al. [11] studied the empty container movement problem in the Los Angles and Long Beach port area. The empty allocation problem is indeed complicated when we consider the whole network of supporting container loads, but it is merely a part of transported categories in the liner shipping. Moreover, maritime liner companies have to allocate slots not only for empty containers but also laden ones. A few studies have also treated slot resources distribution with the concept of revenue management or yield management adopted in other industries, such as the hotel [1, 13], railways [6, 19] and airlines in passenger [3, 2, 17, 8] and cargo [12] business. Maragos [15] discussed the suitable allocation number of slots for various categories of shipments on a two-port service in terms of the dynamic programming method. Ha [10]
H.-A. Lu et al.: Seasonal Slot Allocation Planning for a Container Liner Shipping Service
used the marginal expectation value and threshold curves to explore the slot allocation for multiple categories of consignments, and applied it to analyze an east bound voyage of a transpacific ocean service. Ting and Tzeng [18] stated the slot allocation problem of the liner service and proposed an integer programming model to obtain ideal allocated results for single directional traffic flows. This model can be conducted only on the case with the characteristics of the traffic pattern like an ocean-going service. Several studies have dealt with the issues relative to container management from different perspectives. However, the study exploring the overall slot allocation decision of the cyclical liner service is scant so far. The purpose of this research is to analyze relative factors of influencing seasonal slot allocation planning, and thereby to formulate a mathematical model for assigning slots to various types of containers required to transport for multiple port pairs on a liner service. A short sea service loop by courtesy of the studied company will be the analysis case for an application of this model. Furthermore, some efforts from post-analysis of varying crucial parameters are also presented.
II. PROBLEM DESCRIPTION Slot allocation defined in this paper is an internal operation of the shipping company to evaluate the utilization of ship capacities every period. Anticipated market information and operational properties of the service dominate the decision results of slot allocation. We introduce the practical planning procedure and contents of the studied company that can provide a comprehensive realization to the studied problem. 1. Influence Factors of Slot Allocation The factors affected slot allocation results mainly include potential profits of loading different types of containers on various markets, available capacities and deadweights of ships and possible contributions of repositioning empty containers. These factors will be explained in detail in this section. Shipping companies procure revenues through providing stowage slots of deployed ships to accommodate and to deliver various kinds of containers with different origin-destination ports (we refer to them below as port pairs). In a sufficient demand season, shipping companies can select containers with potential profits to increase their income as much as possible. In particular, a specific category on certain port pairs at a peak season will have a priority to obtain spaces for its higher freight rate, such as the reefer containers for exporting fruits at the fertile seasons. According to the level of service qualities and freight consigned properties, the company estimates the possible numbers of shipments in various markets to allocate ship capacities. It can adjust the allocation to meet the categories of containers situating the peaks. Various kinds of containers have their own market prices and traffic peaks, which are nothing to do with their types. Larger sizes of containers may have higher unit profit than the smaller ones, but they also
85
require more spaces for a unit. Twenty-foot equivalent unit (TEU) in length is the standard scale of containers. Other containers with forty or forty-five feet lengths occupy double spaces of one TEU, and some higher boxes or out-of-gauge cargos may even need more slots. In addition to the capacity limitation for the shipments on board, the sum of total loaded weights cannot exceed the maximal availabilities of the deployed ship, i.e. its net cargo deadweight tons. Sometimes, the allowable loaded weights of the ship will be reduced for the draft limitation, which may take place at the period of the falling tide. Furthermore, it is not so easy to acquire consigned weights for various types of containers precisely at the planning period. Liner companies can estimate the rough weights from the historical data or use 14 tons as the homogeneous weights for one TEU to arrange different sizes of containers. Besides gaining revenues from laden containers, the shipping companies use empty boxes as the crucial resources to support shipment loads. The trade gap among countries results in the unbalance of import and export traffics of laden containers, and this phenomenon also affects the available numbers of reused boxes. Some ports with a surplus of empty containers have to pay more costs to arrange their storages, but those places having a shortage of empty ones, on the contrary, need to lease the adequate numbers for export loads. These routine patterns will impact the level of profits if shipping companies do not proceed any repositioning of empty containers. However, it is difficult to evaluate the contribution of any repositioned container in competing with the laden one the slot resource simultaneously because containers circulate around all of carrying channels to be reused in the transport system. Although appropriate empty container repositioning can reduce expenditures and increase the profits just as laden ones earn revenues, the latter still has a priority to be loaded from the practical aspect. Finally, shipping companies must consider the transshipment containers which may relocate from or transfer to other services. In the peak season these kinds of containers may produce longer storage durations in ports with extra cost expenses, and even influence the reputation of the company. If the amount of transshipment can be estimated, it can be treated as the demand of general laden containers. 2. Rotated Services Liner services have the characteristics of fixed arrival and departure times in the fixed week days for every visiting port. Shipping companies must deploy multiple ships to support those services with more than one week of a round trip voyage to fulfill the mentioned operational requirement. Thus, each deployed liner executes a fixed and cyclical port rotation. From a seasonal planning perspective of slot allocation, the property of rotated service must be involved because the loaded containers may occupy the finite ship capacities more than one sailing leg. We have to track delivery passages of consignments for exactly calculating loaded situation for each stage.
Journal of Marine Science and Technology, Vol. 18, No. 1 (2010)
86
3-1 4-3
1-2
1-3
2-1 4-1 1-4
port 2
Line Scheduling Division
Operation Division
Cargo Division
Slot Allocation Division
Load Control Division
Container Division
Alliance Partners
Local Agents
4-3
port 1
port 2
Marketing Division
1-3 2-3 2-4
4-2 4-1 4-3
Fig. 2. Ideal business processes relating to the slot allocation division. 1-4 3-2
3-1
port 4
4-3
port 3 3-1 3-2 3-4 2-4 1-4
Table 1. A basic slot allocation table for a service of the studied company. Unit: TEUs
Fig. 1. Containers shipped on board for the illustrated example.
Original Country
Destination Country
Taiwan
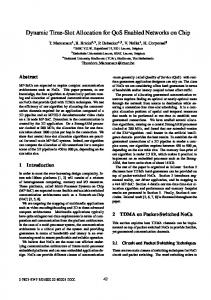
A liner can carry the consignments from all of port pairs on its served route. The shipping company prefers to arrange the carried path with the shortest transit time for market competition, but this path may still pass more sailing legs. This fact also means that some slots may have been occupied by those transit freights before loading containers up from a certain origin port. Intuitively, to achieve the maximal utilization of slot spaces, a liner should be fully loaded at every leg, but it is almost impossible to control shipments as expectation in practice. We illustrate a round trip voyage with a rotation 1-2-3-42-1 to depict the relationships between slot occupies and rotated service as shown in Fig. 1. This example has five sailing segments for five calls, and serves 12 port pairs because of visiting 4 different ports. Containers of multiple categories for each trade occupy the spaces of segments with their own shortest transit passages, i.e. containers on board in each leg may come from various port pairs. The decision of slot distribution must maintain the exact relationships between sailing legs and port pairs. 3. Practical Slot Allocation Planning Ideally, slot management has to collect much information from many departments for considering the trade-off of various markets and the physical limitation of operational services as shown in Fig. 2. Line scheduling division monitors whether the service keeps operating regularly or some adjustments must be made for a special situation. Marketing and cargo divisions provide the estimation of market trades and prices, while operation and load control sections offer the ship’s loading limitation on every sailing stage and cost levels of visiting ports. The container utilization and repositioning must refer to the deployment concept of the container division. In addition, slot allocation planning division needs to cope with the actual variation in each port from reports of their local agents, and
Japan Taiwan Hong Kong Sum
250
250
Hong Kong 245 80 325
Reserved slots for transshipment
Slot used
Thailand
To Thailand
occupied
100 110 240 450
50 100 120 270
0 395 360
Loaded up 645 290 360 1295
Total 645 685 720
Source: the studied company
passes back the decision of slot distribution. If this service operates under alliance cooperation, understanding the requirement of alliance partners in slot usage is necessary. The studied company made a seasonal allocation plan depending on planners’ experience and information from local agents. Besides considering the marginal contribution of outbound cargos, this company estimated the possible carrying demands according to their sensitivity to the market. A basic slot allocation table (BSA table) made with the country basis shows respective quotas of local agents for their freight solicitation. Table 1 displays an example of the BSA table for the south bound slot allocation of a short sea service. For giving local salesmen more flexibility in selection of various container categories, the headquarters plans an entire quantity for each local agent. These planning results ignore the above mentioned factors regarding the slot allocation evidently, so not only the slots can not be used sufficiently but also the maximum profit of the studied company may also be influenced.
III. MODEL FORMULATION Two important issues must be addressed before we introduce our mathematical model. The first one is the relationships between the carrying demands of port pairs and sailing legs, and the next one is the contribution of empty containers. We will submit the concept for both issues respectively, and then present our mathematical model comprehensively.
H.-A. Lu et al.: Seasonal Slot Allocation Planning for a Container Liner Shipping Service
87
Table 2. The illustrated example of relationships between port pairs and legs ( α ods ). Port pairs (o, d) (1, 2) (1, 3) (1, 4) (2, 1) (2, 3) (2, 4)
1-2 1 1 1 0 0 0
2-3 0 1 1 0 1 1
Sailing legs (s) 3-4 4-2 0 0 0 0 1 0 0 0 0 0 1 0
2-1 0 0 0 1 0 0
Port pairs (o, d) (3, 1) (3, 2) (3, 4) (4, 1) (4, 2) (4, 3)
1-2 0 0 0 0 0 1
2-3 0 0 0 0 0 1
Sailing legs (s) 3-4 1 1 1 0 0 0
4-2 1 1 0 1 1 1
2-1 1 0 0 1 0 1
1. Relationships between Port Pairs and Sailing Legs
3. Slot Allocation Model
The core concept of slot allocation is that shipped containers from various port pairs will occupy the spaces of passage legs, while each sailing leg only has the fixed capacity. The carried passages of containers from every port pair can be acquired a priori from the liner company. Normally, the path is the shortest one with minimal transit time. We illustrate the example in last section, which is a round trip voyage of five calls for 4 ports with rotation 1-2-3-4-2-1. It includes 12 port s , are shown pairs and 5 sailing legs, and their incident values, α od
The purpose of managing slot spaces for the carrier is to maximize the profits created from the available capacities. Moreover, the detail of distribution has to follow the basic characteristics of shipment carriage and the market values of slots. We assume that the carrier has sufficiently realized the related market information and the demand level for each category of containers on all of served port pairs, i.e. the given demand level is enough to reflect the market situation faced by the carrier. Before introducing our model, we adopt the following notation:
s in Table 2. α od , an incident parameter of port pair and sailing leg, is used to represent whether the carriage from port pair (o, d) passes the sailing leg s or not, 1 stands for yes, and 0 for otherwise. These relationships can be identified with Fig. 1.
2. Contribution of Empty Containers Container depots of the shipping company have to provide shippers empty boxes for loading shipments. Import containers can be reused after emptying contents to support the requirement of inland depots. In the areas of the export stronger than the import, the company can move in empty boxes from other ports with the surplus, otherwise the company has to spend extra expenditure for rents. In this circulation of laden and empty processes, the liner company exploits own ships to reposition excess empty containers as many as possible for saving additional costs and satisfying business requirements. However, it is always difficult to meet the requirement of markets completely. For easily calculating the contribution of empty containers, we exploit the extraordinary rents in the required positioning-in ports as the prices of empty containers moving into these ports. Ports always lacking of empty containers usually have more outbound demands than inbound deliveries. If the shipping company cannot move boxes into these ports from the seaborne repositioning, it must commence to rent the number of lacking containers from the local renter. On the contrary, the cost expenditure of renting empty containers can be saved when the repositioning activities are able to be well executed. The saved costs can be considered as the opportunity revenues. Actually, these named opportunity revenues should be considered as the expenditure savings of the container department.
Sets E H R Ak Lk
Set of category indexes for empty containers. Set of category indexes for laden containers. Set of category indexes for laden reefer containers. Set of positioning-out ports for empty containers of category k, k ∈ E. Set of positioning-in ports for empty containers of category k, k ∈ E.
Decision variables k xod The number of allocated slots for category k containers of port pair (o, d).
Parameters k pod Estimated average unit price or contribution for containers of category k delivered from port o to port d. k cod Estimated average unit variable cost for containers of category k delivered from port o to port d. s α od An incident parameter to represent if the container delivery passage of port pair (o, d) passes leg s, 1 for yes, 0 otherwise. tk Capacities occupied in TEU per container of category k. k wod Average weights in ton per container of category k carried for port pair (o, d). lodk Estimated lower bound of carried containers of category k delivered from port o to port d. k u od Estimated upper bound of carried containers of cate-
Journal of Marine Science and Technology, Vol. 18, No. 1 (2010)
88
gory k delivered from port o to port d. Maximal number of empty containers of category k that can be repositioned out from port o. k md Maximal number of empty containers of category k that requires to be repositioned into port d. U Capacities in TEU of the deployed ship. Z Number of plugs on board for laden reefer containers. DWTs Maximum available deadweights in ton on leg s. It may be decreased for the draft limitation of the departure or arrival ports of the leg s. n ok
The mathematical model aims to procure maximum profits per round trip voyage under satisfying capacity, weight, and demand constraints. It is formulated as follows.
∑ ∑ (p
k od
Max.
k
k k − cod ) xod
(1)
(o,d )
s.t.
∑ ∑
k ∈H
∀s
(2)
(o,d )
∑ ∑
k ∈H
k α ods t k xod ≤U
k k α ods wod xod ≤ DWTs
∀s
(3)
(o,d )
IV. MODEL APPLICATION
∑ ∑
k ∈R
maximum number of empty containers that can be repositioned out from port o and repositioned into port d, respectively. Equation (8) is the nonnegative and integer constraint of variables. This model is an integer programming (IP) problem. The number of variables is the product of the number of container categories and the number of port pairs. If the considered route with S legs visits N various ports, there are N × (N – 1) port pairs of shipments at most. While K categories of containers are involved, this problem will have K × N × (N – 1) variables. Meanwhile, the number of constraints is 3S + K × N at most except the upper and lower bounds of variables. As we know, the length of a route has around 20 legs and 15 various ports at most in the studied company. The categories of containers are also finite. Thus, we estimate the number of variables is around 1000, and the number of constraints is less than 200 for the practical cases. This scale of the IP problem can be solved by the traditional algorithm, such as the branch-andbound method, to obtain optimal results. If the scale of an instance is too large to solve in a reasonable time, we suggest rounding off the LP relaxation solution by cutting down the fraction. This method can obtain a feasible solution because all of constraints are less than or equal to the right hand side, except the lower bounds for variables.
∀(o, d ), k ∈ H
(5)
We apply our formulation to a short sea service of the studied shipping company. The related data by courtesy of this company was keyed into the problem generator programmed with the Microsoft Visual C++ 6.0 and solved by the commercial optimization package CPLEX 9.0.
∀ k ∈ E, o ∈ A k
(6)
1. Background of the Analysis Case
k α ods xod ≤Z
∀s
(4)
( o, d )
k k k lod ≤ xod ≤ uod
∑
k xod ≤ nok
∑
k xod ≤ mdk
d ∈L k
∀k ∈ E, d ∈ Lk
(7)
o∈A k
k xod ≥ 0 and integer
∀(o, d ), k
(8)
The objective function of (1) maximizes the sum of the estimated profits from various trades and container categories. Besides the revenue level, only the variable costs related to the container handling are considered. Equation (2) enforces the sum of containers on board cannot be over the maximum capacity, as well as (3) restricts the loaded weights on each sailing leg. Laden reefer containers need electronic power to keep suitable temperature on the way, but the number of power plugs installed on board is limited. This constraint is expressed in (4). Equation (5) indicates the lower and upper bounds of allocated slots for laden containers of various categories and port pairs. Equations (6) and (7) ensure that possible carriage of empty containers cannot exceed the
The test route JTC serves 12 ports among Japan, Taiwan, Hong Kong, and Thailand with 16 sailing legs, and its port rotation is: Tokyo (TYO) – Yokohama (YOK) – Nagoya (NGO) – Osaka (OSA) – Kobe (UKB) – Oita (OIT) – Keelung (KEL) – Kaohsiung (KHH) – Hong Kong (HKG) – Laem Chabang (LCB) – Bangkok (BKK) – Laem Chabang – Hong Kong – Kaohsiung – Taichung (TXG) – Keelung – Tokyo. This loop can be divided into south and north bounds from the naturally geographical directions (see Fig. 3). This service with a cycle time of 28 days is deployed 4 full-container vessels with 1445 TEUs of nominal capacities for weekly service, but the real planed capacity in the studied company is 1100 TEUs without considering the weight limitation. The maximum available deadweight of this kind of fleet is 15400 tons, and the number of reefer plugs is 100 for each ship. Besides the general types of containers, the studied company also accepted few of 20 feet open top, flat rack, and tank containers. For the sake of simplicity, we combine these out-of-gauge containers into the category of special containers. The weights of loaded cargo in each type of containers are all different, so we use the average value for each involved
H.-A. Lu et al.: Seasonal Slot Allocation Planning for a Container Liner Shipping Service
89
Table 3. Data of weight and volume for all categories of containers. Category code Container type Weight (ton) Volume (TEU) Source: the studied company
20’ D 20’ dry 17 1
40’ D 40’ dry 23 2
20’ R 20’ reefer 17 1
40’ R 40’ reefer 23 2
20’ E 20’ empty 2 1
40’ E 40’ empty 4 2
40’ HQ 20’ S 40’ higher cube 20’ special 23 17 2.25 1
Table 4. Slot occupied results for all sailing legs. Legs
Occupied status Number of boxes Total TEUs Cargo weights
1 2 3 4 TYO ~ YOK YOK ~ NGO NGO ~ OSA OSA ~ UKB 708 784 781 837 1066 1241 1256 1374 11042 12934 12943 14189
Number of boxes Total TEUs Cargo weights
7 8 KEL ~ KHH KHH ~ HKG 539 742 973 1254 11539 15392
9 10 11 12 13 14 15 HKG ~ LCB LCB ~ BKK BKK ~ LCB LCB ~ HKG HKG ~ KHH KHH ~ TXG TXG ~ KEL 765 581 329 744 815 693 749 1206 894 522 1174 1178 1015 1109 15399 11575 6751 15216 13021 13671 14845
TYO YOK UKB OIT
Hong Kong HKG
TXG
NGO OSA
Japan
Taiwan KEL KHH
LCB
6 OIT ~ KEL 884 1445 15397
Legs
Occupied status
BKK
5 UKB ~ OIT 874 1435 14932
South bound
16 KEL ~ TYO 763 1159 15257
clusive equipments in handling. Deliveries of laden containers are not allowable among intra-country port pairs in Japan and Thailand due to the limitation of the cabotage right, but empty containers are excluded. In addition, port of Kaohsiung is a loading and repositioning center of the studied company. Thus, excess empty containers on the line are delivered to this port as many as possible.
North bound
2. Solved Results and Discussion
North & South bound
This problem has 1056 variables and 69 constraints, and it takes only 8.4 CPU seconds to solve this problem. The objective value is USD 1 219 986. We first display the total loading status on each sailing leg as shown in Table 4. Some stages have almost reach the limitation on weights (15400 tons) and/or volumes (1445 TEUs), such as legs 6, 8, and 9. With reference to the slot distribution between port pairs, we summarize the allocated results for various countries as displayed in Table 5. In comparison with the original plan of the studied company, there are slightly differences in the allocated slots between countries. However, our model provides a higher space utilization rate and more detailed allocation results for various container categories. This company may reduce some spaces distributed to the trade from Japan to Hong Kong for shifting more spaces to the markets between Japan to Taiwan and Thailand in the south bound carriage. Since spaces in the north bound are not totally occupied, the company can push agents to promote more capacities on this direction. Based on the comprehensive allocated results, the company can understand the optimal picture of loaded mix on each port under its expected demand level. The carrier can also provide the allocated quotas as in Table 5 for its local
Thailand Fig. 3. Port rotation of the JTC service of the studied company.
category provided by the studied company. A container with higher cubic volume is counted as 2.25 TEUs because this kind of containers normally occupies over one slot. Table 3 shows the involved categories and their data on weights and volumes. Real prices and costs are confidential for the company. We used the public freights in April 2004, which was also the peak of that year. As for the cost contents, we made some assumptions based on the suggestion of the studied company, such as the unit handling costs of 40 feet dry and higher cube containers are 1.5 times of that of the 20 feet dry containers. The cost per empty container is 50% of that of the 20 feet dry because empty boxes have no insurance, commission, and weighting fees. Although the cost of the reefer is slightly more than that of the dry container, we assume their costs are the same. But the cost of the special container is 50 dollars more than that of the dry container for the requirement of the ex-
Journal of Marine Science and Technology, Vol. 18, No. 1 (2010)
90
Table 5. Slot allocation results in TEU between countries. Unit: TEUs Loading country
Unloading country Hong Kong Taiwan 238.25 685.5 183 305.75
Type of containers
Thailand Laden 332.25 Japan Empty Laden 377.75 Taiwan Empty Laden 496 Hong Kong Empty Laden 497 Thailand Empty Remark: The fractions of allocated slots for laden containers are due to the 40 feet higher cubic ones.
Japan 27 776
107 200 481.25
243.25 211
Table 6. Allocated status against demand bounds for laden containers. Container category Number of allocated port pairs Number and ratio of allocating to the lower bound Number and ratio of allocating to the upper bound Number and ratio of allocating between the lower and upper bounds
20’ D
40’ D
20’ R
40’ R
40’ HQ
20’ S
53 47 (88.7%) 5 (9.4%) 1 (1.9%)
76 14 (18.4%) 59 (77.6%) 3 (3.9%)
8 1 (12.5%) 7 (87.5%) 0 (0%)
25 2 (8%) 23 (92.0%) 0 (0%)
34 13 (38.2%) 21 (61.8%) 0 (0%)
13 0 (0%) 0 (0%) 13 (100%)
agents as the original idea of keeping flexibilities, but it is obvious that the planned results are more precise than its current method. The competition results of slot allocation between various categories reveal the level of satisfaction against the carrying demands. According to the known lower and upper bounds of the carrying demands predicted from the carrier, the model can solve the detailed slot allocation. The satisfying level of allocated results against to the demand bounds of port pairs for each container category, as shown in Table 6, can be used to assess the utilization of ship capacities. Reefer containers including 20 and 40 feet own the higher ratios, more than 85% of port pairs (87.5% and 92.0% respectively), reaching the upper bounds. Also, 40 feet dry and higher cube containers have ratios over 60% (77.6% and 61.8% respectively) to satisfy their upper bounds. On the contrary, the majority of port pairs (88.7%) just satisfy the least requirements of 20 feet dry containers which provide a lower unit contribution than that of the former categories on the same market. A few percents of dry containers and all of 20 feet special containers are allotted the slots within the interval of their upper and lower bounds. These results reflect that the containers with higher unit contribution have priorities to be allocated spaces as more as possible but not all. The operational constraints from rotated services indeed affect the slot allocation results. Furthermore, analyzed results in Table 6 also implies that the optimal solution can not be obtained just with distributing slots to the
container categories of the higher unit profit sequentially. Otherwise, the allocated slots of the categories with higher unit profit like 40 feet reefer and higher cube containers are supposed to be entirely allocated with their upper bounds of demands on all of markets. Therefore, we conclude that the slot allocation is dominated not only by the carried demands and unit contribution of various categories of containers but also the port rotation of the service. Under the trade-off of these criteria, the optimal result can just be found. 3. Price Influence Analysis We focus on some sensitive parameters to conduct further analysis. This post analysis will assist the carrier to understand the influence in price increments of 20 feet dry containers and market changes on the contribution of empty containers.
1) Change of 20 Feet Dry Container Prices From Table 6, we can see that the allocation results of 20 feet dry containers reach the lower bounds with a higher percentage. The carrying demands of this type are strong on the markets, but the unit profit of 20 feet dry container cannot compete with that of other categories. Naturally, an interesting issue is raised to further analyze the influence for increasing the prices of this category. We add 50 dollars for every market per time to solve the slot allocation at other parameters remained the same as the original problem. As shown in Fig. 4,
H.-A. Lu et al.: Seasonal Slot Allocation Planning for a Container Liner Shipping Service
$2,000,000 $1,900,000 $1,800,000 $1,700,000 $1,600,000 $1,500,000 $1,400,000 $1,300,000 $1,200,000 $1,100,000
1892
1892
1846
1818
1,918,471
1892 1,823,311
1752
1,729,271
1645
1,634,420 1,541,830
1447
1,451,530 1,367,662
1233
1,289,530 1,219,986
0
allocated slots remain steady after the price increment reaching USD 60.
Slot Allocation for 20' Dry
50 100 150 200 250 300 350 400 Price Increment (USD)
2,000 1,900 1,800 1,700 1,600 1,500 1,400 1,300 1,200 1,100
Slot Allocation(TEU)
Objective (USD)
Objective
Fig. 4. Influences of 20’ dry container prices increased.
Objective
Profit from laden containers only
Allocated slots for empty containers
4 92 4 794 01 692 800 4 6 3278 4832 5354 1258 1264 12 6 26 3 2 0 2 2 1 8 4 1 1 2 6 6 10 28 33 123 12 98 $1,250,000 19 1224 12 12 12 700 $1,200,000 5 5 2 5 7 5 5 0 5 39 1374 3114 2879 2879 22 4425 4425 425 425 3925 25 1 600 $1,150,000 11 11 11 11 11 112 112 1124 1124 112 496 501
$1,050,000 410 $1,000,000
0
501
528 533
533
533 533 535 500
Allocated slots (TEU)
Profit (USD)
$1,300,000
$1,100,000
427 10
20 30 40 50 60 70 80 Price increment of empty containers
90
100
91
400
Fig. 5. Influences of empty container prices increased.
the objective value increases gradually with a range from 5.7% to 7.8% as the prices increased. The allocated slots also appear a growing tendency, but the ratio of increment is diminishing. The total slots allocated to this category remain for 1892 TEUs, which is 98.7% of the maximal available carrying amounts, at the price increment greater than USD 300. At the price increment reaching USD 400, the ratio of allocated slots out of the available maximum gains 34.3% than the amount keeping at the original price. 2) Change of the Empty Container Contribution Sometimes, there will be a shortage of empty containers in certain areas or ports for the strong requirement and thereby make an obvious variation of the leasing prices in local markets. We increase 10 dollars per time for the empty box prices of every category to solve the slot allocation under other parameters remained the same as the original problem. As shown in Fig. 5, the objective value increases gradually with a small range from 0.3% to 0.5% as the prices increased, but profit increments from laden containers decrease with a small amount and then level off until no more slots allocated to the empty boxes. We also find that there is an obvious jump of slot allocation to the empty container at prices being increased to 20 dollars. Another gain occurs at 50 dollars increment then
V. CONCLUSIONS AND SUGGESTIONS Based on the seasonal slot allocation planning, the shipping company decides the quotas for their local agents in consigning export cargos. It is so important to estimate the level of possible profits or revenues that the company might achieve, while there are many factors influencing the allocated results. A contribution of this research was to model this complex problem which can decide an optimal allocation outcome to meet the practical requirement on a line. Its planning results were even more detailed than that of the studied company. From the perspective of long-term planning, our formulation can also assist a carrier to assess if the size of the deployed ship satisfies the current level of carrying demand on a service. It will also be a fundamental to handle slot control decision in each voyage. From this research, some valuable observations in practice were found and summarized as follows. 1. The containers with a higher contribution have priorities to be allocated over others in the optimal solution, but the operational properties from rotated services mentioned section 2.2 will affect their percentages of satisfying the upper bounds. 2. If the prices of 20 feet dry containers are increased, the company should allocate more slots to this category to procure around 7% more profits. 3. The contribution of empty containers is not so significant than that of the laden containers, but the gain can not be neglected entirely. The fluctuation of carrying demands is a crucial issue relative to the slot management of liner companies. Future works can devote to involving the uncertain estimation into the slot allocation problem. In another issue of slot management for space controlling, shipping line behavior, such as the service quality of the shipping company and the power of the buyers, will significantly affect its policy for dynamic decision in each stage. The constraints of slot allocation are not restricted to cover those mentioned in this paper. Furthermore, alliances between liner carriers increase the complexities of slot management for many co-operative agreements. Different cases will provide researchers several valuably studied topics. Finally, the globalization network of the liner company also needs more supports of slot management analysis, especially the transshipment container routing problem.
ACKNOWLEDGMENT The authors would like to thank the National Science Council of R.O.C. for the financial support of this study under Contract NSC 96-2416-H-019-008.
92
Journal of Marine Science and Technology, Vol. 18, No. 1 (2010)
REFERENCES 1. Badinelli, R. D., “Optimal dynamic policy for hotel yield management,” European Journal of Operational Research, Vol. 121, No. 3, pp. 476-503 (2000). 2. Belobaba, P. P. and Farkas, A., “Yield management impacts on airline spill estimation,” Transportation Science, Vol. 32, No. 2, pp. 217-232 (1999). 3. Botimer, T. C., “Efficiency considerations in airline pricing and yield management,” Transportation Research, Part A: Policy and Practice, Vol. 30, No. 4, pp. 307-317 (1996). 4. Cheung, R. K. and Chen, C. Y., “A two-stage stochastic network model and solution methods for the dynamic empty container allocation problem,” Transportation Science, Vol. 32, No. 2, pp. 142-162 (1998). 5. Choong, S. T., Cole, M. H., and Kutanoglu, E., “Empty container management for intermodal transportation networks,” Transportation Research Part E, Vol. 38, pp. 423-438 (2002). 6. Ciancimino, A., Inzerillo, G., Lucidi, S., and Palagi, L., “Mathematical programming approach for the solution of the railway yield management problem,” Transportation Science, Vol. 33, No. 2, pp. 168-181 (1999). 7. Crainic, T. G., Gendreau, M., and Dejax, P., “Dynamic and stochastic models for the allocation of empty containers,” Operations Research, Vol. 41, pp. 102-126 (1993). 8. Feng, Y. and Xiao, B., “Optimal policies of yield management with multiple predetermined prices,” Operations Research, Vol. 48, No. 2, pp. 332-343 (2000). 9. Gao, Q., “An operational approach for container control in liner shipping,” Logistics and Transportation Review, Vol. 30, No. 3, pp. 267-282 (1994).
10. Ha, D. W., Capacity Management in the Container Shipping Industry: The Application of Yield Management Techniques, Ph.D. Dissertation of the University of Tennessee (1994). 11. Jula, H., Chassiakos, A., and Ioannou, P., “Port dynamic empty container reuse,” Transportation Research Part E, Vol. 42, pp. 43-60 (2006). 12. Kasilingam, R. G., “Air cargo revenue management: Characteristics and complexities,” European Journal of Operational Research, Vol. 96, No. 1, pp. 36-44 (1997). 13. Koide, T. and Ishii, H., “The hotel yield management with two types of room prices, overbooking and cancellations,” International Journal of Production Economics, Vol. 93-94, pp. 417-428 (2005). 14. Lopez, E., “How do ocean carriers organize the empty containers reposition activity in the USA?” Maritime Policy and Management, Vol. 30, No. 4, pp. 339-355 (2003). 15. Maragos, S. A., Yield Management for the Maritime Industry (Shipping, Itineraries), Ph.D. Dissertation, Massachusetts Institute of Technology (1994). 16. Shen, W. S. and Khoong, C. M., “A DSS for empty container distribution planning,” Decision Support Systems, Vol. 15, pp. 75-82 (1995). 17. Subramanian, J., Stidham, S. J., and Lautenbacher, C. J., “Airline yield management with overbooking, cancellations, and no-shows,” Transportation Science, Vol. 33, No. 2, pp. 147-167 (1999). 18. Ting, S. C. and Tzeng, G. H., “An optimal containership slot allocation for liner shipping revenue management,” Maritime Policy and Management, Vol. 31, No. 3, pp. 199-211 (2004). 19. Whelan, G. and Johnson, D., “Modelling the impact of alternative fare structures on train overcrowding,” International Journal of Transport Management, Vol. 2, No. 1, pp. 39-46 (2004).