Oct 20, 1999 - provided by the General Register Office for Scotland. Maximum ... mortality are a significant public health problem in Scotland. It is likely that the.
© International Epidemiological Association 2000
International Journal of Epidemiology 2000;29:274–279
Printed in Great Britain
Seasonal variation in mortality in Scotland Islay Gemmell,a Philip McLoone,a FA Boddy,a Gordon J Dickinsonb and GCM Wattc
Background Seasonal patterns in mortality have been recognized for many years. This study assesses seasonal variation in mortality in Scotland between 1981 and 1993 and considers its association with socioeconomic status and outdoor temperature. Methods
Lagged Poisson regression analysis of numbers of deaths and average weekly temperature with adjustment for serial autocorrelation and influenza epidemics.
Results
There was significant seasonal variation in weekly death rates with a difference of about 30% between a summer trough and a winter peak. This variation was principally attributable to respiratory disease, cerebrovascular disease and coronary artery disease. Seasonal variation in mortality fell from around 38% in 1981– 1983 to around 26% in 1991–1993. There was no clear evidence of a relationship between socioeconomic status and seasonal mortality, however the extent of the fall in seasonal variation was greater in deprived areas than in affluent areas. Overall, a 1°C decrease in mean temperature was associated with a 1% increase in deaths one week later. The lag in this relationship varied by cause of death and underlying temperature.
Conclusions Seasonal variations in mortality and the relationship between temperature and mortality are a significant public health problem in Scotland. It is likely that the strength of this relationship is a result of the population being unable to protect themselves adequately from the effects of temperature rather than the effects of temperature itself. Keywords
Seasonal, mortality, temperature, deprivation
Accepted
20 October 1999
An increase in deaths during winter was reported as early as 1847 when Farr1 described the diagnostic composition of the excess deaths occurring in that year. More recent studies2,3 have demonstrated a 30% difference in the UK death rate between summer and winter; this difference is greater than that of European countries on similar latitudes,4 but has been declining since the 1950s.5,6 In the Netherlands, the seasonal percentage change is now about 22%.7 Similar differences in seasonal mortality have been observed in regions as diverse as Israel,8 New Zealand,9 Bangladesh,10 Hawaii11 and Moscow.12 Few studies use the same method to estimate seasonal patterns in mortality however it is possible to compare the results using simple adjustments. Although influenza epidemics contribute to seasonal patterns,13,14 the effect is more general with variation in other respiratory causes of death, ischaemic heart disease and a Public Health Research Unit, 1 Lilybank Gardens, University of Glasgow,
Glasgow, UK. b Department of Geography and Topographic Science, East Quadrangle,
University of Glasgow, Glasgow, UK. c Department of General Practice, 4 Lancaster Crescent, University of Glasgow,
Glasgow, UK. Reprint requests to: Islay Gemmell, MRC Social and Public Health Sciences Unit, 4 Lilybank Gardens, Glasgow G12 8RZ, UK.
cerebrovascular disease.7,3 Winter weather conditions and snow falls have been associated with increased mortality in North America,15,16,17 while in Spain18 association between periods of unusually hot weather and mortality have been demonstrated. Many studies19–21 have commented on a U-shaped relationship between temperature and mortality, demonstrating an increase in mortality associated with both cold spells in winter and hot spells in summer. This paper describes the seasonal pattern of mortality in Scotland between 1981 and 1993 with reference to how this pattern varies according to socioeconomic status before assessing the direct effect of short-term falls in temperature.
Methods Information about the date and cause of death, sex, age, area of residence and social class by occupation for all deaths in Scotland between 1 January 1981 and 31 December 1993 were provided by the General Register Office for Scotland. Maximum and minimum daily temperatures recorded at Aberdeen, Edinburgh and Glasgow (the three main weather stations in Scotland) were provided by the Meteorological Office for the same period. Due to noise in the daily series weekly average temperature values were used in the final analysis.
274
SEASONAL VARIATION IN MORTALITY IN SCOTLAND
275
Table 1 Seasonal percentage increase in mortality from summer to winter (with 95% CI) Age group Cause of death Ischaemic heart disease
M F
Cardiovascular disease
Cancer Others Total
10–59
60–69
70–79
80+
All ages
20 (17,23)
27 (25,29)
42 (39,44)
46 (43,49)
34 (33,35) 36 (35,37)
5 (–1,10)
26 (20,31)
33 (29,36)
36 (34,38)
39 (37,41)
685 (293,1077)
28 (21,36)
23 (18,28)
37 (33,40)
44 (40,48)
36 (33,38)
44 (24,64)
26 (19,34)
33 (28,39)
38 (34,41)
37 (34,39)
36 (34,38)
M
241 (189,292)
73 (64,81)
90 (83,96)
84 (80,89)
95 (91,100)
89 (86,91)
F
193 (137,249)
80 (70,91)
104 (96,112)
107 (102,112)
124 (120,127)
114 (111,117)
M
7 (–21,35)
1 (–2,4)
3 (1,6)
5 (3,7)
9 (6,12)
4 (3,5)
F
26 (–1,62)
6 (3,9)
6 (3,8)
4 (1,6)
4 (2,7)
5 (3,6)
M F
Respiratory disease
0–9 16 (–200,233)
M
14 (8,19)
3 (1,5)
10 (8,12)
14 (12,15)
24 (21,26)
12 (11,13)
F
20 (13,26)
12 (9,14)
12 (10,14)
16 (14,17)
26 (25,28)
18 (17,19)
M
17 (11,22)
12 (10,13)
22 (21,24)
33 (31,34)
44 (42,45)
29 (28,30)
F
23 (16,29)
18 (16,20)
26 (24,27)
32 (31,33)
43 (42,44)
34 (33,35)
Weekly variation in mortality was examined for all causes of death and separately for diseases of the respiratory system (ICD-9 460–519), ischaemic heart disease (IHD, ICD-9 410–414), cerebrovascular disease (CVD, ICD-9 430–438) and all cancers (ICD-9 140–239). These groupings were preferred in order to reduce the effects of possible confounding between individual causes of death (for example, between influenza-like illnesses and other respiratory causes). Seasonal variation for deaths from cancers is small; these deaths were included to provide a comparison with groups of causes known to exhibit seasonal variation. Commonly, seasonal patterns of mortality are described by comparing monthly numbers of deaths. This can be as the ratio of deaths in the first quarter of the year to the third quarter,2 a comparison of the number of deaths from December to March with those in the remaining 8 months of the year4,13,22 or as the amplitude of a fitted cosine curve.3,9,10 The first two methods involve predetermining where the peak in mortality is expected to occur while with the simple cosinor analysis there are often too few data points and no adjustment for the fact that the data are Poisson. In this analysis the seasonal pattern was estimated using Poisson regression analysis on weekly data. Firstly the trend was fitted using yt = a + bt where yt is the number of deaths in week t, t = 1,….,676 this gave an expected number of deaths per week assuming no seasonal variation was present. Then a generalized linear model with a Poisson error and a log link of the form ln(yt) = α cos(ωt) + β sin(ωt), where ω =
2π 52
was fitted using the expected values as an offset term. The inclusion of the offset term meant that when λ = √ α 2 + β 2 was computed λ represents the amplitude of the seasonal curve expressed as a ratio of the mean number of weekly deaths. This can then be expressed as the percentage increase in mortality from summer to winter. The relationship between patterns of mortality and temperature was assessed using a time series regression model. Zeger23
described an approach that enables time series methodology to be applied within the framework of a generalized linear model. This method involves modelling the weekly number of deaths in a Poisson regression analysis and assessing the significance of short-term changes in weekly average temperature. The model controlled for long-term and seasonal trends in mortality, serial auto-correlation (AR(1) model), over-dispersion and influenza epidemics. The temperature terms in the model measure the effects of short-term changes in temperature over and above average annual variation. The parameter estimates obtained from the model were expressed as the percentage change in deaths following a fall in temperature of 1°C. This change in mortality was assessed for up to 5 weeks after the fall in temperature. The modelling was carried out using Splus.
Results The results of the sinusoidal analysis of weekly mortality are shown in Table 1. For all causes, the percentage summer to winter difference in weekly mortality rates is about 30% which, in Scotland for these years, translates into 350 extra deaths per week during the winter peak compared to the summer trough. The increase is principally attributable to respiratory disease (with summer to winter variation of 89% for males and 114% for females); IHD (with seasonal increases of 34% and 36%) and CVD (36% for both males and females). In contrast, seasonal variations in cancer deaths were only about 5%. As contributions to overall mortality, these changes need to be seen in the context of the pattern of Scottish deaths: respiratory deaths comprise 11% of the total and IHD deaths almost 30%. Although seasonal variation in respiratory deaths was greater than that for IHD, each cause of death contributes an extra 100 deaths per week in the winter peak compared to the summer trough. Seasonal variation in weekly death rates was related to the extremes of age and especially marked for respiratory deaths in children aged 0–9 years when the summer to winter difference was in excess of 200%. Even at ages 10–59, however, seasonal differences remain substantial with increases in IHD rates of 20% and 26% and an excess of CVD rates of 28% and 26% for
276
INTERNATIONAL JOURNAL OF EPIDEMIOLOGY
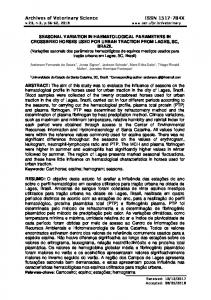
Figure 2 Deaths among men in each week of the year shown relative to the average (mean) weekly number of deaths during the period 1981–1993, by social class. Data are shown as 5 point moving averages Figure 1 Numbers of deaths in each week of the year between 1981 and 1993. The solid dark line represents the mean number of deaths. The shaded area represents the maximum and minimum number of deaths, and the broken circular line illustrates the pattern which would be expected if seasonal variation was not present
the two sexes at these ages. At ages over 60, respiratory disease death rates almost double in winter, and in those aged 10–59 increase by about 75%. All these seasonal increases are significant as the 95% CI demonstrate. For deaths from all causes seasonal variation in mortality increased significantly with age. The CI for the very young age group are large mainly because of the small numbers involved. The pattern of these changes is illustrated in Figure 1 which represents weekly deaths in circular form. In this Figure, the broken line represents the number expected if there was no seasonal variation and the solid line the average weekly number of actual deaths. The dark shaded area represents 25th and 75th percentiles and the light shaded area represents the maximum and minimum in a given week over this 13-year period. On average, the weekly number of deaths was greater than that expected from late October to mid-May with a pronounced steepening of this difference from November to January and a fairly slow return to the expected number during the later winter and early spring months. A second feature, however, is that there is much greater weekly variation (the shaded areas) in winter than in summer when the maximum and minimum range is much closer to the weekly average. The large peak in the weekly maximum for December reflects the 1989 influenza epidemic;24 other year-to-year variation in weekly winter deaths is similarly attributable to influenza epidemics. Figure 2 describes this pattern of weekly deaths throughout an ‘average’ year but divides the seasonal effect between three groupings of the Registrar General’s social classes. The social class analysis was restricted to male deaths because of uncertainties about the use of this classification for female deaths. For social
classes I and II, weekly death rates at the peak of the winter cycle were 17% greater than those of the annual average but 24% greater for social classes IV and V with social class III deaths occupying an intermediate position. This difference in the ratio of weekly deaths to annual average almost reached statistical significance during the 4-week period covering late December/ early January (P = 0.055). However, this was the only time in the year where clear social class differences were identified. No similar pattern was observed when the data were grouped according to area-based Carstairs25 deprivation categories. However the decline in death rates between the 1981 and 1991 Censuses has been shown to be greater in affluent localities than in those categorized as deprived.26 A decline in seasonal variation in mortality was also observed between the two censuses. In 1981–1983, the seasonal increase in mortality was 35% for male deaths and 42% for female deaths: in 1991–1993, the seasonal variation was 23% for males and 29% for females although the CI of these proportions overlapped. In a further analysis comparing the change in seasonal patterns between 1981–1983 and 1991–1993 the change in the autumn/winter differential was greatest in the deprived category. Figure 3 shows the percentage fall in death rates by season in the three main Carstairs categories between 1981–1983 and 1991–1993. The percentage fall in death rates was lower in the deprived category compared to the affluent category in every season except winter. The reduction in the winter rate in the deprived category was almost three times that for the autumn rate, whereas in the affluent category, the winter reduction was less than twice that for the autumn weeks. Thus, between the two censuses, the seasonal pattern in the deprived category reduced at a greater rate than in the affluent category although this differential in level of reduction failed to reach statistical significance. The lagged effect of reductions in temperature across the year (modelled using Zeger’s method and including influenza
SEASONAL VARIATION IN MORTALITY IN SCOTLAND
277
Figure 3 Percentage fall in seasonal mortality variation between 1981–83 and 1991–93 by deprivation category
Figure 5 Percent change in mortality following a 1 degree change in temperature by average temperature
Figure 4 Percent change in mortality associated with a 1 degree fall in temperature
deaths) is summarized in Figure 4. A 1°C reduction in weekly average temperatures resulted in an increase in mortality of the order of 1% although with a lag that persisted for several weeks. For CVD, the associated increase in deaths was weakest, but with a significant increase in mortality that lasted for 3 weeks. The IHD deaths exhibited a more immediate response with a statistically significant increase of around 1% in the week of the fall in temperature (0.9%, 95% CI : 0.66,1.13) and one week later (1.04%, 95% CI : 0.78,1.29) but little relationship thereafter. The effect on deaths attributed to respiratory disease was less immediate and had a much longer lag period—a 1°C fall in temperature in week 0 was associated with significantly
increased respiratory deaths 4 weeks later. A residual analysis showed that the residuals were almost free of auto-correlation and were normally distributed. No difference was found in the direct effects of temperature on mortality when the data were analysed separately according to social class and area-based deprivation categories. Similarly there was no difference between the three cities, Glasgow, Edinburgh and Aberdeen when city-based mortality rates were associated with weekly temperature in each city. Figure 5 describes these relationships at different underlying temperatures. In week 0, the week that the fall in temperature occurred, mortality increased by 1.06% (95% CI : 0.10,2.03) when the underlying temperature was less than 2°C and by around 0.8% when the underlying temperature was between 2°C and 10°C. When the temperature was milder, between 10°C and 14°C the increase in mortality related to a fall in temperature was negligible. A significant fall in mortality however occurred when the temperature was hot, over 14°C. At this underlying temperature a fall of 1°C was associated with a 1% (95% CI : 0.32,1.64) fall in mortality. Lag effects were observed for all these lower temperatures but with an enhanced short-term effect when the underlying baseline temperature was less than 2°C: at these temperatures, the effect of a further 1°C fall was a 1.15% (95% CI : 0.54,1.77) increase in mortality in the succeeding week. These increases are offset by reduced mortality at these lower temperatures in week 2, the effect in later weeks is less clear. The pattern is one of a direct link at low temperatures up to one week after the fall in temperature, with a reverse effect at high temperatures during the week of the fall in temperature. A more complex pattern of association occurs at longer lag periods for temperatures when the influence of temperature per se may be mediated by other environmental variables.
278
INTERNATIONAL JOURNAL OF EPIDEMIOLOGY
Discussion This study has shown that seasonal variation in mortality in Scotland is still a significant public health problem. The annual average seasonal increase in mortality between 1981 and 1993 was 29% for females and 34% for males. During the study period influenza epidemics occurred every 3–4 years. For each recorded death from influenza, there was an increase in deaths from all causes of 1.4%. However during an influenza epidemic the increase in all-cause mortality associated with the epidemic was considerably greater. One hypothesis to explain these seasonal variations in mortality is that they simply represent shifts in the timing of events that lead to death. The effects of season or temperature could be seen as a kind of ‘harvesting’ of vulnerable members of the population. This view might be supported by the age gradients and causes of death, which demonstrate the greatest seasonal variation. However, it would require a detailed prospective study involving information about the prior health of those dying in different seasons to investigate this hypothesis further. The fact that seasonal variation in mortality fell during the study period, that the degree of change was greater in deprived areas compared to affluent areas and that social class differences were only evident in the winter weeks would also lend support to this hypothesis. Although no significant differences were found these observations indicate that while socioeconomic status has some effect on seasonal variation the strength of this association has declined. Indeed an analysis of seasonal variation according to deprivation category failed to display a similar pattern to that for social class. Similar results were found recently for London.27 Improvements in environmental characteristics such as the quality of housing, increased use of central heating and other factors closely related to socioeconomic progress could explain this apparent fall in seasonal variation in mortality. The lack of substantial evidence of a relationship between socioeconomic status and seasonal mortality may be due to the fact that areabased measures of deprivation and individual-based social class data are not adequate proxy measures of housing conditions and fuel poverty. The observed patterns of seasonal variation are ‘driven’ by temperature. On average a fall in temperature of 1°C was associated with an increase in mortality of 1%. Many studies28–30 have examined the methods by which falling temperatures can affect the physiological mechanisms of the human body. Seasonal variations have been demonstrated in several risk factors for vascular disease, high blood pressure,31 cholesterol levels32,33 and fibrinogen concentration in the blood.34–36 The U-shaped relationship between temperature and mortality, with very hot temperatures also having an adverse effect on health, has also been described elsewhere.18,20,21 Clearly the relationship between temperature and mortality influences seasonal patterns. However it is the vulnerability of a population and the ability of the population to protect themselves from this relationship which may determine the degree of seasonal variation in mortality experienced. Britain is generally considered to have a mild climate and, perhaps because of the perception of climate, has less strict building legislation than countries such as Finland.37 The fact that Scotland still experiences seasonal increases in mortality of the order of 30% while
other European countries experience lower rates may be to do with the ‘susceptibility’ of the population to changes in temperature rather than the changes in temperature themselves. This study has also shown that while slight differences in seasonal patterns in mortality can be related to socioeconomic status the ‘susceptibility’ of the population is not identified by these measures. It would be difficult experimentally to isolate and modify specific aspects of lifestyle or environment as a way of demonstrating cause and effect. However specific housing characteristics such as fuel poverty,27,38 or the presence of dampness and condensation in homes may be related to the seasonal patterns in mortality experienced in the UK. This type of information is available from sample-based house condition surveys but relating sample-based explanatory variables to population-based mortality measures could lead to spurious results. A further study using housing measures available from the census such as tenure and amenities might provide more reliable insights into the relationship. Housing improvement schemes of various kinds are now fairly widespread in Scotland. With specifically collected data it is possible to envisage more focused ‘case-control’ studies of housing improvements in terms of the health outcomes they achieve.
Acknowledgement This work was funded by the Chief Scientists’ Office of the Scottish Executive Health Department.
References 1 Langmuir AD. William Farr. Founder of modern concepts of
surveillance. Int J Epidemiol 1976;5:13–18. 2 GRO(S). Quarterly Variation in Mortality in Scotland and 12 Selected
Countries, since 1977. 1987. GRO(S). Vital Events Report. 3 Douglas AS, Allan TM, Rawles JM. Composition of seasonality of
disease. Scot Med J 1991;36:76–82. 4 Curwen M. Excess winter mortality: a British phenomenon? Health
Trends 1991;22:169–75. 5 McDowell M. Long term trends in seasonal mortality. Popul Trends
1981;26:16–19. 6 Kunst AE, Looman CWN, Mackenbach JP. The decline in winter
excess mortality in The Netherlands. Int J Epidemiol 1990;20:971–77. 7 Mackenbach JP, Kunst AE, Looman CWN. Seasonal variation in
mortality in The Netherlands. J Epidemiol Community Health 1992;46: 261–65. 8 Green MS, Harari G, Kristal-Boneh E. Excess winter mortality from
ischaemic heart disease and stroke during colder and warmer years in Israel—An evaluation and review of the role of environmental temperature. Eur J Public Health 1994;4:3–11. 9 Douglas AS, Russell D, Allan TM. Seasonal, regional and secular
variations of cardiovascular and cerebrovascular mortality in New Zealand. Aust NZ J Med 1990;20:669–76. 10 Becker S, Weng S. Seasonal patterns of deaths in Matlab, Bangladesh.
Int J Epidemiol 1998;27:814–23. 11 Seto T, Mittlemann M, Davis R, Taira D, Kawachi I. Seasonal variation
in coronary artery disease mortality in Hawaii: observational study. Br Med J 1998;316:1946–47. 12 McKee M, Sanderson C, Chenet L, Vassin S, Shkolnikov V. Seasonal
variation in mortality in Moscow. J Public Health Med 1998;20:268–74. 13 Curwen M, Devis T. Winter mortality, temperature and influenza: has
the relationship changed in recent years? Popul Trends 1988;54:17–20.
SEASONAL VARIATION IN MORTALITY IN SCOTLAND
279
14 Simonsen L, Clarke MJ, Williamson G, Stroup DF, Arden NH,
28 Keatinge WR, Coleshaw SRK, Cotter F, Mattock M, Murphy M,
Schonberger LB. The impact of influenza epidemics on mortality: introducing a severity index. Am J Public Health 1997;87:1944–50.
Chelliah R. Increases in platelet and red cell counts, blood viscosity, and arterial pressure during mild surface cooling: factors in mortality from coronary and cerebral thrombosis in winter. Br Med J 1984;289: 1405–08.
15 Rogot E, Padgett SJ. Associations of coronary and stroke mortality
with temperature and snowfall in selected areas of the United States, 1962–66. Am J Epidemiol 1976;103:565–75. 16 Anderson TW, Rochard C. Cold snaps, snowfall and sudden death
from ischaemic heart disease. CMA Journal 1979;121:1580–83. 17 Baker-Blocker A. Winter weather and cardiovascular mortality in
Minneapolis-St. Paul. Am J Public Health 1982;72. 18 Saez M, Sunyer J, Castellsague J, Murillo C, Anto JM. Relationship
between weather temperature and mortality: A time series analysis approach in Barcelona. Int J Epidemiol 1995;24:576–82. 19 Enquselassie F, Dobson AJ, Alexander HM, Steele PL. Seasons,
Temperature and coronary disease. Int J Epidemiol1993;22:632–36. 20 Heunis JC, Olivier J, Bourne DE. Short-term relationships between
winter temperatures and cardiac disease mortality in Cape Town. SA Med J 1985;85:1016–19. 21 Pan W-H, Li L-A, Tsai M-J. Temperature extremes and mortality from
coronary heart disease and cerebral infarction in elderly Chinese. Lancet 1995;345:353–55. 22 Laake K, Sverre JM. Winter excess mortality: a comparison between
Norway and England plus Wales. Age Ageing 1996;25:343–48. 23 Zeger SL. A regression model for time series of counts. Biometrika
1988;75:621–29. 24 Curwen M, Dunnell K, Ashley J. Hidden influenza deaths:1989–1990.
Popul Trends 1990;61:31–33. 25 Carstairs V, Morris R. Deprivation and Health in Scotland. Aberdeen:
Aberdeen University Press, 1992. 26 McLoone P, Boddy FA. Deprivation and Mortality in Scotland:1981
and 1991. Br Med J 1994;309:1465–70. 27 Shah S, Peacock J. Deprivation and excess winter mortality.
J Epidemiol Community Health 1999;53:499–502.
29 Fleming DM, Cross KW, Crombie DL, Lancashire RJ. Respiratory
illness and mortality in England and Wales. Eur J Epidemiol 1993;9: 571–75. 30 Monto AS, Sook KL. The Tecumseh Study of Respiratory Illness. III
Incidence and periodicity of Respiratory syncytial virus and mycoplasma pneumoniae infections. Am J Epidemiol 1971;94:290–301. 31 Brennan PJ, Greenberg G, Miall WE, Thompson SG. Seasonal
variation in arterial blood pressure. Br Med J 1982;285:919–23. 32 Dobson HM, Muir MM, Hume R. The effect of ascorbic acid on the
seasonal variations in serum cholesterol levels. Scot Med J 1984;29: 176–82. 33 MacRury SM, Muir M, Hume R. Seasonal and climatic variation
in cholesterol and vitamin C: effect of vitamin C supplementation. Scot Med J 1992;37:49–52. 34 Stout RW, Crawford V. Seasonal variations in fibrinogen concen-
trations among elderly people. Lancet 1991;338:9–13. 35 Woodhouse PR, Tee Khaw K, Plummer M, Foley A, Meade TW.
Seasonal variations of plasma fibrinogen and factor VII activity in the elderly: winter infections and death from cardiovascular disease. Lancet 1994;343:435–39. 36 Meade TW, Brozovic M, Chakrabarti RR et al. Haemostatic function
and ischaemic heart disease: Principal results of the Northwick Park Heart Study. Lancet 1986;Sept.6:533–37. 37 Boardman, B. Seasonal Mortality and Cold Homes. 1–21. 1986.
University of Warwick, Watford Printers Limited. Unhealthy Housing. Conference held at University of Warwick, 14th–16th December, 1986. Conference Proceedings. 38 Watt GCM. Health implications of putting value added tax on fuel.
Br Med J 1994;309:1030–31.